


InfoWARE AI Analyst Daily Market Report: 09-Sep-2025 | InfoWARE Finance
Get IDIA - the stock trading app for the modern investor


InfoWARE AI Analyst Daily Market Report: 09-Sep-2025
(Source: InfoWARE Terminal, Date: 09-Sep-2025)
Dear Investor,
NGX Daily Market Summary – Tuesday, September 9, 2025
Today's session delivered a modest +0.29% uptick for the NGX All Share Index (ASI), closing at 139,394.75. Year-to-date returns now sit at an impressive +35.49%. Despite the green close, overall market turnover dipped significantly by -34.78% to ₦10.58B, with trading volume sharply lower as well. Market breadth was firmly positive at 1.61x (37 advancers vs. 23 decliners), though advancing volume was outpaced by declines across most listed stocks. Today's trading was marked by dynamic moves in insurance and financials, huge institutional participation in a handful of financial stocks, and several eye-catching spikes in trading volumes. Let's dig into the trends, winners, losers, and undercurrents shaping today's tape.
Market Breadth & Trading Trends
- Market Breadth: Solidly positive with 37 advancers and 23 decliners, translating to a breadth ratio of 1.61x.
- Volume Trends: Volumes up in 54 companies, down in 88, despite overall lighter trading. Unusual volume flags on names like FCMB (+230% vs. 90D avg), MECURE (+412%), and CHELLARAM (+813%).
- Institutional vs. Retail Activity: Institutional trades accounted for 69.91% of volume and a commanding 85.86% of trade value, indicating strong "big money” involvement in select financials. Retail participation high in count (63%), but contributed less than 15% of trade value.
Daily Top Gainers & Losers
| Symbol | Stock | Close | %Change | RSI | MACD | Beta |
|---|---|---|---|---|---|---|
| REGALINS | REGENCY ALLIANCE INSURANCE | 1.43 | +10.00% | 52.4 | 0.02 | 0.47 |
| ETRANZACT | E-TRANZACT INT’L | 12.4 | +9.73% | 54.3 | -0.03 | 0.58 |
| MECURE | MECURE INDUSTRIES | 21.6 | −9.92% | 53.9 | 0.49 | 0.00 |
| MERGROWTH | MERISTEM GROWTH ETF | 414.9 | −10.00% | 43.5 | -63.8 | -2.31 |
- REGALINS led the session with a seamless move up (+10.00%), moderate RSI (near-neutral) and a mild positive MACD suggest a steady, but not overblown, uptrend.
- MECURE posted the largest decline (-9.92%), but with a near-neutral RSI (53.9) and positive MACD, the selloff may be more about rotation or a reaction to previous overextension than technical breakdown.
- Unusual Volume: FCMB, CUSTODIAN, MECURE, and CHELLARAM all traded >200% of their average volume—potentially signaling institutional repositioning or speculative churn.
5-Day and YTD Leaders & Laggards
| Symbol | Name | Price | 5Dys %Chg | YTD %Chg | RSI | MACD |
|---|---|---|---|---|---|---|
| REGALINS | REGENCY ALLIANCE INSURANCE | 1.30 | +10.00 | +116.67 | 52.4 | 0.02 |
| ROYAL EXCHANGE | ROYALEX | 2.06 | +19.68 | +97.37 | 51.4 | -0.05 |
| AIICO | AIICO INSURANCE | 3.83 | +14.61 | +148.45 | 53.0 | 0.07 |
| ETRANZACT | E-TRANZACT INT’L | 11.30 | +20.39 | +90.77 | 54.3 | -0.03 |
| DAARCOMM | DAAR COMMUNICATIONS | 0.94 | +19.77 | +68.85 | 49.7 | -0.03 |
| Symbol | Name | Price | 5Dys %Chg | YTD %Chg | RSI | MACD |
|---|---|---|---|---|---|---|
| VSPBONDETF | VETIVA S & P SOV BOND ETF | 200.00 | -20.67 | -39.71 | 47.2 | -26.11 |
| GREENWETF | GREENWICH ASSET ETF | 256.05 | -10.00 | -52.05 | 47.2 | -21.4 |
| MERGROWTH | MERISTEM GROWTH ETF | 414.9 | -18.96 | +5.17 | 43.5 | -63.79 |
| FTNCOCOA | FTN COCOA PROCESSORS | 5.96 | -9.24 | +187.23 | 50.4 | -0.22 |
| UNIONDICON | UNION DICON SALT | 10.80 | -10.00 | +50.00 | 51.3 | 0.08 |
- Momentum overlap: REGALINS, ROYALEX, and ETRANZACT feature on both the daily and year-to-date top gainers – these are names enjoying sustained bullish momentum, supported by healthy RSI (mid 50s) and price above both 15D/50D moving averages.
- Contrarian signals: MERGROWTH – sharp daily drop (-10%), negative MACD, but YTD still +5.17% – remains volatile with conflicting signals.
Bullish & Bearish Momentum Signals (Technical Pattern Screener)
- Bullish cross above 15DMA: REGALINS, DEAPCAP, ROYALEX, UPL, MCNICHOLS, GUINEAINS, LASACO, AIICO, among others—most within insurance/financials. Notably, REGALINS, ROYALEX, AIICO, and LASACO all appear in 5D/YTD momentum lists, emphasizing sector strength.
- Bearish cross below 15DMA: Limited to a few names (HONYFLOUR, FGSUK2033S6—mostly bonds). The broader market uptrend means these underperformers could offer contrarian opportunities, but require further scrutiny.
- RSI extremes: No daily stocks flagged with RSI >70 (overbought) or <30 (oversold), suggesting current moves are sustainable, not extended.
Contrarian Signals
- CHAMPION (YTD +338.32%): RSI of 54.4 (neutral), MACD showing preliminary bullish reversal despite a -9.8% YTD hit. This balance of technicals with a major run may hint at an impending recovery or short-term technical bounce.
- MECURE (YTD +0.56%, Today -9.92%): RSI is steady at 53.9, MACD positive, yet price tumble—possible anomaly ripe for short-term rebound.
- MERGROWTH: continued volatility; large negative MACD offset by moderate RSI and a positive YTD return, underscoring market uncertainty in this ETF.
Sector Heatmap & Institutional/Retail Activity
| Sector | Names in Momentum | Retail Activity (%) | Institutional Activity (%) |
|---|---|---|---|
| Insurance | REGALINS, AIICO, LASACO, GUINEAINS | Moderate | Moderate/High |
| Financials | UPL, ROYALEX, ACCESSCORP | High | Very High |
| Consumer Goods | DAARCOMM, DEAPCAP | Light | N/A |
| Others/ETFs | MERGROWTH, VSPBONDETF | Low | Low |
- Insurance and financials are the dominant theme, both technically and from a flows perspective.
Dividend–Beta Matrix (Defensive Stock Screen)
| Stock | Dividend Yield (%) | Beta | In Bullish Table? |
|---|---|---|---|
| AIICO | 4.13 | 1.33 | Yes |
| REGALINS | 6.52 | 0.47 | Yes |
| MANSARD | 4.59 | 0.62 | Yes |
| LASACO | 4.05 | 0.71 | Yes |
| CUTIX | 6.52 | 0.70 | Yes |
- Observation: Insurance sector stalwarts like REGALINS and AIICO offer solid yields with sub-market Beta, providing attractive defensive opportunities that also happen to sit in the bullish technical tables—an unusual and favorable combination for income-focused investors.
Institutional Clustering Alerts
- ZENITHBANK: 20.17% of institutional trade value share (₦556M) today; strong signal of continued big-money interest. Top five institutional trades centered on financials (ZENITHBANK, GTCO, UBA) plus large insurers, matching retail action in names like ACCESSCORP. Watch for sector-wide "herding” effects.
Additional Market Activity Analysis
- Top 5 Most Traded (Institutional): FIRSTHOLDCO, ACCESSCORP, ZENITHBANK, UBA, GTCO—all financial names. Correlation: these are sector leaders, often with high liquidity and institutional focus, and several are present in both bullish and volume surge tables.
- Top 5 Most Traded (Retail): MTNN, ACCESSCORP, ZENITHBANK, GTCO, UBA—again, a strong echo of institutional focus, with minor skew toward the market’s largest cap (MTNN).
- Retail activity is high (63% of trade count), but dwarfed in value by institutional flows (85.9% by value). Retail investors are strongly following institutional flows, especially in financials, suggesting a "trend following” environment. Caution: if the big money pivots or takes profits, retail flows may get trapped.
Key Hidden Insights & Subtle Patterns
- Bullish pressure in insurance names coincides with high dividend yields and moderate betas—an ideal "sweet spot” for risk-adjusted returns.
- Overlaps: REGALINS, ROYALEX, AIICO, and LASACO are present in the YTD Gainers, daily gainers, and bullish cross tables. These are top conviction momentum plays, especially with supporting RSI/MACD patterns and above-average volumes.
- Most bearish stocks (by technicals) are bonds/ETFs, not equities—suggesting rotation out of fixed income and into NSX equities, especially financials.
- Volume spikes (FCMB, MECURE, CHELLARAM) are not mirrored with extreme technicals (no overbought/oversold RSI), pointing to accumulation/distribution by larger players rather than emotional retail frenzies.
- High-yield stocks in bullish tables: REGALINS (6.5%), AIICO (4.1%), LASACO (4.1%)—suggests strong total return potential combining capital appreciation and yield.
Trader Takeaways & Cautions
- Focus on insurance and financials for momentum and yield, but look to lock in partial gains as RSI inches closer to overbought levels in coming sessions.
- Keep eyes on sudden volume spikes—use as early indicators that "big money” is positioning ahead of news or trend reversals.
- Monitor bond ETFs for contrarian value: significant YTD underperformance and recent selling suggests these may soon offer defensive entry points if equity momentum stalls.
- Retail flows are chasing institutional favorites; don’t overpay or hold laggards if institutional sentiment shifts.
- Contrarian opportunities in names like CHAMPION and MECURE—where technicals signal stabilization despite price dips—may present short-term bounce trades for nimble traders.
Summary: Today’s market offers a strong blend of risk-on momentum (insurance/financials), defensive yield, and institutional herding. Stay nimble, watch for mean reversion in overextended bond ETFs, and use unusual volume moves as "smoke signals” for coming volatility. Monitor key insurance names for potential overbought pullbacks, but ride the wave as the uptrend remains well supported by both technicals and flows.
|
Top ASI Gainers Over Last 5 Trading Days
|
Top ASI Losers Over Last 5 Trading Days
|
For more detailed analysis, on InfoWARE Market Data Terminal <NSEPERF> <GO>
On InfoWARE Finance Mobile App (Android, iPhone & iPad, Windows Phone and Windows 8/10), "Top Gainers & Losers"
REGENCY ALLIANCE INSURANCE COMPANY PLC (REGALINS) topped the advancers list closing at N1.43 with a gain of 10.00% followed by MECURE INDUSTRIES PLC (MECURE) which closed at N21.60 with a gain of 9.92%.
On the flip side MERISTEM GROWTH EXCHANGE TRADED FUND (MERGROWTH) and UNILEVER NIGERIA PLC. (UNILEVER) topped the decliners log with a loss of -10.00% at a close of N414.90, and -9.79% to close the day at N63.15 respectively.
| Symbol | LClose | %Chg |
|---|---|---|
| REGALINS | 1.43 | 10.00 |
| MECURE | 21.60 | 9.92 |
| ETRANZACT | 12.40 | 9.73 |
| DAARCOMM | 1.03 | 9.57 |
| DEAPCAP | 1.84 | 9.52 |
| Symbol | LClose | %Chg |
|---|---|---|
| MERGROWTH | 414.90 | -10.00 |
| UNILEVER | 63.15 | -9.79 |
| FTNCOCOA | 5.40 | -9.40 |
| ELLAHLAKES | 13.02 | -8.76 |
| LINKASSURE | 2.04 | -6.85 |
For more detailed analysis,
- On InfoWARE Market Data Terminal <TOPG> <GO>
- On InfoWARE Finance Mobile App ( Android, iPhone & iPad and Windows 10) , "Top Gainers & Losers"
Currency Market
In the currency market, the Naira was unchanged against the dollar at 1 to 1NSE: Bull Signal - Price crossed above 15 Day MA
This signal implies these stocks are under buying pressure and the price might continue to rise and therefore positions should be monitored closely. Further suggested analysis include looking at the overall market (ASI) to see if the uptrend is market wide, sector wide or specific to the stock. Portfolio managers tend to use this as a signal to do more research to add to their positions or lock in some profits. Typically further analysis should be done using commands like PC and RV on the InfoWARE Market Data Terminal. Another command is ALERTS to set price triggers for possible exit or entry as necessary
For more detailed analysis,
- On InfoWARE Market Data Terminal <NSEPERF> <GO>
- On InfoWARE Finance Mobile App ( Android , iPhone & iPad and Windows 10) , "Top Gainers & Losers"
| Symbol | Price | %Chg | 15DMA | PE | EPS | DivY | MktCap | Vol | Trades | Value | LstTradeTime |
|---|---|---|---|---|---|---|---|---|---|---|---|
| REGALINS | 1.43 | 9.09 | 1.35 | 4.35 | 0.11 | 6.52 | 9.54B | 30.98M | 262.00 | 43.84M | 09-Sep-2025 14:30:09.817 |
| DEAPCAP | 1.84 | 8.70 | 1.76 | 188.84 | 0.01 | 13.76 | 2.76B | 3.77M | 96.00 | 6.67M | 09-Sep-2025 14:30:09.073 |
| ROYALEX | 2.25 | 8.44 | 2.12 | 0.00 | 0.00 | 7.81 | 11.58B | 6.53M | 181.00 | 14.65M | 09-Sep-2025 14:30:09.830 |
| UPL | 5.99 | 8.18 | 5.79 | 7.13 | 0.59 | 0.60 | 2.58B | 1.24M | 82.00 | 7.45M | 09-Sep-2025 14:30:10.123 |
| MCNICHOLS | 3.80 | 7.63 | 3.59 | 26.80 | 0.05 | 5.88 | 2.73B | 1.10M | 61.00 | 3.97M | 09-Sep-2025 14:30:25.173 |
| GUINEAINS | 1.64 | 7.32 | 1.59 | 66.79 | 0.01 | 1.96 | 10.07B | 5.92M | 135.00 | 9.64M | 09-Sep-2025 14:30:09.250 |
| LASACO | 3.32 | 6.63 | 3.23 | 21.56 | 0.11 | 4.05 | 6.09B | 3.91M | 100.00 | 12.69M | 09-Sep-2025 14:30:22.783 |
| NGXGROWTH | 12,002.26 | 6.55 | 11,286.86 | 18.83 | 0.18 | 0.00 | 0.00 | 3.73M | 220.00 | 34.60M | 09-Sep-2025 14:30:12.083 |
| MANSARD | 16.79 | 5.78 | 16.22 | 31.16 | 0.24 | 4.59 | 151.11B | 957.18K | 135.00 | 15.54M | 09-Sep-2025 14:30:09.470 |
| JAPAULGOLD | 2.78 | 4.68 | 2.72 | 0.19 | 12.01 | 0.90 | 17.41B | 19.97M | 234.00 | 54.79M | 09-Sep-2025 14:30:09.360 |
| AIICO | 4.00 | 4.25 | 3.95 | 2.01 | 0.60 | 4.13 | 146.42B | 16.05M | 634.00 | 64.75M | 09-Sep-2025 14:30:22.750 |
| INTBREW | 12.80 | 3.91 | 12.68 | 0.00 | 0.00 | 6.23 | 343.83B | 806.03K | 109.00 | 10.12M | 09-Sep-2025 14:30:09.323 |
| CUTIX | 3.50 | 2.00 | 3.48 | 8.81 | 0.26 | 6.52 | 12.33B | 6.74M | 297.00 | 23.73M | 09-Sep-2025 14:30:08.820 |
| LEGENDINT | 5.50 | 1.09 | 5.48 | 0.00 | 0.00 | 2.73M | 93.00 | 15.00M | 09-Sep-2025 14:30:22.797 | ||
| DANGCEM | 520.20 | 0.00 | 520.11 | 761.31 | 0.63 | 6.27 | 8,864.47B | 93.30K | 531.00 | 48.28M | 09-Sep-2025 14:30:23.193 |
| SIAMLETF40 | 586.11 | 0.00 | 585.76 | 0.00 | 0.00 | 0.00 | 0.00 | 0.00 | 09-Sep-2025 14:30:23.113 | ||
| STANBICETF30 | 420.00 | 0.00 | 417.96 | 0.00 | 0.00 | 10.86K | 13.00 | 4.56M | 09-Sep-2025 14:30:23.120 |
NSE: BEAR Signal - Price crossed below 15 Day MA
This signal implies these stocks are under selling pressure and the price might continue to slide and therefore positions should be monitored closely. Further suggested analysis include looking at the overall market (ASI) to see if the downtrend is market wide, sector wide or specific to the stock. If the overal market trend is upwards, then since these stocks are heading in the opposite direction, then further analysis should be done using commands like PC and RV on the InfoWARE Market Data Terminal. Another command is ALERTS to set price triggers for possible exit is necessar
For more detailed analysis,
- On InfoWARE Market Data Terminal <BEARM> <GO>
- On InfoWARE Finance Mobile App ( Android , iPhone & iPad and Windows 10)
| Symbol | Price | %Chg | 15DMA | PE | EPS | DivY | MktCap | Vol | Trades | Value | LstTradeTime |
|---|---|---|---|---|---|---|---|---|---|---|---|
| FGS202770 | 120.00 | 0.00 | 120.67 | 0.00 | 0.00 | 0.00 | 0.00 | 0.00 | 09-Sep-2025 14:30:11.660 | ||
| TAJSUKS1 | 100.00 | 0.00 | 100.00 | 0.00 | 0.00 | 0.00 | 0.00 | 0.00 | 09-Sep-2025 14:30:26.097 | ||
| HONYFLOUR | 22.10 | -4.07 | 22.36 | 16.28 | 0.31 | 1.40 | 175.26B | 915.14K | 305.00 | 20.37M | 09-Sep-2025 14:30:09.280 |
| FGSUK2033S6 | 95.00 | -6.94 | 99.11 | 0.00 | 0.00 | 4.72K | 5.00 | 4.49M | 09-Sep-2025 14:30:26.020 |
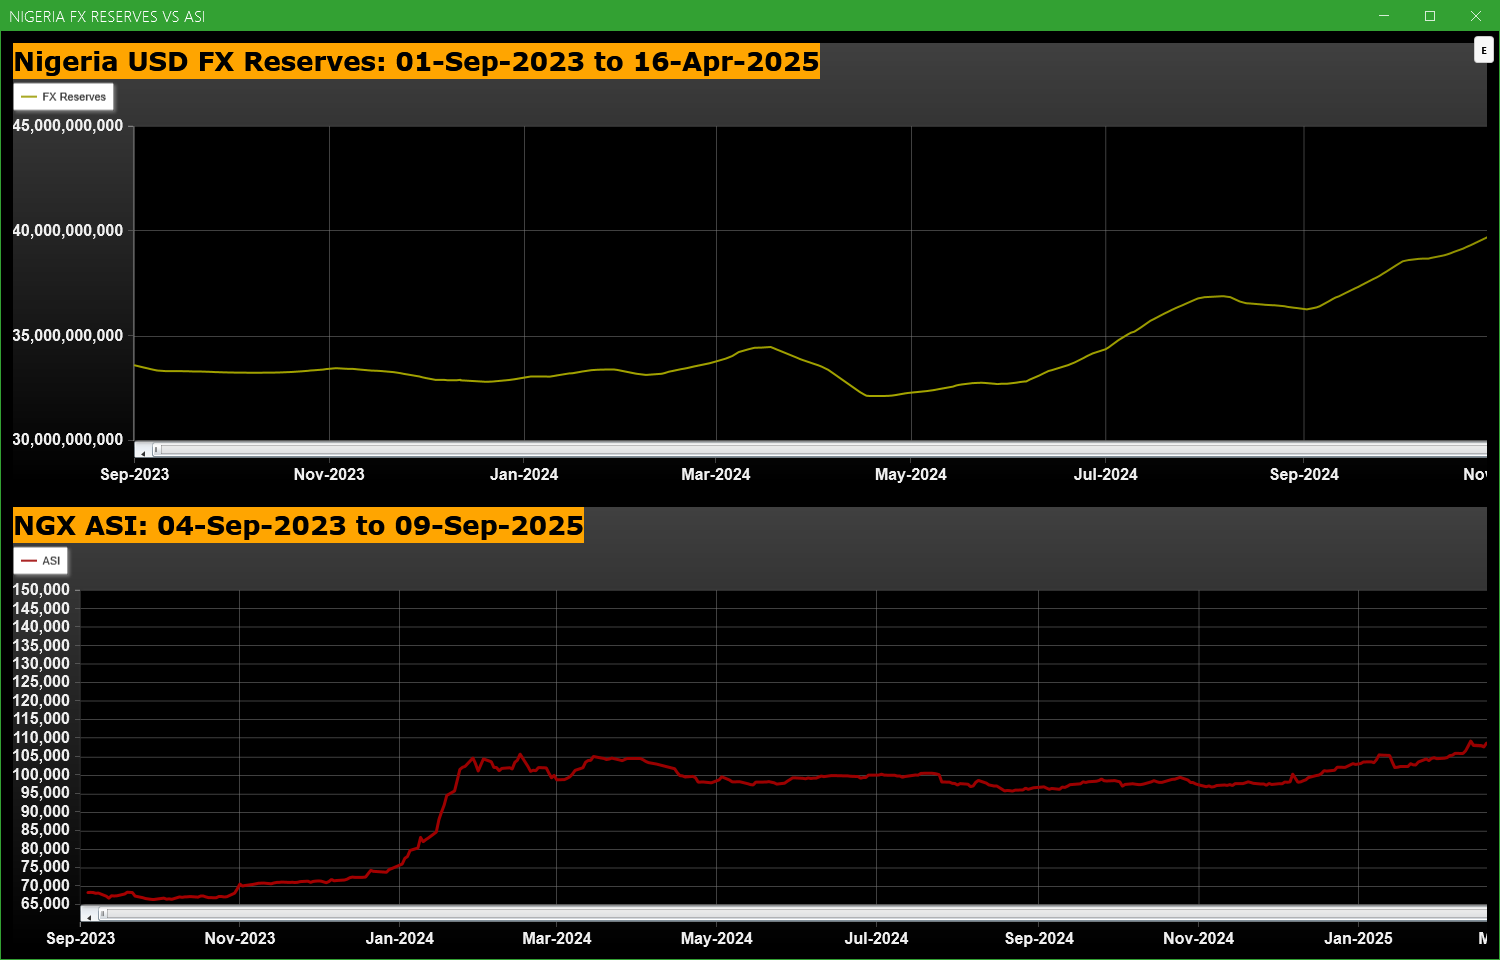
Economic Indicators - Nigeria FX Reserves Vs ASI Chart
Nigeria FX Reserves are assets held on reserve by CBN in foreign currencies. These reserves are used to back liabilities and influence monetary policy. Given the nature of the Nigeria economy, FX Reserves can appear to have an outsize influence on the economy and hence on the capital market. The chart below allows comparison of FX Reserves against the ASI to make investment decisions
For more detailed analysis,
- On InfoWARE Market Data Terminal <CI> <GO>
- On InfoWARE Finance Mobile App ( Android , iPhone & iPad and Windows 10) , "Research"
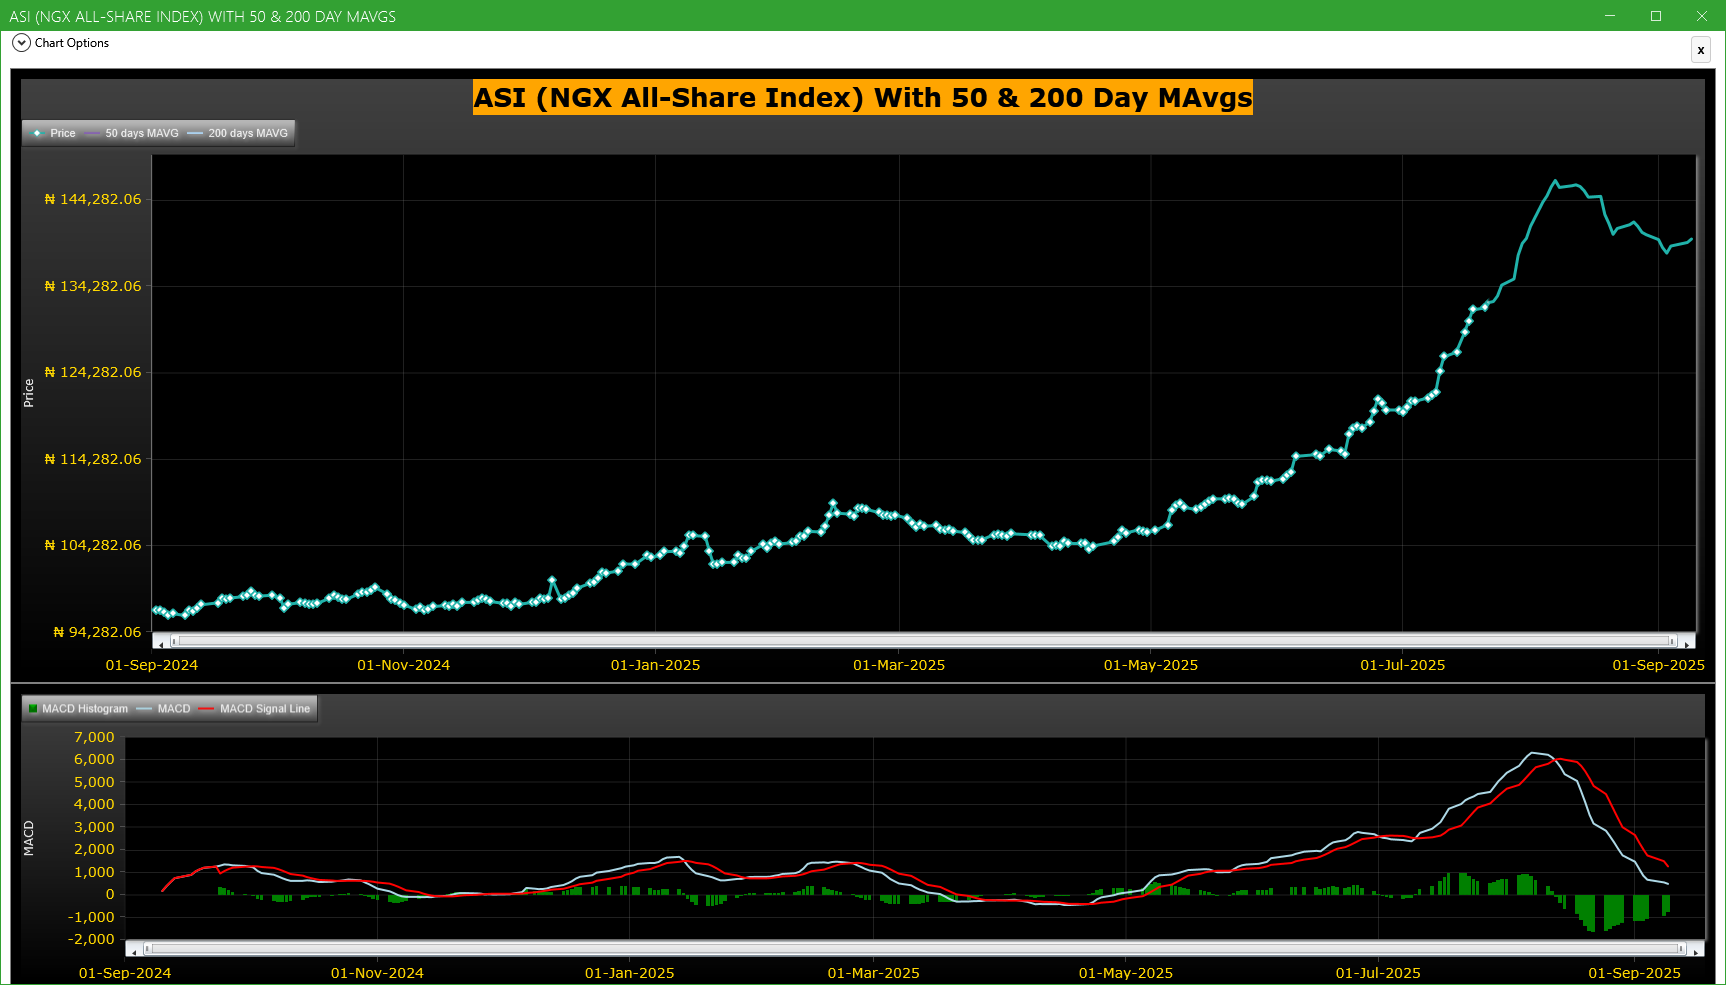
Market Trend - ASI (NGX All-Share-Index) With 50 & 200 Day MAvgs Chart
Technical traders typically use the 50 & 200 day moving averages to aid in choosing
where to enter or exit a position, which then causes these levels to act as strong
support or resistance. As a general guideline, if the price is above a moving average,
the trend is up. If the price is below a moving average, the trend is down.
It is important to note that critics of technical analysis say that moving averages act
as support and resistance because so many traders use these indicators to inform their
trading decisions. Also moving averages tend to work quite well in strong trending conditions
but poorly in choppy or ranging conditions.
Trading Strategies: Crossovers
Crossovers are one of the main moving average strategies. The first type is a price crossover,
which is when the price crosses above or below a moving average to signal a potential change
in trend. Another strategy is to apply two moving averages to a chart: one longer and one
shorter. When the shorter-term MA crosses above the longer-term MA, it is a buy signal, as
it indicates that the trend is shifting up. This is known as a golden cross. Meanwhile, when
the shorter-term MA crosses below the longer-term MA, it is a sell signal, as it indicates that
the trend is shifting down. This is known as a dead/death cross
For more detailed analysis,
- On InfoWARE Market Data Terminal <CI> <GO>
- On InfoWARE Finance Mobile App ( Android , iPhone & iPad and Windows 10) , "Research"
Unusual Volume: Volume traded is more than double the 90 day moving average (All exchanges; ASI & ASem). For more detailed analysis,
- On InfoWARE Market Data Terminal <UV> <GO>
- On InfoWARE Finance Mobile App ( Android , iPhone & iPad and Windows 10)
| Symbol | Name | Volume | 90DAvgVol | %VolChg | Price | LClose | %Chg | Trades | Value |
|---|---|---|---|---|---|---|---|---|---|
| FCMB | FCMB GROUP PLC. | 202.49M | 61.19M | 230.93 | 10.75 | 10.50 | 2.38 | 465 | 2.10B |
| FIRSTHOLDCO | FIRST HOLDCO PLC | 44.23M | 16.07M | 175.23 | 30.50 | 30.50 | 0.00 | 526 | 1.34B |
| CUSTODIAN | CUSTODIAN AND ALLIED PLC | 12.59M | 3.64M | 245.82 | 40.75 | 40.75 | 0.00 | 241 | 513.42M |
| MECURE | MECURE INDUSTRIES PLC | 3.51M | 684.21K | 412.39 | 21.60 | 19.65 | 9.92 | 46 | 75.72M |
| CHELLARAM | CHELLARAMS PLC. | 574.15K | 62.84K | 813.60 | 11.00 | 10.50 | 4.76 | 38 | 6.10M |
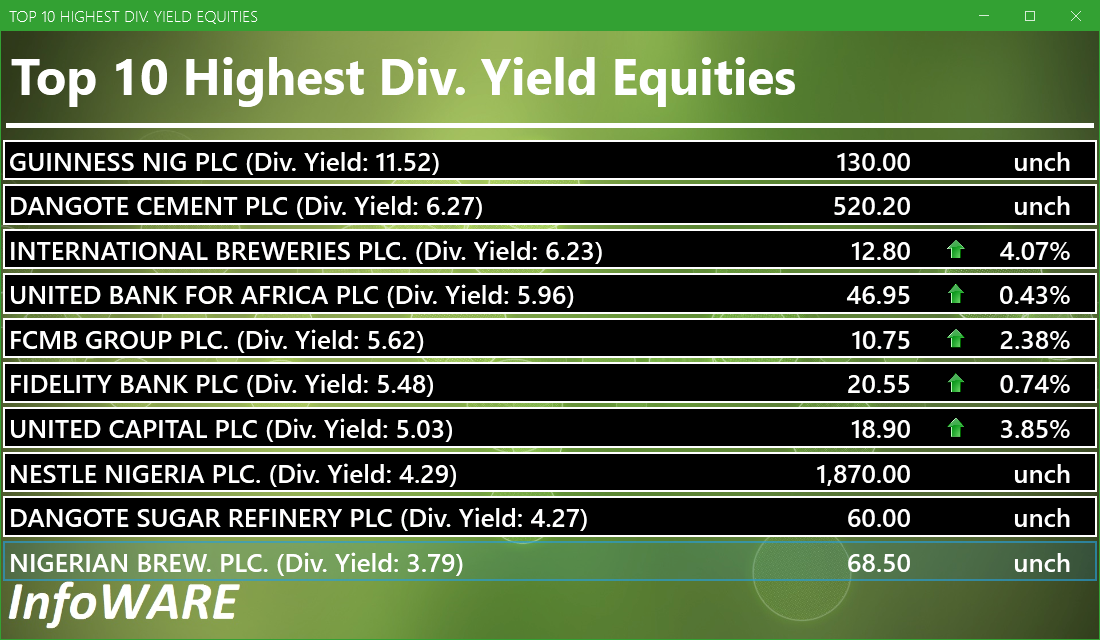
Investment Insights - High Div. Stocks
Dividend stocks distribute a portion of the company earnings to investors on a regular basis and they can a great choice for investors looking for regular income. As an investment or trading strategy, high dividend yield equities provide annual cash payments as against mostly capital gains in the price of a stock. The list in the table below represent the highest dividend paying stocks from the list of the most liquid stocks in the NSE top 30.
For more detailed analysis,
- On InfoWARE Market Data Terminal <HYIELD> <GO>
- On InfoWARE Finance Mobile App ( Android , iPhone & iPad and Windows 10) , "Research"
African Markets
| Name | LClose | Change | %Chg |
|---|---|---|---|
| BRVM Stock Exchange | 320.63 | -0.22 | -0.07 |
| Botswana Stock Exchange | 10,567.95 | 0.00 | 0.00 |
| Egyptian Exchange | 34,601.53 | -159.90 | -0.46 |
| Ghana Stock Exchange | 7,172.44 | 0.00 | 0.00 |
| Johannesburg Stock Exchange | 102,771.76 | 1,238.70 | 1.22 |
| Lusaka Stock Exchange | 24,572.20 | -31.99 | -0.13 |
| Casablanca Stock Exchange | 20,040.46 | -48.21 | -0.24 |
| Malawi Stock Exchange | 535,868.01 | -697.54 | -0.13 |
| Nigeria Stock Exchange | 139,394.75 | 416.93 | 0.30 |
| Nairobi Securities Exchange | 176.82 | -1.46 | -0.82 |
| Namibian Stock Exchange | 1,812.80 | 14.57 | 0.81 |
| Rwanda Stock Exchange | 178.88 | 0.00 | 0.00 |
| Tunis Stock Exchange | 11,925.04 | -38.28 | -0.32 |
| Uganda Securities Exchange | 1,423.29 | -18.31 | -1.27 |
Nigeria Market Indexes
| Symbol | LClose | %Chg | WTD% | MTD% | QTD% | YTD% | MktCap | Trades |
|---|---|---|---|---|---|---|---|---|
| ASI | 139,796.11 | 0.29 | 0.29 | 0.05 | 16.75 | 35.49 | 23,910 | |
| NGX30 | 5,098.64 | 0.32 | 0.32 | 0.04 | 7.94 | 33.65 | 11,972 | |
| NGXAFRBVI | 3,503.34 | 0.47 | 0.47 | 0.52 | -1.13 | 41.22 | 4,907 | |
| NGXAFRHDYI | 22,505.78 | 0.84 | 0.84 | -0.11 | 7.61 | 32.17 | 5,677 | |
| NGXASEM | 1,538.10 | 0.00 | 0.00 | 0.00 | -3.57 | -2.88 | 7 | |
| NGXBNK | 1,503.92 | 0.43 | 0.43 | -0.50 | -0.45 | 38.30 | 5,338 | |
| NGXCG | 4,012.64 | 0.36 | 0.36 | -0.55 | 16.69 | 41.83 | 11,868 | |
| NGXCNSMRGDS | 3,180.69 | 0.28 | 0.28 | -0.28 | -8.30 | 83.39 | 3,229 | |
| NGXCOMMDTY | 1,084.34 | 0.00 | 0.00 | 1.52 | 3.54 | 8.43 | ||
| NGXGROWTH | 12,002.26 | 7.01 | 7.01 | 7.16 | 26.21 | 54.61 | 220 | |
| NGXINDUSTR | 4,913.16 | 0.85 | 0.85 | -0.39 | 39.46 | 37.56 | 1,847 | |
| NGXINS | 1,332.33 | 0.98 | 0.98 | 3.85 | 80.39 | 69.47 | 2,377 | |
| NGXLOTUSISLM | 11,413.67 | 0.63 | 0.63 | -0.05 | 19.21 | 63.81 | 4,121 | |
| NGXMAINBOARD | 6,802.23 | 0.19 | 0.19 | 0.22 | 15.31 | 35.94 | 17,830 | |
| NGXMERIGRW | 9,979.97 | 0.70 | 0.70 | -0.34 | 3.40 | 52.99 | 3,361 | |
| NGXMERIVAL | 13,374.97 | 0.45 | 0.45 | 0.04 | 11.95 | 28.23 | 6,143 | |
| NGXOILGAS | 2,362.05 | -0.05 | -0.05 | -0.36 | -1.26 | -12.88 | 359 | |
| NGXPENBRD | 2,591.04 | 0.20 | 0.20 | 0.03 | 12.69 | 41.46 | 18,838 | |
| NGXPENSION | 6,601.59 | 0.28 | 0.28 | -0.28 | 3.89 | 45.60 | 13,758 | |
| NGXPREMIUM | 13,722.94 | 0.47 | 0.47 | -0.29 | 19.64 | 40.99 | 5,860 | |
| NGXSOVBND | 655.08 | 0.00 | 0.00 | -0.58 | 0.24 | 8.90 | 0 |
For more detailed analysis,
- On InfoWARE Market Data Terminal <MKTINS> <GO>
- On InfoWARE Finance Mobile App ( Android, iPhone & iPad and Windows 10) , "Market Indexes"
Find the topic interesting? Will like to comment? Contact Us at solutions@infowarelimited.com
Top News

Chart Of The Day - ASI Chart Vs ASI Advance Decline Line (YTD) (09-Sep-2025 15:07:15.662)
InfoWARE AI Analyst Daily Market Report: 09-Sep-2025

[XNSA]>> DAILY FUND PRICE SUBMISSION - FCMB ASSET MANAGEMENT LIMITED
[MERGROWTH]>> DAILY INDICATIVE PRICES
[XNSA]>> CORDROS MILESTONE FUNDS' BID & OFFER PRICES
[VSPBONDETF]>> DAILY INDICATIVE PRICES
[XNSA]>> NOTIFICATION OF LIFTING OF SUSPENSION
[XNSA]>> NGX FIXED INCOME INDICATIVE PRICE LIST FOR SEP 09, 2025
[XNSA]>> CLOSING GONG CEREMONY AND FACTS BEHIND THE FIGURES BY DANGOTE CEMENT
[XNSA]>> REGISTRATION FOR BATCH TWO- 2025 DEALING CLERKSHIP CERTIFICATION PROGRA
[SIAMLETF40]>> DAILY INDICATIVE PRICES
[XNSA]>> UPDATED- SAVE THE DATE: 29TH ANNUAL STOCKBROKERS CONFERENCE
[XNSA]>> CLOSING GONG CEREMONY IN HONOUR OF ISSB DELEGATION
Chart Of The Day - ASI Chart Vs ASI Advance Decline Line (YTD) (08-Sep-2025 15:08:59.751)
InfoWARE AI Analyst Daily Market Report: 08-Sep-2025
[MERVALUE]>> DAILY INDICATIVE PRICES
[XNSA]>> EMERGING AFRICA DAILY FUND PRICES
[VSPBONDETF]>> DAILY INDICATIVE PRICES
[XNSA]>> DAILY FUND PRICE SUBMISSION - FCMB ASSET MANAGEMENT LIMITED
[XNSA]>> EXTENSION IN TRADING OF UBA PLC'S RIGHTS ISSUE
[XNSA]>> NGX FIXED INCOME INDICATIVE PRICE LIST FOR SEP 08, 2025
[XNSA]>> CLOSING GONG CEREMONY AND FACTS BEHIND THE FIGURES BY DANGOTE CEMENT
[XNSA]>> REGISTRATION FOR BATCH TWO- 2025 DEALING CLERKSHIP CERTIFICATION PROGRA
[XNSA]>> UPDATED- SAVE THE DATE: 29TH ANNUAL STOCKBROKERS CONFERENCE
[XNSA]>> CLOSING GONG CEREMONY IN HONOUR OF ISSB DELEGATION
[XNSA]>> RECLASSIFICATION OF RED STAR EXPRESS PLC
[XNSA]>> RECLASSIFICATION OF BETA GLASS PLC
[XNSA]>> NOTIFICATION OF PRICE ADJUSTMENT
InfoWARE AI Analyst Daily Market Report: 04-Sep-2025
Chart Of The Day - ASI Chart Vs ASI Advance Decline Line (YTD) (04-Sep-2025 15:08:19.781)
Get IDIA - the stock trading app for the modern investor
Solutions by Business
Product Suites
Company
Contacts
- 8th Floor,
- South Atlantic Petroleum Towers,
- 1 Adeola Odeku Street,
- Victoria Island,
- Lagos, Nigeria.
- Email: solutions@infowarelimited.com
Follow Us
 |
 |
 |
 |