


InfoWARE AI Analyst Daily Market Report: 08-Sep-2025 | InfoWARE Finance
Get IDIA - the stock trading app for the modern investor


InfoWARE AI Analyst Daily Market Report: 08-Sep-2025
(Source: InfoWARE Terminal, Date: 08-Sep-2025)
Dear Investor,
NGX Daily Market Summary – Monday, Sept 8, 2025
The NGX All Share Index (ASI) climbed 0.30% today, closing at 138,980.01. Year-to-date, the ASI boasts a robust 35.10% gain, reflecting continued investor optimism. Market breadth was solid at 1.75x as advancers (42) decisively outpaced decliners (24), with notable spikes in both value traded (16.22B Naira, +5.54%) and several high-impact volume moves. However, overall market volume dropped sharply (-49.7% from the previous session), hinting at selective participation amidst a bullish tilt. Insurance and household products led today's performance, while certain ETFs and specialty stocks faced steep declines.
Market Breadth and Key Trends
- Breadth: Market breadth of 1.75x shows a clear bullish bias with 42 gainers and 24 losers.
- Turnover: Value traded surged 5.54% despite a ~50% drop in traded volume, suggesting larger transactions and likely increased institutional involvement.
- Sector Strength: Insurance, household products, and select financials outperformed, while ETFs and select durables underperformed.
- Momentum: Several stocks experienced bullish momentum as prices closed above their 15-day averages, notably in insurance and consumer goods.
- FX: The Naira slipped 0.13% to 1,539/USD, a mild headwind for importers but a boost for exporters.
Top Gainers and Losers
| Stock | Price (₦) | %Change | RSI | MACD | Sector |
|---|---|---|---|---|---|
| PZ Cussons (PZ) | 35.20 | +10.00% | 48.4 | -2.67 | Personal/Household |
| University Press (UPL) | 5.50 | +10.00% | 47.9 | -0.47 | Publishing |
| Ellah Lakes | 14.27 | +9.94% | 50.9 | -0.23 | Agriculture |
| Legend Internet | 5.44 | +9.90% | 48.1 | -0.57 | ICT |
| NCR Nigeria | 13.95 | +9.84% | 58.0 | 0.77 | ICT |
| Stock | Price (₦) | %Change | RSI | MACD | Sector |
|---|---|---|---|---|---|
| VETIVA S&P Bond ETF | 200.00 | -24.81% | 51.2 | -26.56 | ETF/Bond |
| Greenwich Asset ETF | 256.05 | -10.00% | 49.3 | -21.85 | ETF |
| Industrial & Medical Gases | 33.30 | -10.00% | 51.7 | -1.82 | Manufacturing |
| Nigerian Enamelware | 35.10 | -10.00% | 54.9 | 1.37 | Durables |
| Thomas Wyatt | 2.70 | -10.00% | 50.2 | -0.20 | Paper/Forest |
- Both PZ Cussons (PZ) and Ellah Lakes are repeat top gainers from the YTD and 5-day lists, underlining persistent bullish momentum. PZ also features in bullish momentum signals with strong volume.
- VETIVA S&P Bond ETF (VSPBONDETF) is a standout YTD and daily loser (-24.8% today, -42.9% YTD), coinciding with a bearish signal.
Momentum Insights and Technical Patterns
-
Volume Analysis:
- High Unusual Volume: FCMB (+742% vol.), DANGSUGAR (+415% vol., +9.09%) and ETRANZACT (+743% vol., +8.85%) show heavy accumulation and strong bullish conviction, particularly as DANGSUGAR also breaks above its 15DMA.
- THOMAS WYATT stands out for negative price action on high volume (-10%, +416% vol.), marking strong institutional distribution.
- Advancing/Declining: Volume was up for 83 companies and down for 56—suggesting fresh interest in a broad swath of the market.
- Year-to-Date (YTD) Gainers: Insurance continues to shine (AIICO +137.9% YTD, Ella Lakes +374.1%) with positive RSI, confirming broad sector outperformance; but some leaders show cooling momentum (e.g., RSI near or below 51 and flattening MACD).
- Bearish Momentum: Multiple ETFs (VSPBONDETF, GREENWETF, NEWGOLD) signal notable breakdowns below 15DMA; ENAMELWA and ACADEMY also flagged as bearish after sharp declines.
- Bullish Momentum: PZ, ETRANZACT, VERITASKAP, DANGSUGAR, UNIVINSURE, and WAPIC are all trading above their 15DMA, and several are also either top daily or YTD gainers; further acceleration is possible, especially for those with RSI in the 48-53 range (not overheated).
Contrarian Signals – Hidden Insights
- ENAMELWA (Nigerian Enamelware): Shares have plummeted (-10% today, -12.25% YTD), crossed below their 15DMA, but RSI remains in neutral (54.9), indicating potential for a technical bounce—or a hidden bear trap if selling intensifies.
- PZ Cussons: Despite a strong daily surge and bullish 15DMA crossover, the MACD remains bearish (-2.67 vs. -1.55 signal). Traders should watch for a potential reversal or stall if momentum fades.
- DANGSUGAR: Strong volume and price action, but RSI at 48-51 suggests it is not yet overbought; uptrend may have legs.
- FCMB: Massive volume (8x avg.), but no significant price change. The stalling price amidst such volume may reflect major distribution or a consolidation ahead of a new move.
Sector Heatmap & Institutional/Retail Activity
| Sector | Top Performing Stock | Performance | Beta | Institutional Activity (%) | Technical Trend |
|---|---|---|---|---|---|
| Insurance | VERITASKAP | +9.60%, +112.7% YTD | 0.88 | High | Above 15DMA, robust volume |
| Consumer | PZ | +10.00%, +44.9% YTD | 0.56 | Moderate | Bullish MA/15DMA crossover, mild RSI |
| Banking | ZENITHBANK | +2.33% 5D, +43.4% YTD | 1.20 | 20.2% | Slight uptrend, RSI 50.2 |
| ETF/Bond | VSPBONDETF | -24.8%, -42.9% YTD | -3.08 | Low | Bearish, below 15DMA |
| Durables | ENAMELWA | -10.0%, -12.2% YTD | 0.43 | Minimal | Selling pressure |
Dividend-Beta Matrix: Defensive Plays
| Stock | Div. Yield | Beta | Momentum | Comment |
|---|---|---|---|---|
| PZ Cussons | 4.59% | 0.56 | Bullish | Sustained dividend/low beta; promising for defensive positioning with upside momentum |
| DANGSUGAR | 4.27% | 1.35 | Bullish | Above 15DMA with high dividend yield, but higher beta—best for aggressive dividend seekers |
| NAHCO | 6.66% | 0.65 | Neutral | Attracts yield-oriented, low-vol investors |
| NGXINS (Insurance Index) | 2.09% | 0 | Bullish | Low risk, sector-wide insurance surge |
- Implications: Stocks like PZ and NAHCO offer solid dividend yields in lower-beta environments, making them potential hedges if volatility rises.
- DANGSUGAR combines a high yield with bullish triggers, suitable for more risk-tolerant yield investors.
Institutional Clustering Alerts
- ZENITHBANK: 20.2% of total institutional trade value—watch for block trades and follow-on institutional interest. Large trade counts in ZENITHBANK, FIRSTHOLDCO, GTCO, UBA, and ACCESSCORP indicate banking remains the preferred institutional hunting ground.
- Institutional flows accounted for 78.9% of today's volume and 87.1% of value, underlining the significant market-driving power of large players.
- Retail focus: Telecoms and tier-1 banks (MTNN, UBA, ACCESSCORP, ZENITHBANK, GTCO) continue to dominate retail activity.
Monday Special: Last Week's Recap
Last week’s trading closed on a strong note with the ASI sustaining gains. Notably, insurance and select small caps saw remarkable momentum, with short-term traders benefitting from rapid swings. Institutional preference continued for the banking sector, which provided liquidity and stability, while high volatility persisted in ETFs and select debt instruments. Signs of sector rotation began to emerge, with investors shifting attention to undervalued or lagging sectors.
Retail vs Institutional Activity Comparison
- Institutional investors represented 78.87% of volume, trading 87.08% of value, yet participated in just 38.63% of trade counts—indicating much larger average deal sizes and likely strategic positioning.
- Retail investors dominated the number of trades (61.37%) but contributed much less to overall volume and value, suggesting more speculative, short-term trades.
- Top 5 Institutional Trades: ZENITHBANK, FIRSTHOLDCO, GTCO, UBA, ACCESSCORP—all banking majors, hinting at continued institutional faith in the sector's resilience.
- Top 5 Retail Trades: MTNN, UBA, ACCESSCORP, ZENITHBANK, GTCO—a heavy bias to liquid, blue-chip banking and telecom stocks where retail investors can maneuver quickly.
- Insight: Both institutional and retail flows favor high-liquidity, low-spread stocks, but the size and intent differ—institutions are likely consolidating or rotating positions, while retail is chasing volatility and momentum.
Suggestions & Actionable Ideas for Traders/Investors
- Bullish plays: Ride strength in insurance and consumer goods, notably PZ, VERITASKAP, DANGSUGAR, and AIICO as they show solid technicals and, mostly, non-overbought RSI readings.
- Defensive stocks: Consider NAHCO and PZ for yield with low beta if macro risks rise.
- Monitor for reversals/overextension: DANGSUGAR and ETRANZACT could see cooling if volumes dwindle; beware of distribution after blow-off moves.
- ETF caution: The persistent selloff in VSPBONDETF and GREENWETF highlights risk in passive strategies—avoid or consider only for tactical mean-reversion plays with tight stops.
- Contrarian watchlist: ENAMELWA’s technical setup (sharp loss, neutral RSI) signals a possible bounce for nimble "catch-the-knife" traders.
- Yield hunters: DANGSUGAR offers both income and momentum; balance allocation given its beta (risk).
TUESDAY/YTD Gainers & Losers Table (Special for Early Week)
| Name | Symbol | YTD %Chg | 5D %Chg | Daily %Chg | RSI | Sector |
|---|---|---|---|---|---|---|
| ELLAH LAKES PLC. | ELLAHLAKES | +374.09% | +20.93% | +9.94% | 50.93 | Agriculture |
| AIICO INSURANCE PLC. | AIICO | +143.95% | +20.44% | +9.74% | 51.02 | Insurance |
| VERITAS KAPITAL ASSURANCE | VERITASKAP | +112.75% | +20.56% | +9.60% | 52.06 | Insurance |
| ROYAL EXCHANGE PLC. | ROYALEX | +87.27% | +20.47% | +9.57% | 49.63 | Insurance |
| CORNERSTONE INSURANCE | CORNERST | +89.39% | +14.50% | +4.46% | 53.90 | Insurance |
| Name | Symbol | YTD %Chg | 5D %Chg | Daily %Chg | RSI | Sector |
|---|---|---|---|---|---|---|
| VETIVA S&P BOND ETF | VSPBONDETF | -42.86% | -28.29% | -24.81% | 51.2 | ETF/Bond |
| GREENWICH ASSET ETF | GREENWETF | -52.05% | -10.00% | -10.00% | 49.32 | ETF |
| NIGERIAN ENAMELWARE | ENAMELWA | -12.25% | -10.00% | -10.00% | 54.9 | Household Durables |
| IND.& MED. GASES NIG | IMG | -12.25% | -10.00% | -10.00% | 51.67 | Manufacturing |
| THOMAS WYATT | THOMASWY | -10.00% | -10.00% | -10.00% | 50.21 | Paper/Forest Products |
Hidden Insights: The NGX remains buoyant with selective sector surges and high dividend/low beta stocks providing ballast. Watch institutional clustering for confirmation of trend sustainability, and beware of sharp ETF volatility. Traders can seek rotation plays in lagging but technically neutral stocks, and momentum-chasers should stay alert for any signs of reversal where volume and price diverge.
|
Top ASI Gainers Over Last 5 Trading Days
|
Top ASI Losers Over Last 5 Trading Days
|
For more detailed analysis, on InfoWARE Market Data Terminal <NSEPERF> <GO>
On InfoWARE Finance Mobile App (Android, iPhone & iPad, Windows Phone and Windows 8/10), "Top Gainers & Losers"
P Z CUSSONS NIGERIA PLC. (PZ) topped the advancers list closing at N35.20 with a gain of 10.00% followed by UNIVERSITY PRESS PLC. (UPL) which closed at N5.50 with a gain of 10.00%.
On the flip side VETIVA S & P NIGERIA SOVEREIGN BOND ETF (VSPBONDETF) and UNION DICON SALT PLC. (UNIONDICON) topped the decliners log with a loss of -24.81% at a close of N200.00, and -10.00% to close the day at N10.80 respectively.
| Symbol | LClose | %Chg |
|---|---|---|
| PZ | 35.20 | 10.00 |
| UPL | 5.50 | 10.00 |
| ELLAHLAKES | 14.27 | 9.94 |
| LEGENDINT | 5.44 | 9.90 |
| NCR | 13.95 | 9.84 |
| Symbol | LClose | %Chg |
|---|---|---|
| VSPBONDETF | 200.00 | -24.81 |
| UNIONDICON | 10.80 | -10.00 |
| THOMASWY | 2.70 | -10.00 |
| ENAMELWA | 35.10 | -10.00 |
| GREENWETF | 256.05 | -10.00 |
For more detailed analysis,
- On InfoWARE Market Data Terminal <TOPG> <GO>
- On InfoWARE Finance Mobile App ( Android, iPhone & iPad and Windows 10) , "Top Gainers & Losers"
Currency Market
In the currency market, the Naira fell 0.13%(-1.98) against the Dollar to settle at 1 to 1Investment Insights - Top 5 Gainers YTD
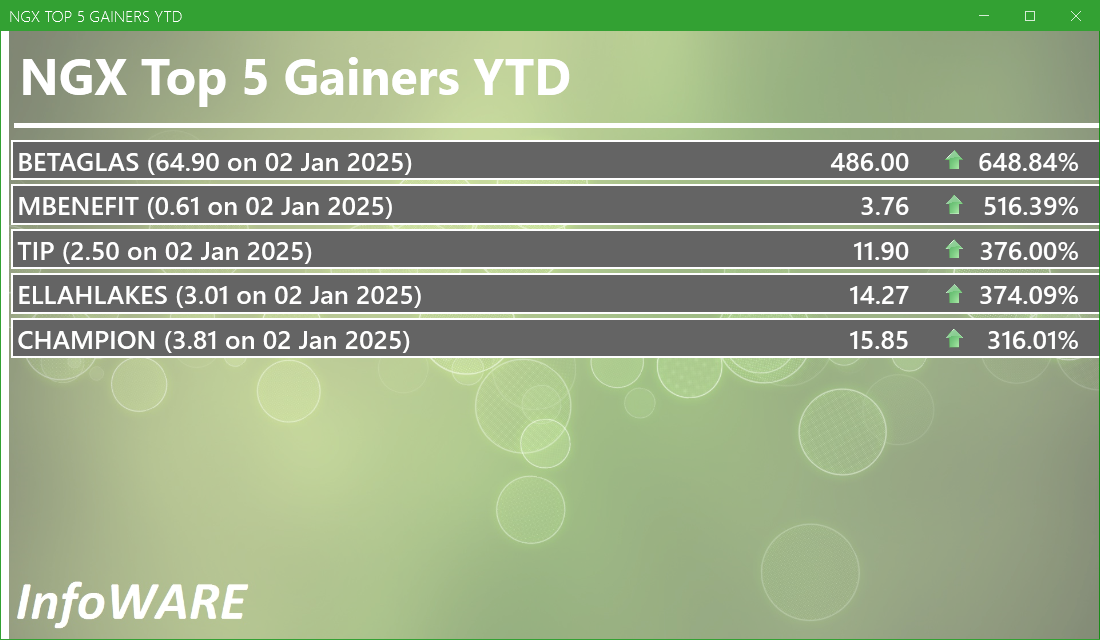
These stocks are the best performers whose price has risen faster than the market as a whole with the best returns year to date. Momentum investors believe that stocks that have outperformed the market will often continue to do so because the factors that caused them to outperform will not suddenly disappear. In addition, other investors seeking to benefit from the stock’s outperformance will often purchase the stock, further bidding its price higher and pushing the stock higher still
For more detailed analysis,
- On InfoWARE Market Data Terminal <T5YTD2> <GO>
- On InfoWARE Finance Mobile App ( Android , iPhone & iPad and Windows 10) , "Research"
NSE: Bull Signal - Price crossed above 15 Day MA
This signal implies these stocks are under buying pressure and the price might continue to rise and therefore positions should be monitored closely. Further suggested analysis include looking at the overall market (ASI) to see if the uptrend is market wide, sector wide or specific to the stock. Portfolio managers tend to use this as a signal to do more research to add to their positions or lock in some profits. Typically further analysis should be done using commands like PC and RV on the InfoWARE Market Data Terminal. Another command is ALERTS to set price triggers for possible exit or entry as necessary
For more detailed analysis,
- On InfoWARE Market Data Terminal <NSEPERF> <GO>
- On InfoWARE Finance Mobile App ( Android , iPhone & iPad and Windows 10) , "Top Gainers & Losers"
| Symbol | Price | %Chg | 15DMA | PE | EPS | DivY | MktCap | Vol | Trades | Value | LstTradeTime |
|---|---|---|---|---|---|---|---|---|---|---|---|
| PZ | 35.20 | 9.09 | 35.06 | 44.17 | 0.50 | 4.59 | 139.76B | 6.53M | 354.00 | 229.62M | 08-Sep-2025 14:30:10.400 |
| ETRANZACT | 11.30 | 8.85 | 10.80 | 171.51 | 0.04 | 1.48 | 103.96B | 3.84M | 40.00 | 43.29M | 08-Sep-2025 14:30:09.567 |
| VERITASKAP | 2.17 | 8.76 | 2.05 | 48.77 | 0.02 | 4.17 | 30.09B | 13.07M | 276.00 | 28.10M | 08-Sep-2025 14:30:10.863 |
| DANGSUGAR | 60.00 | 8.33 | 58.87 | 11.48 | 3.06 | 4.27 | 728.81B | 23.59M | 1,118.00 | 1.41B | 08-Sep-2025 14:30:09.397 |
| UNIVINSURE | 1.29 | 6.98 | 1.24 | 0.00 | 0.00 | 0.00 | 20.64B | 42.22M | 318.00 | 53.39M | 08-Sep-2025 14:30:26.697 |
| NPFMCRFBK | 3.20 | 6.25 | 3.10 | 5.63 | 0.27 | 8.00 | 19.18B | 3.33M | 78.00 | 10.42M | 08-Sep-2025 14:30:10.270 |
| WAPIC | 3.60 | 4.17 | 3.45 | 72.55 | 0.02 | 2.56 | 86.37B | 5.42M | 133.00 | 18.83M | 08-Sep-2025 14:30:26.703 |
| NGXINS | 1,319.46 | 3.07 | 1,298.81 | 10.41 | 2.09 | 0.00 | 0.00 | 115.12M | 2,829.00 | 323.89M | 08-Sep-2025 14:30:17.313 |
| FGSUK2033S6 | 101.59 | 2.55 | 99.71 | 0.00 | 0.00 | 1.00 | 1.00 | 1.02K | 08-Sep-2025 14:30:30.247 | ||
| CWG | 16.45 | 2.13 | 16.27 | 0.00 | 0.00 | 2.46 | 41.53B | 1.68M | 190.00 | 27.40M | 08-Sep-2025 14:30:09.357 |
| NAHCO | 105.00 | 1.86 | 103.57 | 92.98 | 0.41 | 6.66 | 204.65B | 655.37K | 181.00 | 68.50M | 08-Sep-2025 14:30:10.150 |
| NGXCOMMDTY | 1,084.34 | 1.57 | 1,069.31 | 0.00 | 0.00 | 08-Sep-2025 14:30:17.267 | |||||
| FGS202894 | 99.44 | 0.00 | 99.44 | 0.00 | 0.00 | 0.00 | 0.00 | 0.00 | 08-Sep-2025 14:30:13.660 |
NSE: BEAR Signal - Price crossed below 15 Day MA
This signal implies these stocks are under selling pressure and the price might continue to slide and therefore positions should be monitored closely. Further suggested analysis include looking at the overall market (ASI) to see if the downtrend is market wide, sector wide or specific to the stock. If the overal market trend is upwards, then since these stocks are heading in the opposite direction, then further analysis should be done using commands like PC and RV on the InfoWARE Market Data Terminal. Another command is ALERTS to set price triggers for possible exit is necessar
For more detailed analysis,
- On InfoWARE Market Data Terminal <BEARM> <GO>
- On InfoWARE Finance Mobile App ( Android , iPhone & iPad and Windows 10)
| Symbol | Price | %Chg | 15DMA | PE | EPS | DivY | MktCap | Vol | Trades | Value | LstTradeTime |
|---|---|---|---|---|---|---|---|---|---|---|---|
| EUNISELL | 25.45 | 0.00 | 25.46 | 0.00 | 0.00 | 0.31 | 6.02B | 19.81K | 12.00 | 475.35K | 08-Sep-2025 14:30:09.590 |
| STANBICETF30 | 420.00 | -3.57 | 423.23 | 0.00 | 0.00 | 2.38K | 16.00 | 1.00M | 08-Sep-2025 14:30:26.977 | ||
| FGS202760 | 95.00 | -5.26 | 98.80 | 0.00 | 0.00 | 5.00 | 1.00 | 4.75K | 08-Sep-2025 14:30:13.443 | ||
| NEWGOLD | 51,201.00 | -6.05 | 53,407.67 | 0.00 | 0.00 | 0.00 | 0.00 | 16.00 | 2.00 | 823.22K | 08-Sep-2025 14:30:26.953 |
| TRANSCORP | 46.05 | -7.93 | 47.62 | 0.00 | 0.00 | 0.23 | 1,871.84B | 1.43M | 302.00 | 66.99M | 08-Sep-2025 14:30:10.677 |
| FGS202762 | 90.00 | -11.00 | 97.84 | 0.00 | 0.00 | 20.00 | 1.00 | 18.00K | 08-Sep-2025 14:30:13.450 | ||
| ACADEMY | 8.60 | -11.05 | 9.11 | 0.00 | 0.00 | 3.51 | 6.50B | 600.68K | 96.00 | 5.24M | 08-Sep-2025 14:30:08.780 |
| ENAMELWA | 35.10 | -11.11 | 38.11 | 27.14 | 0.71 | 2.33 | 2.67B | 253.90K | 15.00 | 8.92M | 08-Sep-2025 14:30:09.497 |
| UNIONDICON | 10.80 | -11.11 | 11.46 | 0.00 | 0.00 | 6.25 | 2.95B | 626.67K | 35.00 | 6.79M | 08-Sep-2025 14:30:10.777 |
| VSPBONDETF | 200.00 | -33.00 | 238.43 | 0.00 | 0.00 | 565.00 | 8.00 | 123.82K | 08-Sep-2025 14:30:27.033 |
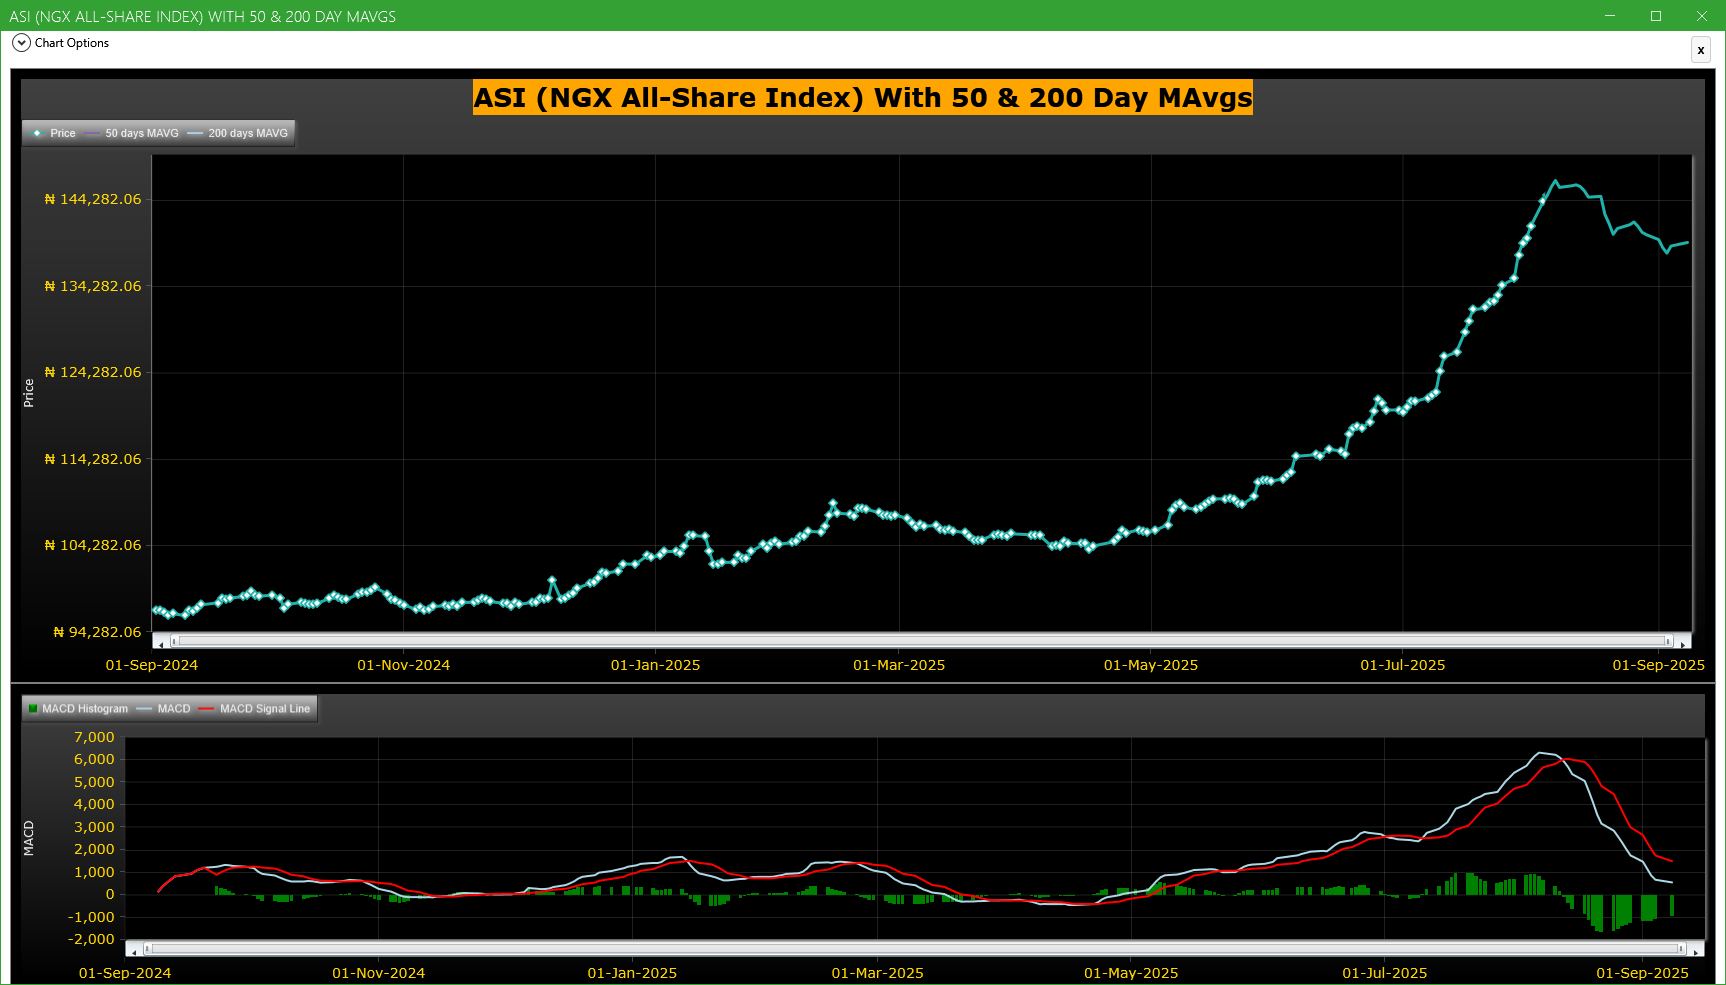
Market Trend - ASI (NGX All-Share-Index) With 50 & 200 Day MAvgs Chart
Technical traders typically use the 50 & 200 day moving averages to aid in choosing
where to enter or exit a position, which then causes these levels to act as strong
support or resistance. As a general guideline, if the price is above a moving average,
the trend is up. If the price is below a moving average, the trend is down.
It is important to note that critics of technical analysis say that moving averages act
as support and resistance because so many traders use these indicators to inform their
trading decisions. Also moving averages tend to work quite well in strong trending conditions
but poorly in choppy or ranging conditions.
Trading Strategies: Crossovers
Crossovers are one of the main moving average strategies. The first type is a price crossover,
which is when the price crosses above or below a moving average to signal a potential change
in trend. Another strategy is to apply two moving averages to a chart: one longer and one
shorter. When the shorter-term MA crosses above the longer-term MA, it is a buy signal, as
it indicates that the trend is shifting up. This is known as a golden cross. Meanwhile, when
the shorter-term MA crosses below the longer-term MA, it is a sell signal, as it indicates that
the trend is shifting down. This is known as a dead/death cross
For more detailed analysis,
- On InfoWARE Market Data Terminal <CI> <GO>
- On InfoWARE Finance Mobile App ( Android , iPhone & iPad and Windows 10) , "Research"
Unusual Volume: Volume traded is more than double the 90 day moving average (All exchanges; ASI & ASem). For more detailed analysis,
- On InfoWARE Market Data Terminal <UV> <GO>
- On InfoWARE Finance Mobile App ( Android , iPhone & iPad and Windows 10)
| Symbol | Name | Volume | 90DAvgVol | %VolChg | Price | LClose | %Chg | Trades | Value |
|---|---|---|---|---|---|---|---|---|---|
| FCMB | FCMB GROUP PLC. | 460.95M | 54.74M | 742.07 | 10.50 | 10.50 | 0.00 | 679 | 4.74B |
| DANGSUGAR | DANGOTE SUGAR REFINERY PLC | 23.59M | 4.58M | 415.28 | 60.00 | 55.00 | 9.09 | 1,118 | 1.41B |
| NGXGROUP | NIGERIAN EXCHANGE GROUP | 7.51M | 2.61M | 187.82 | 60.00 | 60.00 | 0.00 | 217 | 445.15M |
| THOMASWY | THOMAS WYATT NIG. PLC. | 5.07M | 981.87K | 415.96 | 2.70 | 3.00 | -10.00 | 49 | 13.68M |
| ETRANZACT | E-TRANZACT INTERNATIONAL PLC | 3.84M | 454.58K | 743.80 | 11.30 | 10.30 | 9.71 | 40 | 43.29M |
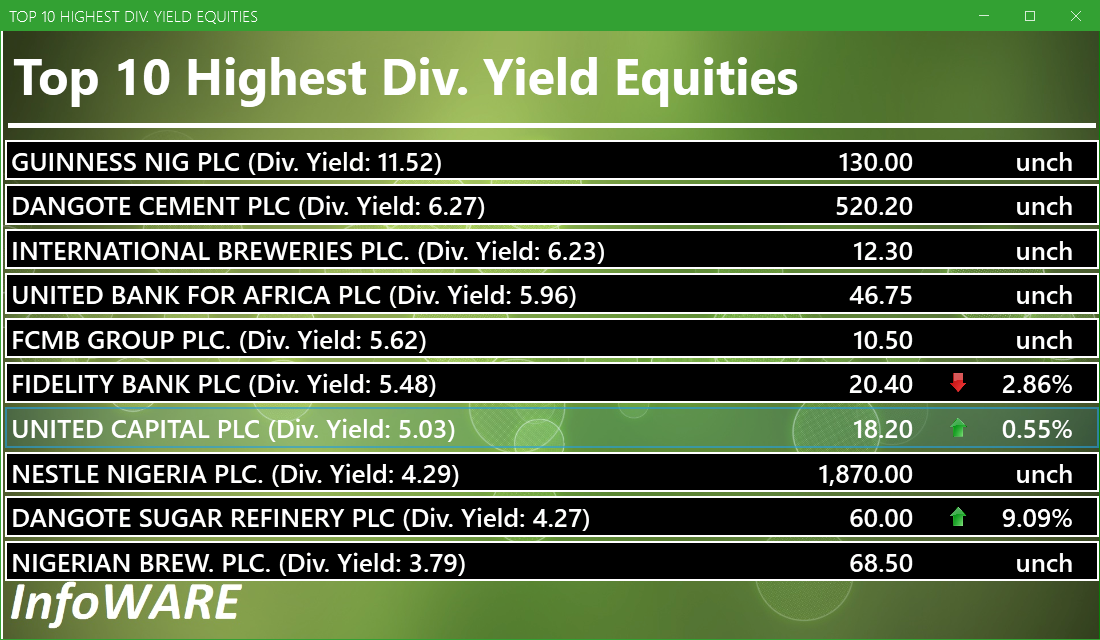
Investment Insights - High Div. Stocks
Dividend stocks distribute a portion of the company earnings to investors on a regular basis and they can a great choice for investors looking for regular income. As an investment or trading strategy, high dividend yield equities provide annual cash payments as against mostly capital gains in the price of a stock. The list in the table below represent the highest dividend paying stocks from the list of the most liquid stocks in the NSE top 30.
For more detailed analysis,
- On InfoWARE Market Data Terminal <HYIELD> <GO>
- On InfoWARE Finance Mobile App ( Android , iPhone & iPad and Windows 10) , "Research"
Investment Insights - Stocks outperforming the ASI but with approximately the same risk
These list of stocks represent equities that are less risky than the ASI but doing better than the ASI (All Shares Index) using the YTD (Year to Date) returns as the measure. The risk is measured by Beta. Beta is an assessment of a stock's tendency to undergo price changes, (its volatility), as well as its potential returns compared to the ASI. It is expressed as a ratio, where a score of 1 represents performance comparable to the ASI, and returns above or below the market may receive scores greater or lower than 1.
For a full list of both positively and negatively corelated stocks visit InfoWARE Market Data Terminal
- On InfoWARE Market Data Terminal <BANL> <GO>
- On InfoWARE Finance Mobile App ( Android , iPhone & iPad and Windows 10)
| Symbol | DivYield | PE | EPS | Beta | %ChgYTD | ASIYTDReturn | BetaDiff |
|---|---|---|---|---|---|---|---|
| HONYFLOUR | 1.40 | 16.28 | 0.31 | 0.99 | 232.37 | 35.10 | 0.01 |
| CAVERTON | 5.52 | 1.15 | 1.57 | 0.98 | 158.82 | 35.10 | 0.02 |
| ROYALEX | 7.81 | 0.00 | 0.00 | 0.96 | 87.27 | 35.10 | 0.04 |
| CORNERST | 5.28 | 8.62 | 0.35 | 0.93 | 89.39 | 35.10 | 0.07 |
| DEAPCAP | 13.76 | 188.84 | 0.01 | 0.89 | 40.00 | 35.10 | 0.11 |
| VERITASKAP | 4.17 | 48.77 | 0.02 | 0.88 | 45.64 | 35.10 | 0.12 |
| UNIVINSURE | 0.00 | 0.00 | 0.00 | 0.83 | 79.17 | 35.10 | 0.17 |
| FTNCOCOA | 1.60 | 0.00 | 0.00 | 0.79 | 217.02 | 35.10 | 0.21 |
| NB | 3.79 | 16.95 | 1.60 | 0.79 | 114.06 | 35.10 | 0.21 |
| MAYBAKER | 3.75 | 58.94 | 0.14 | 0.78 | 92.02 | 35.10 | 0.22 |
African Markets
| Name | LClose | Change | %Chg |
|---|---|---|---|
| BRVM Stock Exchange | 320.85 | 0.67 | 0.21 |
| Botswana Stock Exchange | 10,567.95 | 0.00 | 0.00 |
| Egyptian Exchange | 34,761.97 | -393.74 | -1.12 |
| Ghana Stock Exchange | 7,172.44 | -149.36 | -2.04 |
| Lusaka Stock Exchange | 24,603.00 | 73.59 | 0.30 |
| Malawi Stock Exchange | 536,567.19 | 2,350.55 | 0.44 |
| Nairobi Securities Exchange | 178.28 | 0.20 | 0.11 |
| Rwanda Stock Exchange | 178.88 | 0.00 | 0.00 |
| Uganda Securities Exchange | 1,441.54 | 5.89 | 0.41 |
Nigeria Market Indexes
| Symbol | LClose | %Chg | WTD% | MTD% | QTD% | YTD% | MktCap | Trades |
|---|---|---|---|---|---|---|---|---|
| ASI | 139,394.75 | 0.30 | 0.00 | -0.23 | 16.41 | 35.10 | 34,086 | |
| NGX30 | 5,082.13 | 0.11 | 0.00 | -0.29 | 7.59 | 33.22 | 18,857 | |
| NGXAFRBVI | 3,486.98 | 0.23 | 0.00 | 0.05 | -1.60 | 40.56 | 7,817 | |
| NGXAFRHDYI | 22,319.39 | 0.24 | 0.00 | -0.94 | 6.72 | 31.08 | 8,983 | |
| NGXASEM | 1,538.10 | 0.00 | 0.00 | 0.00 | -3.57 | -2.88 | 11 | |
| NGXBNK | 1,497.46 | -0.53 | 0.00 | -0.93 | -0.88 | 37.71 | 8,381 | |
| NGXCG | 3,998.15 | -0.31 | 0.00 | -0.91 | 16.27 | 41.32 | 18,393 | |
| NGXCNSMRGDS | 3,171.72 | 0.60 | 0.00 | -0.56 | -8.56 | 82.88 | 4,642 | |
| NGXCOMMDTY | 1,084.34 | 1.60 | 0.00 | 1.52 | 3.54 | 8.43 | ||
| NGXGROWTH | 11,216.52 | 0.00 | 0.00 | 0.15 | 17.95 | 44.49 | 232 | |
| NGXINDUSTR | 4,871.83 | 0.02 | 0.00 | -1.23 | 38.29 | 36.40 | 2,835 | |
| NGXINS | 1,319.46 | 3.16 | 0.00 | 2.85 | 78.64 | 67.83 | 2,829 | |
| NGXLOTUSISLM | 11,342.71 | 0.49 | 0.00 | -0.67 | 18.47 | 62.79 | 6,231 | |
| NGXMAINBOARD | 6,789.20 | 0.54 | 0.00 | 0.03 | 15.09 | 35.68 | 24,581 | |
| NGXMERIGRW | 9,910.59 | 0.69 | 0.00 | -1.04 | 2.68 | 51.93 | 4,591 | |
| NGXMERIVAL | 13,315.22 | 0.45 | 0.00 | -0.41 | 11.45 | 27.66 | 9,675 | |
| NGXOILGAS | 2,363.19 | 0.00 | 0.00 | -0.32 | -1.21 | -12.83 | 575 | |
| NGXPENBRD | 2,585.76 | 0.28 | 0.00 | -0.17 | 12.46 | 41.17 | 27,839 | |
| NGXPENSION | 6,583.04 | -0.25 | 0.00 | -0.56 | 3.59 | 45.19 | 21,220 | |
| NGXPREMIUM | 13,659.18 | -0.17 | 0.00 | -0.75 | 19.09 | 40.34 | 9,273 | |
| NGXSOVBND | 655.08 | 0.00 | 0.00 | -0.58 | 0.24 | 8.90 | 0 |
For more detailed analysis,
- On InfoWARE Market Data Terminal <MKTINS> <GO>
- On InfoWARE Finance Mobile App ( Android, iPhone & iPad and Windows 10) , "Market Indexes"
Find the topic interesting? Will like to comment? Contact Us at solutions@infowarelimited.com
Top News

Chart Of The Day - ASI Chart Vs ASI Advance Decline Line (YTD) (08-Sep-2025 15:08:59.751)
InfoWARE AI Analyst Daily Market Report: 08-Sep-2025

[MERVALUE]>> DAILY INDICATIVE PRICES
[XNSA]>> EMERGING AFRICA DAILY FUND PRICES
[VSPBONDETF]>> DAILY INDICATIVE PRICES
[XNSA]>> DAILY FUND PRICE SUBMISSION - FCMB ASSET MANAGEMENT LIMITED
[XNSA]>> EXTENSION IN TRADING OF UBA PLC'S RIGHTS ISSUE
[XNSA]>> NGX FIXED INCOME INDICATIVE PRICE LIST FOR SEP 08, 2025
[XNSA]>> CLOSING GONG CEREMONY AND FACTS BEHIND THE FIGURES BY DANGOTE CEMENT
[XNSA]>> REGISTRATION FOR BATCH TWO- 2025 DEALING CLERKSHIP CERTIFICATION PROGRA
[XNSA]>> UPDATED- SAVE THE DATE: 29TH ANNUAL STOCKBROKERS CONFERENCE
[XNSA]>> CLOSING GONG CEREMONY IN HONOUR OF ISSB DELEGATION
[XNSA]>> RECLASSIFICATION OF RED STAR EXPRESS PLC
[XNSA]>> RECLASSIFICATION OF BETA GLASS PLC
[XNSA]>> NOTIFICATION OF PRICE ADJUSTMENT
InfoWARE AI Analyst Daily Market Report: 04-Sep-2025
Chart Of The Day - ASI Chart Vs ASI Advance Decline Line (YTD) (04-Sep-2025 15:08:19.781)
InfoWARE AI Analyst Daily Market Report: 04-Sep-2025
[MERGROWTH]>> DAILY INDICATIVE PRICES
[XNSA]>> DAILY FUND PRICE SUBMISSION - FCMB ASSET MANAGEMENT LIMITED
[XNSA]>> NGX FIXED INCOME INDICATIVE PRICE LIST FOR SEP 04, 2025
[VETBANK]>> DAILY INDICATIVE PRICES
RESIGNATION OF DIRECTORS (STANDARD CAPITAL AND ASSET MANAGEMENT LIMITED)
[XNSA]>> PUBLIC HOLIDAY
[XNSA]>> CORDROS MILESTONE FUNDS' BID & OFFER PRICES
[XNSA]>> CLOSING GONG CEREMONY AND FACTS BEHIND THE FIGURES BY DANGOTE CEMENT
[XNSA]>> REGISTRATION FOR BATCH TWO- 2025 DEALING CLERKSHIP CERTIFICATION PROGRA
[XNSA]>> UPDATED- SAVE THE DATE: 29TH ANNUAL STOCKBROKERS CONFERENCE
[XNSA]>> FGN SAVINGS BOND OFFER SEPTEMBER 2025
Chart Of The Day - ASI Chart Vs ASI Advance Decline Line (YTD) (03-Sep-2025 15:07:49.802)
Get IDIA - the stock trading app for the modern investor
Solutions by Business
Product Suites
Company
Contacts
- 8th Floor,
- South Atlantic Petroleum Towers,
- 1 Adeola Odeku Street,
- Victoria Island,
- Lagos, Nigeria.
- Email: solutions@infowarelimited.com
Follow Us
 |
 |
 |
 |