


InfoWARE AI Analyst Daily Market Report: 15-Sep-2025 | InfoWARE Finance
Get IDIA - the stock trading app for the modern investor


InfoWARE AI Analyst Daily Market Report: 15-Sep-2025
(Source: InfoWARE Terminal, Date: 15-Sep-2025)
Dear Investor,
NGX Market Pulse – Monday, September 15, 2025
The Nigerian equities market kicked off the week with a +0.79% rise on the All Share Index (ASI), reaching 140,545.69. Year-to-date (YTD) returns are now an impressive +37.29%. Turnover was particularly striking, surging +226.9% to ₦23.09 billion, with trading volume up to 536.60M shares. Market breadth leaned positive (1.16x), with 36 advancers outpacing 31 decliners. Retail investors drove 63% of trade counts but institutional investors dominated volume (60%) and accounted for 92% of trade value. Today's leaders—MERVALUE (+10%) and ETRANZACT (+9.7%)—highlight the rising interest in ETFs and fintech, respectively. Meanwhile, profit-taking was evident on recent winners (LIVINGTRUST, MCNICHOLS, UACN). Notably, several top gainers and volumes suggest persistent risk appetite for mid- and small-cap names.
- Market Breadth: Advancers (36) outnumbered decliners (31) for a breadth of 1.16x—a subtle but resilient bullish undertone.
- Volume Surge: +34.4% daily volume jump (to 536.60M) signals increased investor participation, especially in ETF and insurance names.
- Volume up for 85 stocks, down for 54—underlining a broad-base market rally.
Top 5 Gainers:
- MERVALUE (ETF): +10.00% to ₦220.00 – ETF demand surges with steady technicals (RSI: 51.3).
- LIVINGTRUST: +9.96% to ₦5.08 – Rebound but high volatility, yet still up YTD. RSI stable.
- ETRANZACT: +9.70% to ₦16.40 – Standout YTD outperformer (+152% YTD), continued price chase as RSI rises (62.7).
- REGALINS: +9.64% to ₦1.82 – Insurance play with volume spike and growing momentum (RSI: 58.4).
- NNFM: +8.62% to ₦93.90 – Solid breakout above moving averages, defensive food sector tilt.
Top 5 Losers:
- MCNICHOLS: -9.90% to ₦3.55 – Sharp fall; loss of bullish momentum, with RSI still above 50 (no oversold signal yet).
- HONYFLOUR: -9.13% to ₦20.90 – Downtrend accelerates; breached 15DMA; caution warranted.
- UACN: -8.01% to ₦67.15 – Plagued by heavy sell-off (vol >17x average) and negative momentum—they are also a YTD laggard.
- OMATEK: -7.58% to ₦1.22 – Small cap vulnerability, barely holding 15DMA.
- CHAMPION: -6.00% to ₦15.98 – Despite positive MACD and RSI above 50, the price downtrend persists; classic mixed-signal story.
Key Analyst Insights
- Turnover Surge: The +227% leap in turnover is a bullish sign; increased institutional flows (91.8% of value) suggest smart money re-engagement in selected large caps and sector ETFs.
- Advance/Decline Pattern: Advancers buoyed by mid/small caps, but caution: many top gainers also appear as high-volume or recently volatile, hinting at speculative flows.
-
Unusual Volume Actions:
- GEREGU: Traded 128x its average volume—no daily price change (flat), but major institutional rebalancing likely (42.7% of their top-5 trade value).
- UACN: 18x normal volume paired with price drop (-8.01%), classic sign of capitulation or fund rotation out of the stock.
- REGALINS, LASACO, and NSLTECH (insurance/fintech/tech): >2x volume, all show price moves in line with volume, especially REGALINS (+9.64%).
-
Bullish Momentum Standouts:
- MERVALUE, NNFM, UNILEVER, REGALINS, AFRIPRUD, VITAFOAM all broke above 15DMA, confirming near-term bullishness. None are overbought (RSI all under 70), so further upside possible without technical exhaustion.
- REGALINS and NNFM both made 2 appearances today: top gainers + unusual volume/momentum signals.
-
Bearish Momentum:
-
MCNICHOLS and HONYFLOUR—sharp daily drops combined with breaches below 15DMA; neither shows RSI below 30 (so not yet technically oversold), but their negative volume and momentum profiles merit caution.
UACN—on both YTD and daily loser tables, with volume signals and moving average breaches. Serial underperformer.
-
MCNICHOLS and HONYFLOUR—sharp daily drops combined with breaches below 15DMA; neither shows RSI below 30 (so not yet technically oversold), but their negative volume and momentum profiles merit caution.
-
Hidden Trends:
- Some high dividend yielding insurers (REGALINS and LASACO) are emerging in bullish and high volume categories, signaling a rotation into "safer” equities in uncertain macro conditions.
- ETRANZACT combines top gainer table, bullish momentum (above 15/50DMA), and high RSI (but not overbought)—a momentum trade with runway.
Contrarian Signals
- CHAMPION—Despite a recent decline (-6.0% today, -9.8% YTD), the RSI is at 52.6 (neutral), and the MACD is in 'bullish crossover' mode. Mixed signals: short-term technicals say sell, but momentum indicators hint at a possible bounce.
- MCNICHOLS—Sharp sell-off today (-9.9% and near the 5-day lowest), but RSI above 50 and positive MACD histogram. May see technical relief or sharp bounce if selling exhausts.
Sector Heatmaps
| Sector | Leaders | Trend | Institutional Activity | Technical Momentum |
| ETF | MERVALUE (+10%) | Strong Inflow | Low | Broke 15DMA, Bullish |
| Banking | GTCO, ZENITHBANK, ACCESSCORP | Stable | ZENITHBANK 20.2% of Institutional Value | Mixed: GTCO bullish; ZENITHBANK sideways |
| Insurance | REGALINS (+9.6%), MBENEFIT | Bullish swing | Low | Bullish (REGALINS above 15DMA & RSI up) |
| Food Products | NNFM (+8.6%), HONYFLOUR (-9.1%), MCNICHOLS (-9.9%) | Divergent | Modest | NNFM strong; HONYFLOUR/MCNICHOLS bearish below 15DMA |
| Diversified | UACN (-8.0%) | Heavy Sell-Off | High | Bearish Cross (Volume & Price) |
Dividend-Beta Matrix: Defensive Opportunities
| Stock | Dividend Yield | Beta | In Bullish/Bearish Table? | Commentary |
| AFRIPRUD | 1.27% | 0.64 | Bullish (above 15DMA) | Low-beta, stable, good for income-oriented defensive portfolios. |
| REGALINS | 6.52% | 0.47 | Bullish & Volume Spike | High dividend, low beta; momentum rising and attractive as a defensive-yet-upside play. |
| VITAFOAM | 7.03% | 0.47 | Bullish | Steady growth with income; outperformance potential in bull and bear phases. |
| MBENEFIT | 3.28% | 1.27 | Bullish | Higher beta but strong dividend; tactical for yield-seeking with risk appetite. |
| LASACO | 4.05% | 0.71 | High Volume, Momentum Picking Up | Rising activity; potential for dividend + capital appreciation. |
Institutional Clustering Alerts
- ZENITHBANK: 20.17% (₦1.05bn) of all institutional trade value—a clear sign of institutional confidence or defensive parking.
- GEREGU: Heavy institutional turnover (₦10.3bn) but no price movement, suggesting portfolio rebalancing or cross deals.
- ACCESSCORP & GTCO: Show up in both institutional and retail top-5 most traded stocks; liquidity magnets.
High Dividend Momentum Commentary
- REGALINS (Dividend: 6.52%) and VITAFOAM (7.03%) are not only showing bullish technicals but also offer attractive yields, bolstering the case for income-focused investors seeking growth.
- AFRIPRUD (Dividend: 1.27%) also appears in bullish tables, combining stability and income with technical momentum.
Trader Suggestions
- Momentum Trade: Consider ETRANZACT, REGALINS, NNFM, or MERVALUE for trend-following strategies given their technical breakouts and/or unusual volumes.
- Be Cautious: On UACN, MCNICHOLS, HONYFLOUR—each has negative price/volume momentum and institutional exits.
- Dividend + Defense: Build positions in high-yield, low-beta names (e.g., REGALINS, VITAFOAM, AFRIPRUD)—especially for portfolios seeking to weather volatility.
- Watch for Reversals: Mixed technicals in names like CHAMPION or MCNICHOLS mean short-term bounces possible; tight stops recommended.
- Institutional Magnetism: Track persistent flows into ZENITHBANK and GEREGU for clues on sector rotation and defensive stances.
Top Year-To-Date Gainers and Losers
| Top 3 YTD Gainers | Price | %ChgYTD | Current RSI |
| CHELLARAMS PLC | ₦13.30 | +259.46% | 59.9 |
| REGALINS | ₦1.66 | +127.50% | 58.4 |
| ETRANZACT | ₦14.95 | +152.31% | 62.7 |
| Top 3 YTD Losers | Price | %ChgYTD | Current RSI |
| LASACO ASSURANCE | ₦2.99 | -11.50% | 48.6 |
| HONEYFLOUR | ₦23.00 | -11.63% | 51.4 |
| OMATEK | ₦1.32 | -52.50% | 50.8 |
Last Week's Recap
The previous week saw a tug-of-war between value-hunting in defensive and dividend-rich names and profit booking in recent high-flyers. Mid/Small caps (notably ETRANZACT and REGALINS) attracted follow-on buying, while some large caps attracted institutional support (ZENITHBANK). Insurance and fintech themes are carrying momentum over, while diversified industry names such as UACN and MCNICHOLS show clear outflows and negative technicals.
Market Activity & Trades Breakdown
- Trade Execution: Retail investors accounted for 63% of trades, but institutional investors provided 60% of the volume and a commanding 92% of trade value—underscoring institutional price-setting power, especially in large caps (ZENITHBANK, GEREGU, GTCO).
-
Institutional Top 5 Trades:
- ZENITHBANK (4.35% of institutional trade value)
- GEREGU (42.7%)—block trade & index-watching
- ACCESSCORP, GTCO, ARADEL
- Banking sector dominates, signaling sector confidence
-
Retail Top 5 Trades:
- MTNN: largest trade count (Telecoms—steady, flat trading)
- ACCESSCORP, ZENITHBANK, UBA, GTCO – High liquidity bank stocks are retail favorites
-
Correlation Insights:
- ACCESSCORP and GTCO appear in Top 3 for both retail and institutional—these are the true liquidity hubs and should be on every active trader's radar for minimal slippage.
- Institutional clustering (ZENITHBANK, GEREGU) could be a signal to watch for breakout moves or large block-trade-driven re-ratings.
Summary & Tactical Plays
- Momentum names with discipline: ETRANZACT (Fintech, bullish signals, high RSI but room to run), REGALINS (Insurance, income + momentum + unusual volume), MERVALUE (ETF play, robust institutional appeal).
- Defensive yield with upside: VITAFOAM, AFRIPRUD, REGALINS.
- Bearish/mean reversion: UACN, MCNICHOLS—short-term traders can look for support/fade-to-bounce setups.
- Watch for institutional magnet names—if block trades persist, expect follow-on momentum—use tight stops due to high volatility.
|
Top ASI Gainers Over Last 5 Trading Days
|
Top ASI Losers Over Last 5 Trading Days
|
For more detailed analysis, on InfoWARE Market Data Terminal <NSEPERF> <GO>
On InfoWARE Finance Mobile App (Android, iPhone & iPad, Windows Phone and Windows 8/10), "Top Gainers & Losers"
MERISTEM VALUE EXCHANGE TRADED FUND (MERVALUE) topped the advancers list closing at N220.00 with a gain of 10.00% followed by LIVINGTRUST MORTGAGE BANK PLC (LIVINGTRUST) which closed at N5.08 with a gain of 9.96%.
On the flip side MCNICHOLS PLC (MCNICHOLS) and HONEYWELL FLOUR MILL PLC (HONYFLOUR) topped the decliners log with a loss of -9.90% at a close of N3.55, and -9.13% to close the day at N20.90 respectively.
| Symbol | LClose | %Chg |
|---|---|---|
| MERVALUE | 220.00 | 10.00 |
| LIVINGTRUST | 5.08 | 9.96 |
| ETRANZACT | 16.40 | 9.70 |
| REGALINS | 1.82 | 9.64 |
| NNFM | 93.90 | 8.62 |
For more detailed analysis,
- On InfoWARE Market Data Terminal <TOPG> <GO>
- On InfoWARE Finance Mobile App ( Android, iPhone & iPad and Windows 10) , "Top Gainers & Losers"
Currency Market
In the currency market, the Naira fell 0.01%(-0.11) against the Dollar to settle at 1 to 1Investment Insights - Top 5 Gainers YTD
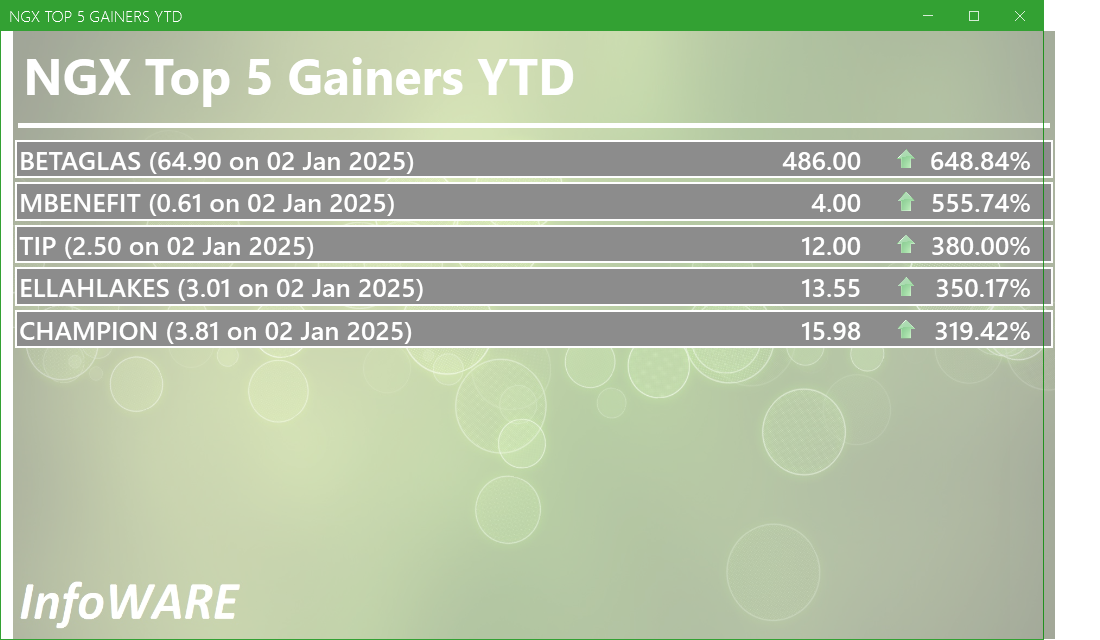
These stocks are the best performers whose price has risen faster than the market as a whole with the best returns year to date. Momentum investors believe that stocks that have outperformed the market will often continue to do so because the factors that caused them to outperform will not suddenly disappear. In addition, other investors seeking to benefit from the stock’s outperformance will often purchase the stock, further bidding its price higher and pushing the stock higher still
For more detailed analysis,
- On InfoWARE Market Data Terminal <T5YTD2> <GO>
- On InfoWARE Finance Mobile App ( Android , iPhone & iPad and Windows 10) , "Research"
NSE: Bull Signal - Price crossed above 15 Day MA
This signal implies these stocks are under buying pressure and the price might continue to rise and therefore positions should be monitored closely. Further suggested analysis include looking at the overall market (ASI) to see if the uptrend is market wide, sector wide or specific to the stock. Portfolio managers tend to use this as a signal to do more research to add to their positions or lock in some profits. Typically further analysis should be done using commands like PC and RV on the InfoWARE Market Data Terminal. Another command is ALERTS to set price triggers for possible exit or entry as necessary
For more detailed analysis,
- On InfoWARE Market Data Terminal <NSEPERF> <GO>
- On InfoWARE Finance Mobile App ( Android , iPhone & iPad and Windows 10) , "Top Gainers & Losers"
| Symbol | Price | %Chg | 15DMA | PE | EPS | DivY | MktCap | Vol | Trades | Value | LstTradeTime |
|---|---|---|---|---|---|---|---|---|---|---|---|
| FGS202663 | 100.00 | 30.00 | 78.67 | 0.00 | 0.00 | 5.00K | 1.00 | 5.00M | 15-Sep-2025 14:30:20.337 | ||
| MERVALUE | 220.00 | 9.09 | 203.97 | 0.00 | 0.00 | 5.05K | 6.00 | 1.05M | 15-Sep-2025 14:30:32.570 | ||
| NNFM | 93.90 | 7.93 | 87.21 | 63.46 | 0.55 | 1.44 | 16.73B | 566.46K | 142.00 | 50.05M | 15-Sep-2025 14:30:12.830 |
| UNILEVER | 72.80 | 7.76 | 71.23 | 67.09 | 0.40 | 2.81 | 418.24B | 913.04K | 117.00 | 66.35M | 15-Sep-2025 14:30:13.667 |
| CONHALLPLC | 4.40 | 7.05 | 4.26 | 69.63 | 0.03 | 2.08 | 47.10B | 4.60M | 97.00 | 18.96M | 15-Sep-2025 14:30:10.910 |
| CILEASING | 6.96 | 5.17 | 6.68 | 6.50 | 0.64 | 1.20 | 5.44B | 1.22M | 67.00 | 8.24M | 15-Sep-2025 14:30:10.873 |
| AFRIPRUD | 15.95 | 4.70 | 15.66 | 19.57 | 0.61 | 1.27 | 31.90B | 3.12M | 140.00 | 49.13M | 15-Sep-2025 14:30:32.157 |
| CAVERTON | 6.80 | 4.41 | 6.61 | 1.15 | 1.57 | 5.52 | 22.78B | 2.39M | 109.00 | 15.92M | 15-Sep-2025 14:30:10.810 |
| VETINDETF | 47.00 | 4.26 | 46.87 | 0.00 | 0.00 | 450.00 | 4.00 | 21.15K | 15-Sep-2025 14:30:32.650 | ||
| VITAFOAM | 82.00 | 4.21 | 80.07 | 8.66 | 2.56 | 7.03 | 102.57B | 984.39K | 178.00 | 78.46M | 15-Sep-2025 14:30:13.917 |
| NGXCNSMRGDS | 3,296.43 | 3.42 | 3,190.66 | 30.19 | 55.24 | 0.00 | 0.00 | 18.16M | 4,320.00 | 1.36B | 15-Sep-2025 14:30:21.183 |
| UCAP | 19.55 | 3.32 | 18.94 | 19.15 | 0.93 | 5.03 | 117.30B | 4.86M | 272.00 | 93.44M | 15-Sep-2025 14:30:32.300 |
| MBENEFIT | 4.00 | 2.50 | 3.93 | 5.43 | 0.11 | 3.28 | 80.25B | 3.86M | 184.00 | 15.47M | 15-Sep-2025 14:30:32.210 |
| UNIVINSURE | 1.25 | 1.60 | 1.24 | 0.00 | 0.00 | 0.00 | 20.00B | 10.54M | 197.00 | 12.86M | 15-Sep-2025 14:30:13.743 |
| GTCO | 94.20 | 1.27 | 93.06 | 7.49 | 7.10 | 1.88 | 2,772.42B | 7.91M | 1,325.00 | 744.42M | 15-Sep-2025 14:30:11.457 |
| FGSUK2027S3 | 80.00 | 0.00 | 80.00 | 0.00 | 0.00 | 0.00 | 0.00 | 0.00 | 15-Sep-2025 14:30:35.470 |
NSE: BEAR Signal - Price crossed below 15 Day MA
This signal implies these stocks are under selling pressure and the price might continue to slide and therefore positions should be monitored closely. Further suggested analysis include looking at the overall market (ASI) to see if the downtrend is market wide, sector wide or specific to the stock. If the overal market trend is upwards, then since these stocks are heading in the opposite direction, then further analysis should be done using commands like PC and RV on the InfoWARE Market Data Terminal. Another command is ALERTS to set price triggers for possible exit is necessar
For more detailed analysis,
- On InfoWARE Market Data Terminal <BEARM> <GO>
- On InfoWARE Finance Mobile App ( Android , iPhone & iPad and Windows 10)
| Symbol | Price | %Chg | 15DMA | PE | EPS | DivY | MktCap | Vol | Trades | Value | LstTradeTime |
|---|---|---|---|---|---|---|---|---|---|---|---|
| LEARNAFRCA | 7.20 | -0.69 | 7.34 | 5.79 | 0.51 | 8.53 | 5.55B | 365.08K | 56.00 | 2.64M | 15-Sep-2025 14:30:11.760 |
| JAIZBANK | 4.51 | -1.11 | 4.52 | 83.05 | 0.03 | 1.67 | 155.78B | 18.89M | 872.00 | 86.36M | 15-Sep-2025 14:30:35.160 |
| WAPIC | 3.45 | -1.45 | 3.48 | 72.55 | 0.02 | 2.56 | 82.77B | 3.10M | 119.00 | 10.81M | 15-Sep-2025 14:30:13.943 |
| JAPAULGOLD | 2.70 | -1.85 | 2.71 | 0.19 | 12.01 | 0.90 | 16.91B | 16.83M | 278.00 | 45.64M | 15-Sep-2025 14:30:32.167 |
| RTBRISCOE | 3.30 | -4.55 | 3.37 | 0.00 | 0.00 | 4.35 | 3.88B | 1.17M | 57.00 | 3.89M | 15-Sep-2025 14:30:13.163 |
| STERLINGNG | 7.55 | -4.64 | 7.66 | 15.75 | 0.30 | 3.19 | 217.37B | 5.13M | 431.00 | 39.21M | 15-Sep-2025 14:30:32.273 |
| HONYFLOUR | 20.90 | -10.05 | 22.15 | 16.28 | 0.31 | 1.40 | 165.74B | 1.58M | 449.00 | 34.59M | 15-Sep-2025 14:30:11.543 |
| MCNICHOLS | 3.55 | -10.99 | 3.66 | 26.80 | 0.05 | 5.88 | 2.55B | 2.20M | 85.00 | 8.32M | 15-Sep-2025 14:30:34.700 |
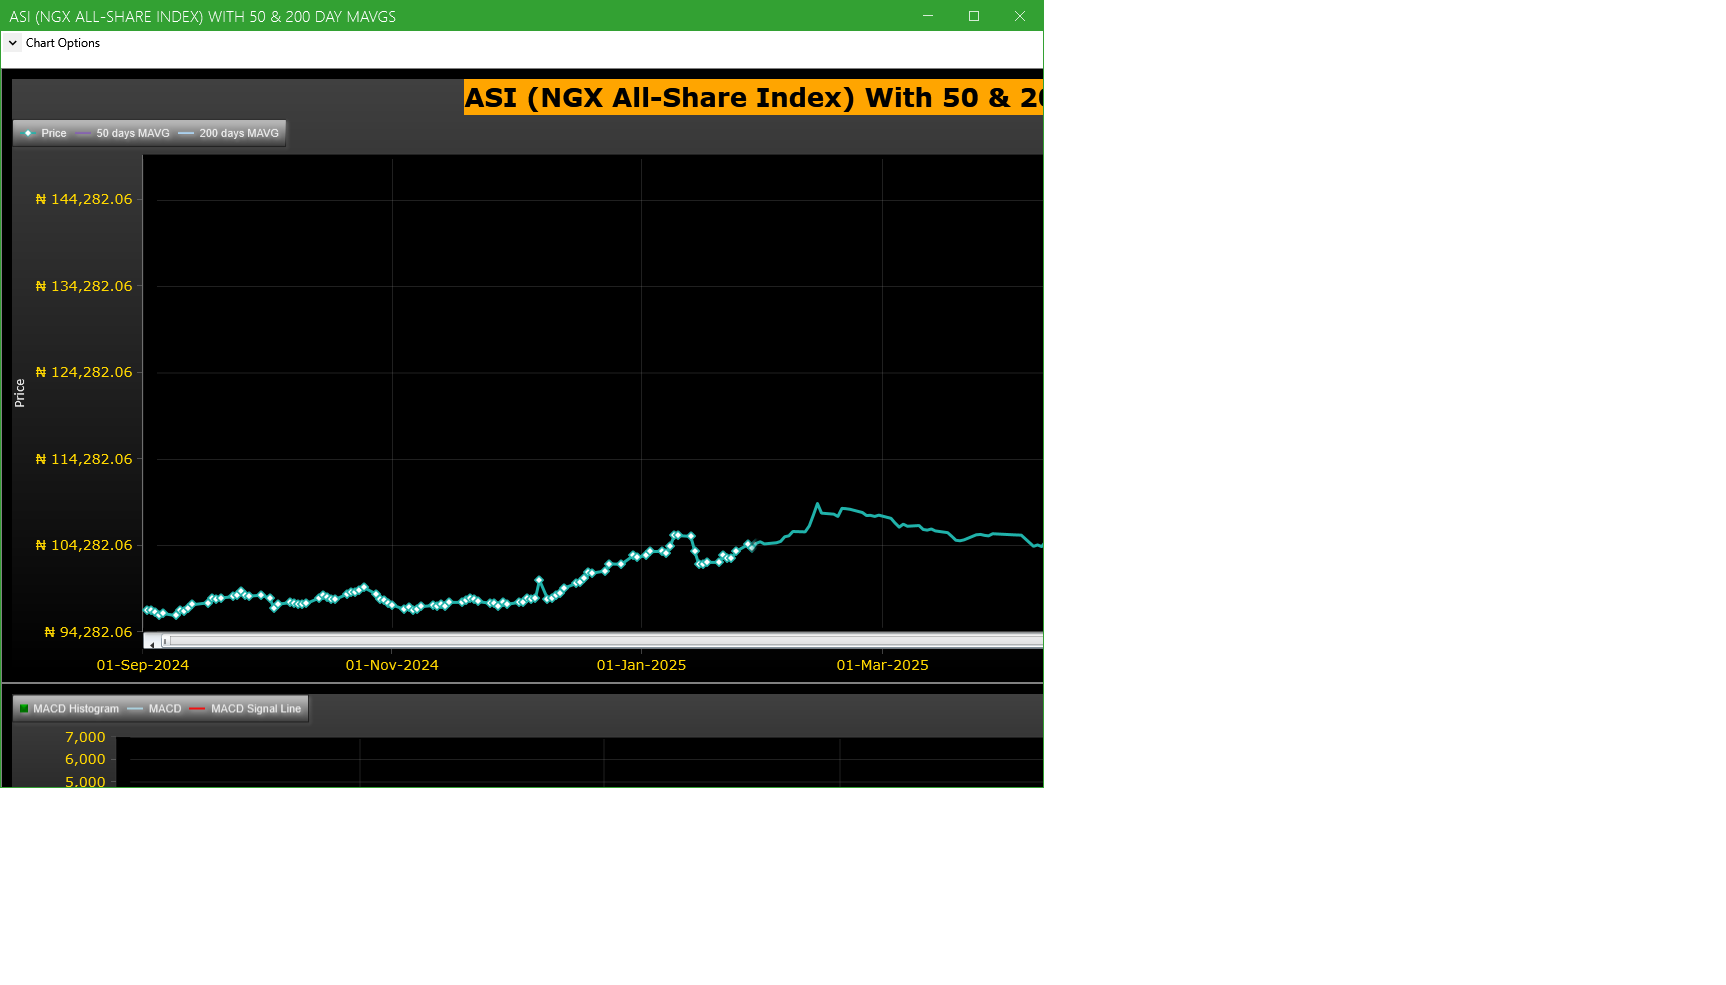
Market Trend - ASI (NGX All-Share-Index) With 50 & 200 Day MAvgs Chart
Technical traders typically use the 50 & 200 day moving averages to aid in choosing
where to enter or exit a position, which then causes these levels to act as strong
support or resistance. As a general guideline, if the price is above a moving average,
the trend is up. If the price is below a moving average, the trend is down.
It is important to note that critics of technical analysis say that moving averages act
as support and resistance because so many traders use these indicators to inform their
trading decisions. Also moving averages tend to work quite well in strong trending conditions
but poorly in choppy or ranging conditions.
Trading Strategies: Crossovers
Crossovers are one of the main moving average strategies. The first type is a price crossover,
which is when the price crosses above or below a moving average to signal a potential change
in trend. Another strategy is to apply two moving averages to a chart: one longer and one
shorter. When the shorter-term MA crosses above the longer-term MA, it is a buy signal, as
it indicates that the trend is shifting up. This is known as a golden cross. Meanwhile, when
the shorter-term MA crosses below the longer-term MA, it is a sell signal, as it indicates that
the trend is shifting down. This is known as a dead/death cross
For more detailed analysis,
- On InfoWARE Market Data Terminal <CI> <GO>
- On InfoWARE Finance Mobile App ( Android , iPhone & iPad and Windows 10) , "Research"
Unusual Volume: Volume traded is more than double the 90 day moving average (All exchanges; ASI & ASem). For more detailed analysis,
- On InfoWARE Market Data Terminal <UV> <GO>
- On InfoWARE Finance Mobile App ( Android , iPhone & iPad and Windows 10)
| Symbol | Name | Volume | 90DAvgVol | %VolChg | Price | LClose | %Chg | Trades | Value |
|---|---|---|---|---|---|---|---|---|---|
| UACN | U A C N PLC. | 67.17M | 3.57M | 1,783.83 | 67.15 | 73.00 | -8.01 | 166 | 4.50B |
| REGALINS | REGENCY ALLIANCE INSURANCE COMPANY PLC | 57.23M | 16.18M | 253.64 | 1.82 | 1.66 | 9.64 | 682 | 98.10M |
| LASACO | LASACO ASSURANCE PLC. | 32.78M | 13.17M | 148.85 | 3.00 | 2.99 | 0.33 | 154 | 98.45M |
| NSLTECH | SECURE ELECTRONIC TECHNOLOGY PLC | 30.88M | 10.56M | 192.33 | 0.83 | 0.86 | -3.49 | 275 | 25.16M |
| GEREGU | GEREGU Power PLC | 10.00M | 77.19K | 12,859.55 | 1,141.50 | 1,141.50 | 0.00 | 172 | 10.28B |
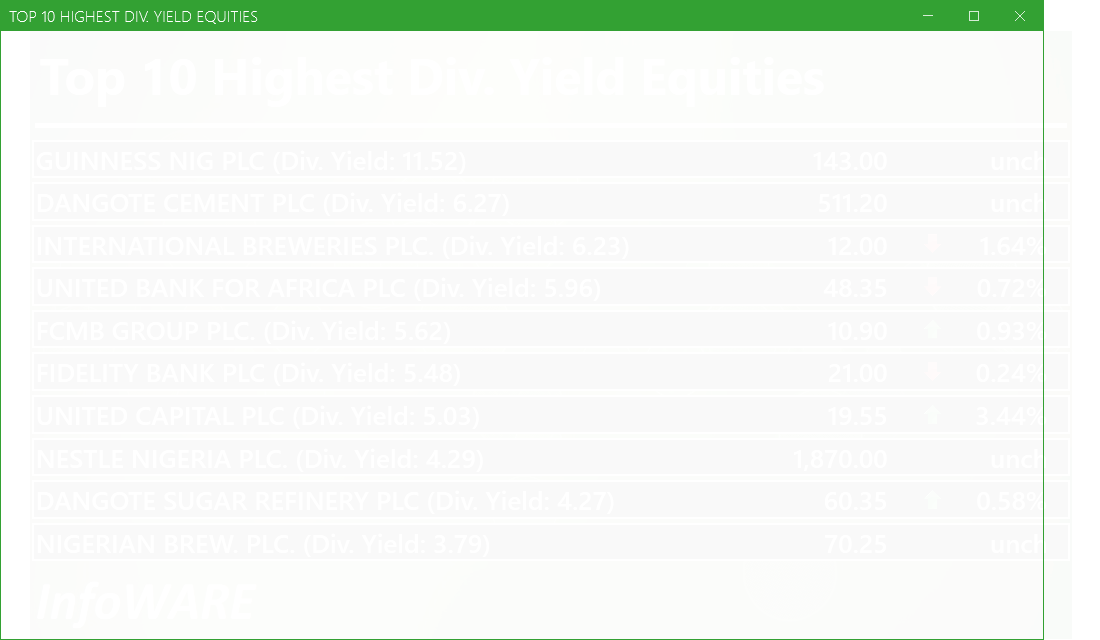
Investment Insights - High Div. Stocks
Dividend stocks distribute a portion of the company earnings to investors on a regular basis and they can a great choice for investors looking for regular income. As an investment or trading strategy, high dividend yield equities provide annual cash payments as against mostly capital gains in the price of a stock. The list in the table below represent the highest dividend paying stocks from the list of the most liquid stocks in the NSE top 30.
For more detailed analysis,
- On InfoWARE Market Data Terminal <HYIELD> <GO>
- On InfoWARE Finance Mobile App ( Android , iPhone & iPad and Windows 10) , "Research"
Investment Insights - Stocks outperforming the ASI but with approximately the same risk
These list of stocks represent equities that are less risky than the ASI but doing better than the ASI (All Shares Index) using the YTD (Year to Date) returns as the measure. The risk is measured by Beta. Beta is an assessment of a stock's tendency to undergo price changes, (its volatility), as well as its potential returns compared to the ASI. It is expressed as a ratio, where a score of 1 represents performance comparable to the ASI, and returns above or below the market may receive scores greater or lower than 1.
For a full list of both positively and negatively corelated stocks visit InfoWARE Market Data Terminal
- On InfoWARE Market Data Terminal <BANL> <GO>
- On InfoWARE Finance Mobile App ( Android , iPhone & iPad and Windows 10)
| Symbol | DivYield | PE | EPS | Beta | %ChgYTD | ASIYTDReturn | BetaDiff |
|---|---|---|---|---|---|---|---|
| HONYFLOUR | 1.40 | 16.28 | 0.31 | 0.99 | 202.02 | 37.29 | 0.01 |
| CAVERTON | 5.52 | 1.15 | 1.57 | 0.98 | 166.67 | 37.29 | 0.02 |
| ROYALEX | 7.81 | 0.00 | 0.00 | 0.96 | 100.91 | 37.29 | 0.04 |
| CORNERST | 5.28 | 8.62 | 0.35 | 0.93 | 83.08 | 37.29 | 0.07 |
| DEAPCAP | 13.76 | 188.84 | 0.01 | 0.89 | 50.00 | 37.29 | 0.11 |
| VERITASKAP | 4.17 | 48.77 | 0.02 | 0.88 | 46.31 | 37.29 | 0.12 |
| UNIVINSURE | 0.00 | 0.00 | 0.00 | 0.83 | 73.61 | 37.29 | 0.17 |
| FTNCOCOA | 1.60 | 0.00 | 0.00 | 0.79 | 229.79 | 37.29 | 0.21 |
| NB | 3.79 | 16.95 | 1.60 | 0.79 | 119.53 | 37.29 | 0.21 |
| MAYBAKER | 3.75 | 58.94 | 0.14 | 0.78 | 86.17 | 37.29 | 0.22 |
African Markets
| Name | LClose | Change | %Chg |
|---|---|---|---|
| BRVM Stock Exchange | 321.68 | 0.39 | 0.12 |
| Botswana Stock Exchange | 10,611.86 | -3.18 | -0.03 |
| Egyptian Exchange | 34,937.44 | 266.96 | 0.77 |
| Ghana Stock Exchange | 7,269.40 | 72.69 | 1.01 |
| Johannesburg Stock Exchange | 104,458.38 | 530.03 | 0.51 |
| Lusaka Stock Exchange | 24,675.31 | 29.57 | 0.12 |
| Casablanca Stock Exchange | 19,828.99 | -45.71 | -0.23 |
| Malawi Stock Exchange | 550,094.60 | -55.02 | -0.01 |
| Nigeria Stock Exchange | 140,545.69 | -126.61 | -0.09 |
| Nairobi Securities Exchange | 178.69 | -0.13 | -0.07 |
| Namibian Stock Exchange | 1,907.64 | 17.95 | 0.95 |
| Rwanda Stock Exchange | 179.11 | 0.20 | 0.11 |
| Tunis Stock Exchange | 12,072.79 | 52.89 | 0.44 |
| Uganda Securities Exchange | 1,442.01 | 0.43 | 0.03 |
Nigeria Market Indexes
| Symbol | LClose | %Chg | WTD% | MTD% | QTD% | YTD% | MktCap | Trades |
|---|---|---|---|---|---|---|---|---|
| ASI | 141,659.00 | 0.79 | 0.00 | 1.39 | 18.30 | 37.29 | 29,777 | |
| NGX30 | 5,163.44 | 0.84 | 0.00 | 1.31 | 9.31 | 35.35 | 16,183 | |
| NGXAFRBVI | 3,589.43 | 0.35 | 0.00 | 2.99 | 1.30 | 44.69 | 5,850 | |
| NGXAFRHDYI | 22,976.82 | 0.93 | 0.00 | 1.98 | 9.86 | 34.94 | 6,952 | |
| NGXASEM | 1,538.10 | 0.00 | 0.00 | 0.00 | -3.57 | -2.88 | 8 | |
| NGXBNK | 1,531.30 | 0.05 | 0.00 | 1.31 | 1.36 | 40.82 | 7,182 | |
| NGXCG | 4,082.15 | 0.09 | 0.00 | 1.18 | 18.71 | 44.28 | 14,746 | |
| NGXCNSMRGDS | 3,296.43 | 3.54 | 0.00 | 3.35 | -4.97 | 90.07 | 4,320 | |
| NGXCOMMDTY | 1,096.51 | 0.00 | 0.00 | 2.66 | 4.70 | 9.65 | ||
| NGXGROWTH | 12,539.12 | 1.40 | 0.00 | 11.96 | 31.86 | 61.53 | 340 | |
| NGXINDUSTR | 4,926.30 | 0.00 | 0.00 | -0.13 | 39.84 | 37.93 | 2,608 | |
| NGXINS | 1,307.33 | -0.23 | 0.00 | 1.90 | 77.00 | 66.29 | 2,661 | |
| NGXLOTUSISLM | 11,695.78 | 1.01 | 0.00 | 2.42 | 22.16 | 67.85 | 6,037 | |
| NGXMAINBOARD | 6,918.17 | 1.28 | 0.00 | 1.93 | 17.28 | 38.25 | 22,146 | |
| NGXMERIGRW | 10,051.11 | 0.57 | 0.00 | 0.37 | 4.13 | 54.08 | 4,366 | |
| NGXMERIVAL | 13,729.72 | -0.08 | 0.00 | 2.69 | 14.91 | 31.63 | 7,948 | |
| NGXOILGAS | 2,417.05 | -0.09 | 0.00 | 1.96 | 1.04 | -10.85 | 367 | |
| NGXPENBRD | 2,632.44 | 0.92 | 0.00 | 1.63 | 14.49 | 43.72 | 24,166 | |
| NGXPENSION | 6,706.36 | 0.14 | 0.00 | 1.31 | 5.53 | 47.91 | 18,022 | |
| NGXPREMIUM | 13,808.18 | -0.12 | 0.00 | 0.33 | 20.39 | 41.87 | 7,291 | |
| NGXSOVBND | 654.78 | -0.14 | 0.00 | -0.62 | 0.19 | 8.85 | 4 |
For more detailed analysis,
- On InfoWARE Market Data Terminal <MKTINS> <GO>
- On InfoWARE Finance Mobile App ( Android, iPhone & iPad and Windows 10) , "Market Indexes"
Find the topic interesting? Will like to comment? Contact Us at solutions@infowarelimited.com
Top News

Chart Of The Day - ASI Chart Vs ASI Advance Decline Line (YTD) (15-Sep-2025 15:09:04.617)
InfoWARE AI Analyst Daily Market Report: 15-Sep-2025

[MERVALUE]>> DAILY INDICATIVE PRICES
[XNSA]>> CORDROS MILESTONE FUNDS' BID & OFFER PRICES
[VSPBONDETF]>> DAILY INDICATIVE PRICES
[XNSA]>> NGX FIXED INCOME INDICATIVE PRICE LIST FOR SEP 15, 2025
[XNSA]>> DAILY FUND PRICE SUBMISSION - FCMB ASSET MANAGEMENT LIMITED
[XNSA]>> REGISTRATION FOR BATCH TWO- 2025 DEALING CLERKSHIP CERTIFICATION PROGRA
[XNSA]>> UPDATED- SAVE THE DATE: 29TH ANNUAL STOCKBROKERS CONFERENCE
[XNSA]>> LISTING OF NGX30H6 AND NGXPENSIONH6 FUTURES CONTRACTS
[SIAMLETF40]>> DAILY INDICATIVE PRICES
[XNSA]>> NOTIFICATION OF PRICE ADJUSTMENT
InfoWARE AI Analyst Weekly Market Report: 12-Sep-2025
Chart Of The Day - ASI Chart Vs ASI Advance Decline Line (YTD) (12-Sep-2025 15:10:12.694)
InfoWARE AI Analyst Daily Market Report: 12-Sep-2025
[MERGROWTH]>> DAILY INDICATIVE PRICES
[VETINDETF]>> DAILY INDICATIVE PRICES
[XNSA]>> NGX FIXED INCOME INDICATIVE PRICE LIST FOR SEP 12, 2025
[XNSA]>> REGISTRATION FOR BATCH TWO- 2025 DEALING CLERKSHIP CERTIFICATION PROGRA
[XNSA]>> UPDATED- SAVE THE DATE: 29TH ANNUAL STOCKBROKERS CONFERENCE
[XNSA]>> CLOSING GONG CEREMONY IN HONOUR OF ISSB DELEGATION
[SIAMLETF40]>> DAILY INDICATIVE PRICES
[XNSA]>> DAILY FUND PRICE SUBMISSION - FCMB ASSET MANAGEMENT LIMITED
Chart Of The Day - ASI Chart Vs ASI Advance Decline Line (YTD) (11-Sep-2025 15:07:38.943)
InfoWARE AI Analyst Daily Market Report: 11-Sep-2025
[XNSA]>> CORDROS MILESTONE FUNDS' BID & OFFER PRICES
[MERVALUE]>> DAILY INDICATIVE PRICES
[VETGOODS]>> DAILY INDICATIVE PRICES
[XNSA]>> DAILY FUND PRICE SUBMISSION - FCMB ASSET MANAGEMENT LIMITED
[XNSA]>> REGISTRATION FOR BATCH TWO- 2025 DEALING CLERKSHIP CERTIFICATION PROGRA
Get IDIA - the stock trading app for the modern investor
Solutions by Business
Product Suites
Company
Contacts
- 8th Floor,
- South Atlantic Petroleum Towers,
- 1 Adeola Odeku Street,
- Victoria Island,
- Lagos, Nigeria.
- Email: solutions@infowarelimited.com
Follow Us
 |
 |
 |
 |