


InfoWARE AI Analyst Daily Market Report: 11-Sep-2025 | InfoWARE Finance
Get IDIA - the stock trading app for the modern investor


InfoWARE AI Analyst Daily Market Report: 11-Sep-2025
(Source: InfoWARE Terminal, Date: 11-Sep-2025)
Dear Investor,
NGX Market Recap – Thursday, September 11, 2025
The NGX All Share Index (ASI) added 0.21% to close at 140,365.36, maintaining its positive Year-To-Date (YTD) streak at 36.32%. Today’s trading session saw reduced liquidity and enthusiasm: daily turnover dropped -35.07% to N11.15B, and overall volume halved to 352.48M. Despite the lighter tape, market breadth remained robust with advancers soundly outpacing decliners (42 vs. 16, breadth ratio: 2.63x). Cautious optimism is brewing, but recent turnover and volume softness calls for nuanced portfolio management. Notably, GUINNESS leapt on exceptional momentum and volume, while the insurance sector displayed mixed signals with both top gainers and losers present.
Key Market Trends & Breadth
- Strong Advancers/Decliners Ratio: 42 stocks advanced, 16 declined – breadth 2.63x (bullish breadth), despite overall softer volumes.
- Turnover Dip: Market turnover dropped -35.07% (N11.15B), while total deals (21,273) show moderate engagement, potentially indicating sector rotation or profit taking.
- Volume Distribution: Volume was up in 61 companies, but down in 76 – participation is narrowing.
- Forex: The Naira appreciated 0.12% to 1,504/$, aiding listed corporates on import costs.
Top Gainers & Losers
| Stock | Price | Change (%) | RSI | Momentum |
|---|---|---|---|---|
| GUINNESS | 143.00 | +10.00% | 51.4 | Unusual volume (1919% of avg), Bullish crossover |
| CILEASING | 6.60 | +10.00% | 48.0 | Cautious (neutral RSI, but strong short-term pop) |
| ETRANZACT | 13.60 | +9.68% | 56.9 | Bullish MACD, YTD leader |
| REGALINS | 1.51 | +9.42% | 53.5 | Positive break above 50DMA |
| LIVINGTRUST | 4.62 | -10.00% | 47.8 | Recent volatility, but YTD still negative |
- GUINNESS stole the show – surged 10% on extraordinary volume (19x 90-day average), trading above both 15DMA and 50DMA with positive YTD trajectory (+62.5%). This combo is rare and denotes institutional accumulation.
- ETRANZACT continues a stellar run, leading YTD (+109.23%) with technicals (MACD, RSI) in a strong uptrend.
- LIVINGTRUST dropped 10%, and despite short-term pops is still a YTD laggard (-32.06%). NEM suffered a similar -9.94%, capping a difficult five-day stretch.
- Insurance sector is a mixed bag: REGALINS (up), NEM, MANSARD, LASACO (all under pressure).
Insider Momentum & Patterns
- Turnover & Volume: The sharp fall in turnover (-35%) amid positive price action suggests selective accumulation – not a wholesale market breakout. This kind of divergence often precedes a consolidation period or sectoral rotation.
- Advancer Leadership: While advancers lead, the fact that more companies saw volume drop than rise (76 vs. 61) points to breadth potentially peaking – watch for pullbacks in overbought leaders.
-
Unusual Volume – GUINNESS, VITAFOAM, NCR:
- GUINNESS - nearly 20x volume surge – rare cluster of technical/momentum buyers, possibly aided by institutional flows (see table below).
- VITAFOAM, NCR – also spiking in activity (5x–19x), foreshadowing possible near-term breakouts.
-
Bullish crossovers & Momentum Stocks:
- GUINNESS, CAP, MBENEFIT, DAARCOMM, UBA trading above 15DMA and 50DMA. UBA warrants attention for a sustained uptrend.
- No market leaders with extremely overbought RSI (>70), so room for further advances in some momentum names.
-
Bearish Breakdowns:
- NEM, LASACO, ELLAHLAKES all below 15DMA and showing negative momentum – pressure building in insurance & agriculture segments.
- STANBICETF30 & CWG also in technical downtrends.
Top YTD Gainers & Losers
| YTD Top Gainers | ||||
|---|---|---|---|---|
| Stock | YTD % | RSI | Div Yield | Current Trend |
| MBENEFIT | +593.44% | 54.9 | 3.28% | Bullish, above 15DMA/50DMA |
| AIICO | +172.61% | 55.2 | 4.13% | Bullish, moderate RSI |
| REGALINS | +88.75% | 53.5 | 6.52% | Momentum persists, but RSI not overbought |
| ETRANZACT | +109.23% | 56.9 | 1.48% | Powerful breakout |
| DAARCOMM | +63.24% | 52.2 | 0.00% | Bullish, moderate risk |
| WAPCO | +83.51% | 51.9 | 2.70% | Stable, recovering from previous dip |
| YTD Top Losers | ||||
|---|---|---|---|---|
| Stock | YTD % | RSI | Div Yield | Current Trend |
| MAYBAKER | -72.87% | 48.9 | 3.75% | Weak recovery signs |
| LIVINGTRUST | -32.06% | 47.8 | 1.67% | Volatile, under pressure |
| NEM | -134.17% | 53.3 | 6.52% | Bearing down, bearish crossover |
| CONHALLPLC | -6.33% | 51.4 | 2.08% | Slight bounce off lows |
| UNIONDICON | -36.81% | 48.7 | 6.25% | Still sluggish |
- Overlaps and Contrasts: REGALINS and ETRANZACT shine as both short-term and YTD leaders – their technicals remain solid (MACD positive, no overbought RSI).
- NEM Insurance stands out as both a top 5 daily and YTD loser, and also appears in bearish technical screens – avoid for now.
- Insurance-Heavy Dynamics: Three of the top 5 YTD gainers and three of the top 5 losers are insurance-related – highlighting volatility and divergence within the sector.
Bullish & Bearish Momentum Patterns
| Bullish (Closing Above 15 DMA) | |||||
|---|---|---|---|---|---|
| Stock | %Chg | RSI | MACD | 15DMA/50DMA | Div Yield |
| GUINNESS | +9.09% | 51.4 | Positive | ↑ 15DMA > 50DMA | 11.52% |
| CAP | +8.45% | – | – | ↑ | 4.13% |
| MBENEFIT | +6.62% | 54.9 | Positive | ↑ | 3.28% |
| DAARCOMM | +6.31% | 52.2 | Near crossover | ↑ | 0.00% |
| UBA | +2.29% | 51.6 | Positive | ↑ | 5.96% |
| Bearish (Closing Below 15 DMA) | ||||
|---|---|---|---|---|
| Stock | %Chg | RSI | MACD | Comment |
| NEM | -11.03% | 53.3 | Negative | Multiple technical breakdowns, avoid |
| LASACO | -2.52% | – | – | Insurance sector weakness |
| ELLAHLAKES | -4.48% | 52.4 | Negative | Agro weakness |
| CWG | -4.94% | 53.0 | Negative swing | IT sector correction |
| MANSARD | -5.00% | 53.9 | Negative | Profit taking ongoing |
| STANBICETF30 | -5.00% | 50.3 | Strong negative MACD | ETF pressure |
Contrarian Signals
- GUINNESS: Massive volume surge, bullish momentum above 15/50DMA, but RSI only in mid-50s (not yet overbought) – could signal further gains ahead; however, such abnormal volume sometimes marks local tops, so monitor for exhaustion.
- REGALINS: High YTD gain (+88.75%) and strong technicals, but dividend yield (6.52%) suggests some investors are locking in, not just chasing momentum – possible short-term pause.
- NEM: Dividend yield is high (6.52%) and RSI not "oversold" (<30), but persistent heavy losses and technical sag point to structural headwinds. Bargain hunters beware – too early for mean reversion.
Sector Heatmap
| Sector | Advancers | Decliners | Key Movers | Institutional Highlight |
|---|---|---|---|---|
| Banking | 4 | 1 | UBA (+2.29%), ZENITHBANK (+1.52%) | ZENITHBANK: 20.17% institutional value share |
| Beverages/Distillers | 1 | 0 | GUINNESS (+10%, 19x volume) | Institutional flows observed |
| Insurance | 2 | 3 | REGALINS (+9.42%), NEM (-10%) | Sector bifurcation, payouts attract |
| IT/Telecom | 1 | 1 | ETRANZACT (+9.68%), CWG (-4.94%) | Retail-led momentum |
| Industry ETFs | 0 | 2 | STANBICETF30 (-5.00%) | Redemptions accelerating |
Dividend-Beta Matrix (Defensive Watch)
| Stock | Dividend Yield | Beta | Momentum Status |
|---|---|---|---|
| REGALINS | 6.52% | 0.47 | Bullish, moderate volatility |
| GUINNESS | 11.52% | 0.33 | Bullish, highly active |
| MANSARD | 4.59% | 0.62 | Slipping below 15DMA, cautious |
| NEM | 6.52% | 0.69 | Bearish, high payout but avoid |
| CAP | 4.13% | 0.04 | Bullish reversal signal |
- Stocks like GUINNESS and REGALINS offer rare combinations of high yield, mid-low beta, and bullish technicals – making them attractive for defensive income seekers, though recent price spikes warrant careful monitoring for reversals.
- NEM offers high yield but its bearish momentum, negative YTD, and technical breakdowns make it a value trap risk.
Institutional Clustering Alerts
- ZENITHBANK: Institutional investors accounted for 20.17% of total trade value. This institutional clustering suggests accumulation and underlying confidence – aligns with positive technicals and trading above 15DMA/50DMA.
- WAPCO also appeared prominently in institutional flow (13.51% of value), supporting its YTD/top gainer status.
Dividend Yield vs. Bull/Bear Momentum
- REGALINS and GUINNESS stand out, combining high dividend yields with bullish momentum – these often attract both income and momentum traders.
- NEM is high yielding but is a classic "catching a falling knife” right now – let technicals bottom first before considering as a defensive buy.
Traders’ Suggestions
- For Momentum Traders: Consider trailing stops on GUINNESS and ETRANZACT. Their technicals are strong but risk of mean-reversion grows after several outsized sessions.
- Defensive/Income Focused: REGALINS and GUINNESS offer rare high yield + positive momentum – diversify across both but re-assess daily as volume/price patterns could revert quickly.
- Avoid Value Traps: NEM and MANSARD are high yielders but caught in technical downtrends – best to wait for setup confirmation before re-entering.
- Sector Alert: Insurance sector is a stock-picker’s arena (split between big winners and big losers) – avoid blanket bets.
- Volume Spike Watch: Stocks like VITAFOAM and NCR with multi-fold increases in volume may emerge as next breakouts for nimble traders.
Market Activity/Trades Summary Insights
- Retail vs Institutional: Institutional investors, while responsible for just 37.5% of trades, accounted for a massive 87.86% of total traded value and 64.08% of volume. This demonstrates a strong preference for large blocks/high-conviction positions.
-
Top 5 Most Traded (Institutional):
- 1. ZENITHBANK (20.17% of institutional value) – bullish technicals, accumulation
- 2. ARADEL (8.42%) – stable trading, no major technical signals
- 3. MTNN (6.99%) – sideways, large volume blocks
- 4. WAPCO (3.13%) – aligns with institutional clustering/persistent uptrends
- 5. FIRSTHOLDCO (1.75%) – steady flows, minor technical uplift
-
Top 5 Most Traded (Retail):
- 1. MTNN, 2. ACCESSCORP, 3. ZENITHBANK, 4. GTCO, 5. UBA
- Insight: When institutional and retail favourites overlap (e.g., ZENITHBANK, UBA), strong momentum can follow, but today’s GUINNESS trade suggests nimbleness for spotting non-bank institutional flows is rewarded.
Hidden Insights / Potential Edges
- Bifurcation Within Sectors: Insurance and banking dominate both winners and losers tables – stock picking is imperative.
- Watch for Rotation: Lower turnover, narrowing volume participation, and outperformance in select names hint at funds rotating out of broad market ETFs/laggards into highest conviction names (GUINNESS, ETRANZACT).
- Mean Reversion Risk: Super-high volume up days (like GUINNESS today) sometimes precede short-term pauses or reversals. Risk-aware momentum traders should be ready to lock partial gains.
- Dividend Yield as Anchor: Names with high yields and beta below 1 (REGALINS, GUINNESS, CAP) attract both income and growth seekers, but when price momentum stalls, expect faster profit taking.
- Retail vs. Institutional Focus: Retail flows persist in banking majors and telecoms; institutions more willing to step into "value” plays and traded non-bank, high-conviction bets.
In Summary: Today's trading paints a nuanced picture: robust breadth, rotational leadership, and surging pockets of institutional enthusiasm (chiefly GUINNESS). However, caution is warranted with turnover and volume receding. Stock picking and triggers matter more than ever, especially in bifurcated sectors like insurance. For fresh trades, seek either clear technical momentum/volume confirmation or defensive high yields with improving technicals – and beware of value traps.
|
Top ASI Gainers Over Last 5 Trading Days
|
Top ASI Losers Over Last 5 Trading Days
|
For more detailed analysis, on InfoWARE Market Data Terminal <NSEPERF> <GO>
On InfoWARE Finance Mobile App (Android, iPhone & iPad, Windows Phone and Windows 8/10), "Top Gainers & Losers"
C & I LEASING PLC. (CILEASING) topped the advancers list closing at N6.60 with a gain of 10.00% followed by LIVINGTRUST MORTGAGE BANK PLC (LIVINGTRUST) which closed at N4.62 with a gain of 10.00%.
On the flip side N.E.M INSURANCE CO (NIG) PLC. (NEM) and MANSARD INSURANCE PLC (MANSARD) topped the decliners log with a loss of -9.94% at a close of N28.10, and -4.76% to close the day at N15.99 respectively.
| Symbol | LClose | %Chg |
|---|---|---|
| CILEASING | 6.60 | 10.00 |
| LIVINGTRUST | 4.62 | 10.00 |
| GUINNESS | 143.00 | 10.00 |
| ETRANZACT | 13.60 | 9.68 |
| REGALINS | 1.51 | 9.42 |
| Symbol | LClose | %Chg |
|---|---|---|
| NEM | 28.10 | -9.94 |
| MANSARD | 15.99 | -4.76 |
| STANBICETF30 | 400.00 | -4.76 |
| CWG | 16.20 | -4.71 |
| ELLAHLAKES | 13.40 | -4.29 |
For more detailed analysis,
- On InfoWARE Market Data Terminal <TOPG> <GO>
- On InfoWARE Finance Mobile App ( Android, iPhone & iPad and Windows 10) , "Top Gainers & Losers"
Currency Market
In the currency market, the Naira appreciated 0.12%(1.80) against the Dollar to settle at 1 to 1NSE: Bull Signal - Price crossed above 15 Day MA
This signal implies these stocks are under buying pressure and the price might continue to rise and therefore positions should be monitored closely. Further suggested analysis include looking at the overall market (ASI) to see if the uptrend is market wide, sector wide or specific to the stock. Portfolio managers tend to use this as a signal to do more research to add to their positions or lock in some profits. Typically further analysis should be done using commands like PC and RV on the InfoWARE Market Data Terminal. Another command is ALERTS to set price triggers for possible exit or entry as necessary
For more detailed analysis,
- On InfoWARE Market Data Terminal <NSEPERF> <GO>
- On InfoWARE Finance Mobile App ( Android , iPhone & iPad and Windows 10) , "Top Gainers & Losers"
| Symbol | Price | %Chg | 15DMA | PE | EPS | DivY | MktCap | Vol | Trades | Value | LstTradeTime |
|---|---|---|---|---|---|---|---|---|---|---|---|
| GUINNESS | 143.00 | 9.09 | 133.59 | 31.75 | 1.95 | 11.52 | 313.22B | 8.67M | 204.00 | 1.24B | 11-Sep-2025 14:30:11.583 |
| CAP | 71.00 | 8.45 | 68.11 | 12.92 | 2.90 | 4.13 | 57.85B | 435.91K | 43.00 | 30.63M | 11-Sep-2025 14:30:09.570 |
| MBENEFIT | 4.23 | 6.62 | 3.97 | 5.43 | 0.11 | 3.28 | 84.86B | 8.73M | 198.00 | 35.71M | 11-Sep-2025 14:30:30.710 |
| DAARCOMM | 1.11 | 6.31 | 1.06 | 0.00 | 0.00 | 0.00 | 13.32B | 1.80M | 105.00 | 1.98M | 11-Sep-2025 14:30:10.883 |
| UNIVINSURE | 1.25 | 5.60 | 1.23 | 0.00 | 0.00 | 0.00 | 20.00B | 5.73M | 174.00 | 7.06M | 11-Sep-2025 14:30:13.097 |
| RTBRISCOE | 3.54 | 5.37 | 3.37 | 0.00 | 0.00 | 4.35 | 4.16B | 1.63M | 82.00 | 5.54M | 11-Sep-2025 14:30:12.637 |
| CAVERTON | 6.72 | 4.61 | 6.67 | 1.15 | 1.57 | 5.52 | 22.52B | 763.07K | 92.00 | 4.99M | 11-Sep-2025 14:30:09.587 |
| DEAPCAP | 1.80 | 4.44 | 1.75 | 188.84 | 0.01 | 13.76 | 2.70B | 4.06M | 116.00 | 7.49M | 11-Sep-2025 14:30:11.047 |
| FTNCOCOA | 6.20 | 4.19 | 6.19 | 0.00 | 0.00 | 1.60 | 24.18B | 1.72M | 229.00 | 10.52M | 11-Sep-2025 14:30:11.420 |
| HONYFLOUR | 23.00 | 3.91 | 22.29 | 16.28 | 0.31 | 1.40 | 182.39B | 1.01M | 265.00 | 23.22M | 11-Sep-2025 14:30:11.630 |
| NPFMCRFBK | 3.12 | 3.21 | 3.09 | 5.63 | 0.27 | 8.00 | 18.70B | 539.53K | 27.00 | 1.68M | 11-Sep-2025 14:30:12.393 |
| JAPAULGOLD | 2.77 | 2.53 | 2.71 | 0.19 | 12.01 | 0.90 | 17.35B | 42.05M | 204.00 | 111.86M | 11-Sep-2025 14:30:11.770 |
| UBA | 48.10 | 2.29 | 47.63 | 8.29 | 4.05 | 5.96 | 1,644.99B | 27.27M | 866.00 | 1.29B | 11-Sep-2025 14:30:31.270 |
| GUINEAINS | 1.60 | 1.88 | 1.58 | 66.79 | 0.01 | 1.96 | 9.82B | 4.70M | 125.00 | 7.54M | 11-Sep-2025 14:30:30.697 |
| NAHCO | 105.00 | 1.48 | 103.74 | 92.98 | 0.41 | 6.66 | 204.65B | 882.87K | 115.00 | 92.79M | 11-Sep-2025 14:30:12.177 |
| NGXMERIVAL | 13,620.30 | 1.05 | 13,582.18 | 12.13 | 38.38 | 0.00 | 0.00 | 100.66M | 5,679.00 | 4.54B | 11-Sep-2025 14:30:16.393 |
| NGXAFRHDYI | 22,713.09 | 0.46 | 22,626.61 | 7.46 | 39.30 | 0.00 | 0.00 | 68.98M | 5,018.00 | 4.09B | 11-Sep-2025 14:30:16.200 |
| NGXPENSION | 6,661.85 | 0.42 | 6,655.14 | 429.80 | 359.59 | 0.00 | 0.00 | 162.14M | 12,649.00 | 10.13B | 11-Sep-2025 14:30:16.423 |
| NGXPREMIUM | 13,903.63 | 0.34 | 13,845.79 | 2,048.74 | 238.70 | 0.00 | 0.00 | 86.04M | 5,360.00 | 5.44B | 11-Sep-2025 14:30:16.430 |
| NGXCNSMRGDS | 3,187.71 | 0.21 | 3,185.57 | 30.19 | 55.24 | 0.00 | 0.00 | 43.17M | 2,946.00 | 3.49B | 11-Sep-2025 14:30:16.247 |
| NGXMERIGRW | 9,986.39 | 0.21 | 9,983.53 | 34.89 | 293.99 | 0.00 | 0.00 | 35.99M | 2,983.00 | 2.43B | 11-Sep-2025 14:30:16.380 |
NSE: BEAR Signal - Price crossed below 15 Day MA
This signal implies these stocks are under selling pressure and the price might continue to slide and therefore positions should be monitored closely. Further suggested analysis include looking at the overall market (ASI) to see if the downtrend is market wide, sector wide or specific to the stock. If the overal market trend is upwards, then since these stocks are heading in the opposite direction, then further analysis should be done using commands like PC and RV on the InfoWARE Market Data Terminal. Another command is ALERTS to set price triggers for possible exit is necessar
For more detailed analysis,
- On InfoWARE Market Data Terminal <BEARM> <GO>
- On InfoWARE Finance Mobile App ( Android , iPhone & iPad and Windows 10)
| Symbol | Price | %Chg | 15DMA | PE | EPS | DivY | MktCap | Vol | Trades | Value | LstTradeTime |
|---|---|---|---|---|---|---|---|---|---|---|---|
| LASACO | 3.18 | -2.52 | 3.20 | 21.56 | 0.11 | 4.05 | 5.83B | 9.63M | 132.00 | 29.61M | 11-Sep-2025 14:30:11.857 |
| ELLAHLAKES | 13.40 | -4.48 | 13.89 | 0.00 | 0.00 | 0.00 | 26.80B | 6.00M | 413.00 | 83.24M | 11-Sep-2025 14:30:11.140 |
| CWG | 16.20 | -4.94 | 16.27 | 0.00 | 0.00 | 2.46 | 40.90B | 929.94K | 119.00 | 15.25M | 11-Sep-2025 14:30:09.787 |
| STANBICETF30 | 400.00 | -5.00 | 413.63 | 0.00 | 0.00 | 599.00 | 13.00 | 242.08K | 11-Sep-2025 14:30:31.040 | ||
| MANSARD | 15.99 | -5.00 | 16.14 | 31.16 | 0.24 | 4.59 | 143.91B | 922.13K | 131.00 | 14.71M | 11-Sep-2025 14:30:11.967 |
| NEM | 28.10 | -11.03 | 29.89 | 24.99 | 0.37 | 6.52 | 140.96B | 1.34M | 160.00 | 37.73M | 11-Sep-2025 14:30:12.313 |
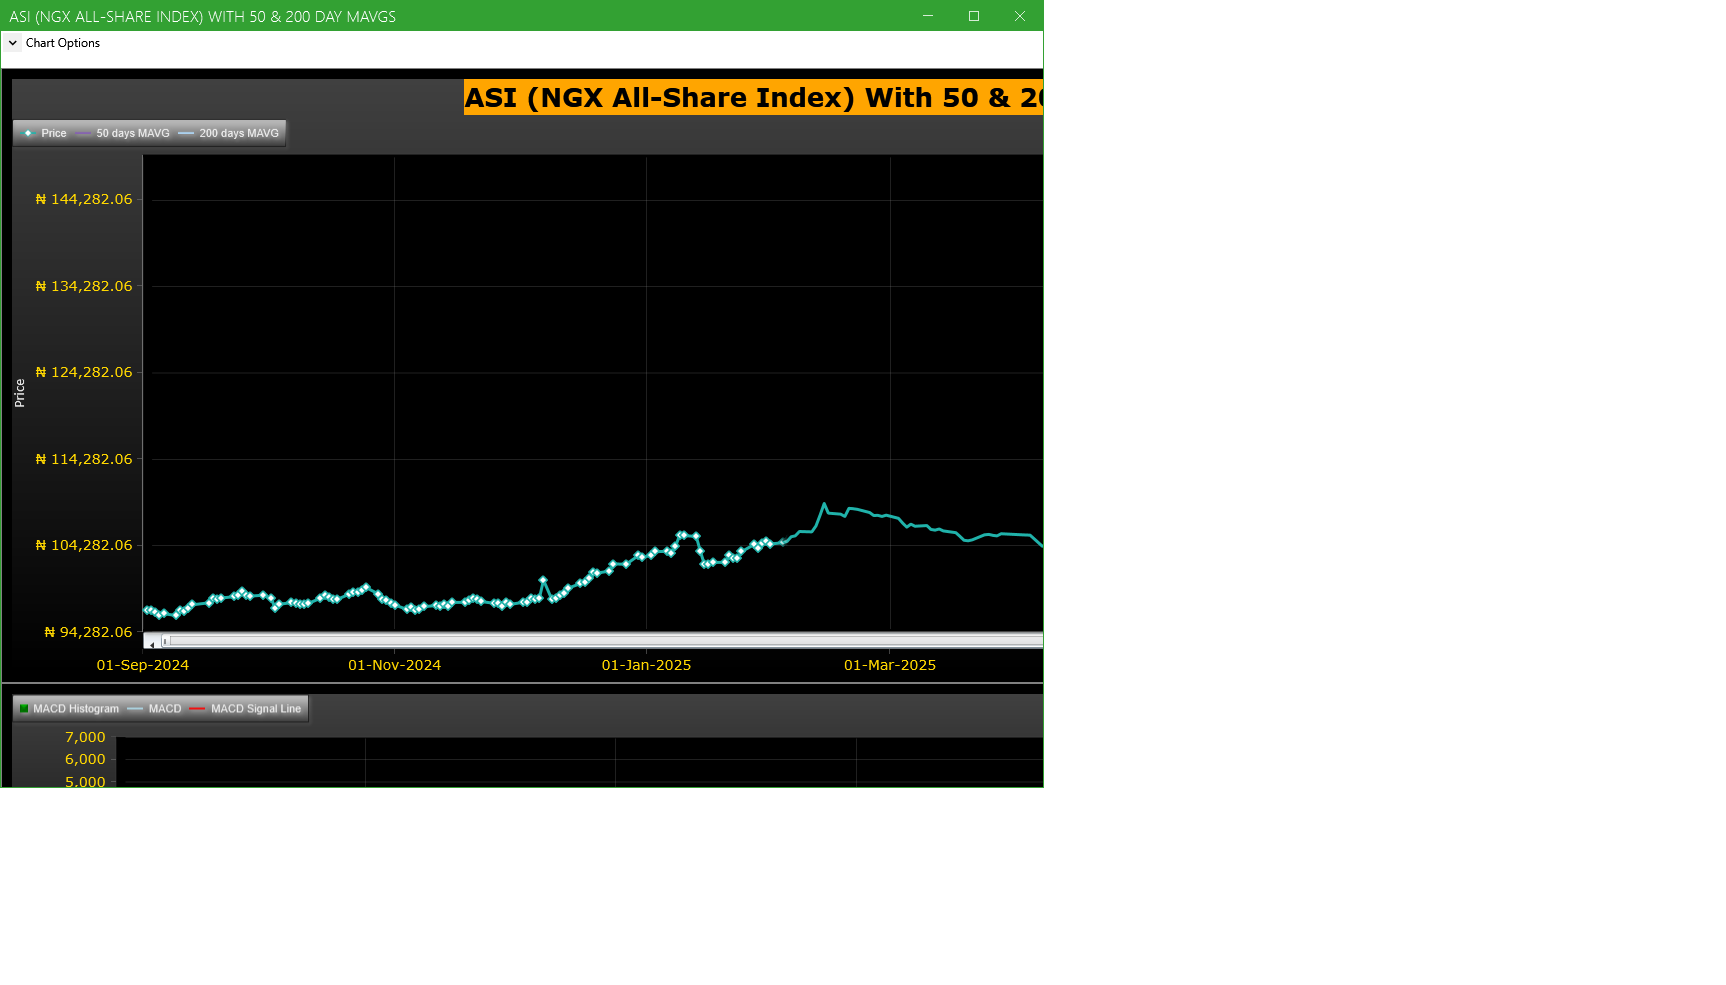
Market Trend - ASI (NGX All-Share-Index) With 50 & 200 Day MAvgs Chart
Technical traders typically use the 50 & 200 day moving averages to aid in choosing
where to enter or exit a position, which then causes these levels to act as strong
support or resistance. As a general guideline, if the price is above a moving average,
the trend is up. If the price is below a moving average, the trend is down.
It is important to note that critics of technical analysis say that moving averages act
as support and resistance because so many traders use these indicators to inform their
trading decisions. Also moving averages tend to work quite well in strong trending conditions
but poorly in choppy or ranging conditions.
Trading Strategies: Crossovers
Crossovers are one of the main moving average strategies. The first type is a price crossover,
which is when the price crosses above or below a moving average to signal a potential change
in trend. Another strategy is to apply two moving averages to a chart: one longer and one
shorter. When the shorter-term MA crosses above the longer-term MA, it is a buy signal, as
it indicates that the trend is shifting up. This is known as a golden cross. Meanwhile, when
the shorter-term MA crosses below the longer-term MA, it is a sell signal, as it indicates that
the trend is shifting down. This is known as a dead/death cross
For more detailed analysis,
- On InfoWARE Market Data Terminal <CI> <GO>
- On InfoWARE Finance Mobile App ( Android , iPhone & iPad and Windows 10) , "Research"
Unusual Volume: Volume traded is more than double the 90 day moving average (All exchanges; ASI & ASem). For more detailed analysis,
- On InfoWARE Market Data Terminal <UV> <GO>
- On InfoWARE Finance Mobile App ( Android , iPhone & iPad and Windows 10)
| Symbol | Name | Volume | 90DAvgVol | %VolChg | Price | LClose | %Chg | Trades | Value |
|---|---|---|---|---|---|---|---|---|---|
| GUINNESS | GUINNESS NIG PLC | 8.67M | 429.52K | 1,919.28 | 143.00 | 130.00 | 10.00 | 204 | 1.24B |
| VITAFOAM | VITAFOAM NIG PLC. | 5.74M | 891.69K | 543.93 | 78.45 | 78.45 | 0.00 | 146 | 450.12M |
| NCR | NCR (NIGERIA) PLC. | 190.87K | 49.31K | 287.08 | 15.20 | 13.95 | 8.96 | 23 | 2.90M |
| LOTUSHAL15 | LOTUS HALAL EQUITY ETF | 21.20K | 6.87K | 208.50 | 57.39 | 58.31 | -1.58 | 39 | 1.31M |
| VSPBONDETF | VETIVA S & P NIGERIA SOVEREIGN BOND ETF | 5.61K | 1.41K | 297.84 | 201.00 | 202.01 | -0.50 | 12 | 1.14M |
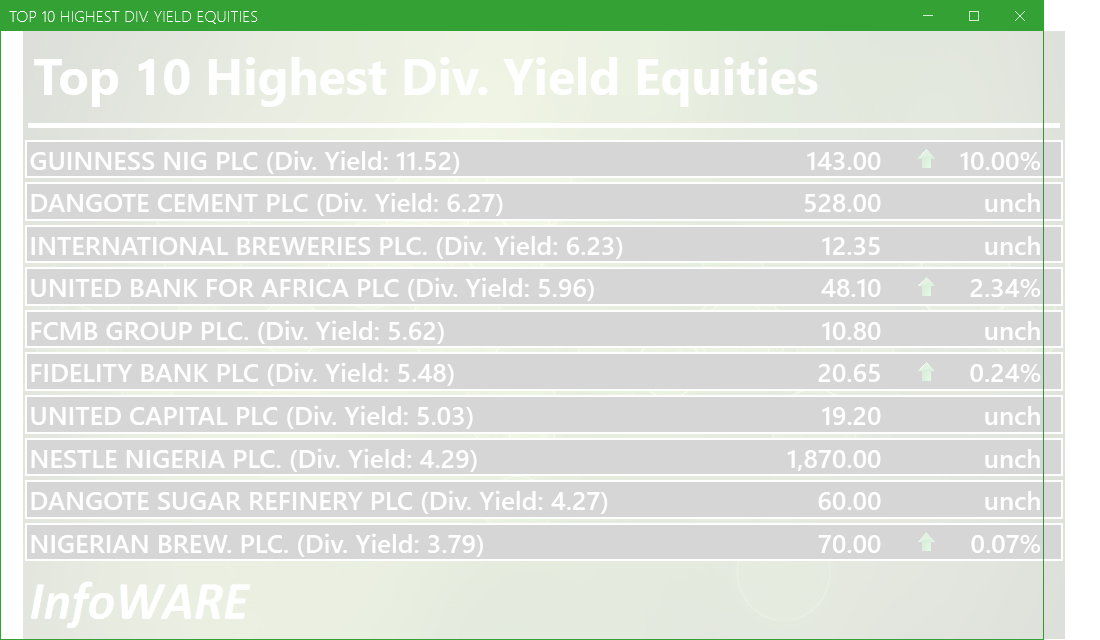
Investment Insights - High Div. Stocks
Dividend stocks distribute a portion of the company earnings to investors on a regular basis and they can a great choice for investors looking for regular income. As an investment or trading strategy, high dividend yield equities provide annual cash payments as against mostly capital gains in the price of a stock. The list in the table below represent the highest dividend paying stocks from the list of the most liquid stocks in the NSE top 30.
For more detailed analysis,
- On InfoWARE Market Data Terminal <HYIELD> <GO>
- On InfoWARE Finance Mobile App ( Android , iPhone & iPad and Windows 10) , "Research"
African Markets
| Name | LClose | Change | %Chg |
|---|---|---|---|
| BRVM Stock Exchange | 320.80 | 0.38 | 0.12 |
| Botswana Stock Exchange | 10,615.45 | 0.00 | 0.00 |
| Egyptian Exchange | 34,670.10 | 285.39 | 0.83 |
| Ghana Stock Exchange | 7,196.64 | 24.39 | 0.34 |
| Lusaka Stock Exchange | 24,580.27 | 0.00 | 0.00 |
| Casablanca Stock Exchange | 19,842.32 | 320.16 | 1.64 |
| Malawi Stock Exchange | 550,295.49 | 3,064.49 | 0.56 |
| Nigeria Stock Exchange | 140,365.36 | 573.15 | 0.41 |
| Nairobi Securities Exchange | 178.78 | 1.26 | 0.71 |
| Rwanda Stock Exchange | 178.91 | 0.00 | 0.00 |
| Uganda Securities Exchange | 1,432.94 | 2.43 | 0.17 |
Nigeria Market Indexes
| Symbol | LClose | %Chg | WTD% | MTD% | QTD% | YTD% | MktCap | Trades |
|---|---|---|---|---|---|---|---|---|
| ASI | 140,657.29 | 0.21 | 0.91 | 0.67 | 17.47 | 36.32 | 21,273 | |
| NGX30 | 5,126.39 | 0.15 | 0.87 | 0.58 | 8.52 | 34.38 | 11,256 | |
| NGXAFRBVI | 3,542.38 | 0.92 | 1.59 | 1.64 | -0.03 | 42.79 | 4,272 | |
| NGXAFRHDYI | 22,713.09 | 0.46 | 1.76 | 0.81 | 8.60 | 33.39 | 5,018 | |
| NGXASEM | 1,538.10 | 0.00 | 0.00 | 0.00 | -3.57 | -2.88 | 4 | |
| NGXBNK | 1,515.86 | 0.78 | 1.23 | 0.29 | 0.34 | 39.40 | 4,733 | |
| NGXCG | 4,053.88 | 0.59 | 1.39 | 0.48 | 17.89 | 43.29 | 10,638 | |
| NGXCNSMRGDS | 3,187.71 | 0.21 | 0.50 | -0.06 | -8.10 | 83.80 | 2,946 | |
| NGXCOMMDTY | 1,091.17 | 0.01 | 0.63 | 2.16 | 4.19 | 9.11 | ||
| NGXGROWTH | 12,272.23 | 1.66 | 9.41 | 9.57 | 29.05 | 58.09 | 230 | |
| NGXINDUSTR | 4,995.67 | 0.04 | 2.54 | 1.28 | 41.81 | 39.87 | 1,964 | |
| NGXINS | 1,318.39 | -1.16 | -0.08 | 2.76 | 78.50 | 67.69 | 2,081 | |
| NGXLOTUSISLM | 11,593.85 | 0.20 | 2.21 | 1.53 | 21.09 | 66.39 | 4,098 | |
| NGXMAINBOARD | 6,818.50 | 0.13 | 0.43 | 0.46 | 15.59 | 36.26 | 15,683 | |
| NGXMERIGRW | 9,986.39 | 0.21 | 0.76 | -0.28 | 3.46 | 53.09 | 2,983 | |
| NGXMERIVAL | 13,620.30 | 1.06 | 2.29 | 1.87 | 14.00 | 30.58 | 5,679 | |
| NGXOILGAS | 2,395.74 | 0.10 | 1.38 | 1.06 | 0.15 | -11.63 | 289 | |
| NGXPENBRD | 2,609.91 | 0.21 | 0.93 | 0.76 | 13.51 | 42.49 | 17,147 | |
| NGXPENSION | 6,661.85 | 0.42 | 1.20 | 0.63 | 4.83 | 46.93 | 12,649 | |
| NGXPREMIUM | 13,903.63 | 0.34 | 1.79 | 1.03 | 21.22 | 42.85 | 5,360 | |
| NGXSOVBND | 642.29 | 0.00 | -1.95 | -2.52 | -1.72 | 6.77 | 0 |
For more detailed analysis,
- On InfoWARE Market Data Terminal <MKTINS> <GO>
- On InfoWARE Finance Mobile App ( Android, iPhone & iPad and Windows 10) , "Market Indexes"
Find the topic interesting? Will like to comment? Contact Us at solutions@infowarelimited.com
Top News

Chart Of The Day - ASI Chart Vs ASI Advance Decline Line (YTD) (11-Sep-2025 15:07:38.943)
InfoWARE AI Analyst Daily Market Report: 11-Sep-2025

[XNSA]>> CORDROS MILESTONE FUNDS' BID & OFFER PRICES
[MERVALUE]>> DAILY INDICATIVE PRICES
[VETGOODS]>> DAILY INDICATIVE PRICES
[XNSA]>> DAILY FUND PRICE SUBMISSION - FCMB ASSET MANAGEMENT LIMITED
[XNSA]>> REGISTRATION FOR BATCH TWO- 2025 DEALING CLERKSHIP CERTIFICATION PROGRA
[SIAMLETF40]>> DAILY INDICATIVE PRICES
[XNSA]>> UPDATED- SAVE THE DATE: 29TH ANNUAL STOCKBROKERS CONFERENCE
[XNSA]>> CLOSING GONG CEREMONY IN HONOUR OF ISSB DELEGATION
Chart Of The Day - ASI Chart Vs ASI Advance Decline Line (YTD) (10-Sep-2025 15:11:27.842)
InfoWARE AI Analyst Daily Market Report: 10-Sep-2025
[XNSA]>> DAILY FUND PRICE SUBMISSION - FCMB ASSET MANAGEMENT LIMITED
[VETGOODS]>> DAILY INDICATIVE PRICES
[XNSA]>> NGX FIXED INCOME INDICATIVE PRICE LIST FOR SEP 10, 2025
[XNSA]>> CLOSING GONG CEREMONY AND FACTS BEHIND THE FIGURES BY DANGOTE CEMENT
[XNSA]>> REGISTRATION FOR BATCH TWO- 2025 DEALING CLERKSHIP CERTIFICATION PROGRA
[XNSA]>> UPDATED- SAVE THE DATE: 29TH ANNUAL STOCKBROKERS CONFERENCE
[XNSA]>> CLOSING GONG CEREMONY IN HONOUR OF ISSB DELEGATION
[STANBICETF30]>> DAILY INDICATIVE PRICES
Chart Of The Day - ASI Chart Vs ASI Advance Decline Line (YTD) (09-Sep-2025 15:07:15.662)
InfoWARE AI Analyst Daily Market Report: 09-Sep-2025
[XNSA]>> DAILY FUND PRICE SUBMISSION - FCMB ASSET MANAGEMENT LIMITED
[MERGROWTH]>> DAILY INDICATIVE PRICES
[XNSA]>> CORDROS MILESTONE FUNDS' BID & OFFER PRICES
[VSPBONDETF]>> DAILY INDICATIVE PRICES
[XNSA]>> NOTIFICATION OF LIFTING OF SUSPENSION
[XNSA]>> NGX FIXED INCOME INDICATIVE PRICE LIST FOR SEP 09, 2025
[XNSA]>> CLOSING GONG CEREMONY AND FACTS BEHIND THE FIGURES BY DANGOTE CEMENT
[XNSA]>> REGISTRATION FOR BATCH TWO- 2025 DEALING CLERKSHIP CERTIFICATION PROGRA
Get IDIA - the stock trading app for the modern investor
Solutions by Business
Product Suites
Company
Contacts
- 8th Floor,
- South Atlantic Petroleum Towers,
- 1 Adeola Odeku Street,
- Victoria Island,
- Lagos, Nigeria.
- Email: solutions@infowarelimited.com
Follow Us
 |
 |
 |
 |