


InfoWARE AI Analyst Daily Market Report: 12-Sep-2025 | InfoWARE Finance
Get IDIA - the stock trading app for the modern investor


InfoWARE AI Analyst Daily Market Report: 12-Sep-2025
(Source: InfoWARE Terminal, Date: 12-Sep-2025)
Dear Investor,
NGX Market Insight & Summary – Friday, September 12, 2025
The NGX All Share Index (ASI) finished marginally lower, down -0.09% to close at 140,665.85 points, yet maintains a robust +36.21% YTD return. Market activity was mixed—volume traded rose noticeably to 399.39M (up 13.3% from yesterday), but turnover plunged -36.63% to ₦7.06B. Market breadth stayed constructive (1.43x), with 33 advancers against 23 decliners. Notably, sector performance, technical signals, and institutional clustering all painted a nuanced, opportunity-filled landscape for discerning investors. The currency market saw the Naira tick up +0.05%, settling at ₦1,504/$.
🔍 Key Trends & Market Breadth
- Market breadth: Firmly positive (1.43x); 33 stocks advanced, 23 declined—suggesting confidence, but with caution in large caps.
- Turnover/Volume Divergence: Turnover fell sharply, even as trading volume rose, signaling a shift toward lower-priced equities and heightened retail activity. Caution is warranted: value rotated into smaller names.
- Volume Action: 70 listed companies saw higher volumes, but trade value flagged. Five stocks had truly unusual volume (over 2x their 90-day average), notably NSLTECH (+655% vol), ARADEL (+485%), UNIONDICON (+373%), LIVINGTRUST, and CHELLARAM (+251%).
🚀 Top Gainers & Losers
Top 5 Gainers:
| Stock | Price | % Change | RSI | MACD | 15D/50D MA |
|---|---|---|---|---|---|
| REGENCY ALLIANCE INSURANCE (REGALINS) | 1.66 | +9.93% | 55.85 | 0.06 | 1.38 / 0.47 |
| E-TRANZACT INT’L (ETRANZACT) | 14.95 | +9.93% | 59.73 | 0.58 | 11.43 / 0.58 |
| CHELLARAMS (CHELLARAM) | 13.3 | +9.92% | 56.60 | 0.21 | 10.93 / n/a |
| INDUSTRIAL & MEDICAL GASES (IMG) | 36.6 | +9.91% | 48.85 | -1.27 | 35.99 / n/a |
| JOHN HOLT (JOHNHOLT) | 7.45 | +9.56% | 50.52 | -0.25 | 6.81 / n/a |
Note: Many top gainers traded with strong RSI and bullish MACD, and CHELLARAM posted both a top price move and highly unusual volume.
Top 5 Losers:
| Stock | Price | % Change | RSI | MACD | 15D/50D MA |
|---|---|---|---|---|---|
| MUTUAL BENEFITS ASSURANCE (MBENEFIT) | 3.9 | -7.80% | 56.73 | 0.28 | 3.96 / n/a |
| LASACO ASSURANCE (LASACO) | 2.99 | -5.97% | 50.18 | -0.11 | 3.19 / n/a |
| DAAR COMMUNICATIONS (DAARCOMM) | 1.06 | -4.50% | 53.96 | 0.00 | 1.05 / n/a |
| P Z CUSSONS NIGERIA (PZ) | 34.85 | -3.33% | 51.61 | -0.91 | 35.33 / n/a |
| NIGERIAN EXCHANGE GROUP (NGXGROUP) | 60.15 | -3.30% | 52.26 | -1.61 | 58.76 / n/a |
- Chelaram (CHELLARAM) is notable for both outsized daily gain and a 250%+ jump in volume—investors should watch for possible continuation moves.
- Insurance names show up on both gainers (REGALINS) and losers (MBENEFIT, LASACO) lists, reflecting speculative rotations within the sector.
📈 Momentum: Bullish & Bearish Signals
Bullish Momentum (Price > 15DMA)
| Symbol | Name | Price | % Chg | 15DMA | RSI | MACD |
|---|---|---|---|---|---|---|
| IMG | IND. & MED. GASES NIGERIA | 36.60 | +9.02% | 35.99 | 48.85 | -1.27 |
| TANTALIZER | TANTALIZERS PLC | 2.59 | +7.34% | 2.46 | 50.16 | -0.086 |
| STERLINGNG | STERLING FIN. HLDG CO. | 7.90 | +5.06% | 7.66 | n/a | n/a |
| FIDELITYBK | FIDELITY BANK | 21.05 | +1.90% | 20.96 | 51.31 | -0.26 |
| ZENITHBANK | ZENITH INT’L BANK | 68.00 | +1.47% | 67.08 | 51.12 | -1.79 |
| ACCESSCORP | Access Holdings | 26.80 | +1.31% | 26.50 | 51.55 | -0.43 |
Insight: Many banking names (ZENITHBANK, ACCESSCORP, FIDELITYBK) are above their 15DMA with constructive RSI/MACD, confirming the rotation into financials and ongoing sector strength.
Bearish Momentum (Price < 15DMA)
| Symbol | Name | Price | % Chg | 15DMA | RSI | MACD |
|---|---|---|---|---|---|---|
| NGXCNSMRGDS | NGX Consumer Goods Index | 3183.69 | -0.13% | 3185.50 | n/a | n/a |
| UNIVINSURE | UNIVERSAL INSURANCE CO | 1.23 | -1.63% | 1.24 | n/a | n/a |
| MBENEFIT | MUTUAL BENEFITS ASSURANCE | 3.90 | -8.46% | 3.96 | 56.73 | 0.28 |
| PZ | P Z CUSSONS NIGERIA | 34.85 | -3.44% | 35.33 | 51.61 | -0.91 |
| UCAP | UNITED CAPITAL | 18.90 | -3.17% | 18.91 | 51.31 | -0.26 |
| DANGCEM | DANGOTE CEMENT | 511.20 | -3.29% | 520.59 | 52.00 | -4.97 |
Insight: PZ and DANGCEM (index heavyweights) turned negative, confirming some drag from blue chips, justifying today's value turnover plunge.
🔎 Contrarian Signals
- MBENEFIT: Despite a strong RSI (56.7) and a positive MACD, its price fell sharply (-7.80%), and crossed under its 15DMA—may attract bargain hunters if sector sentiment reverses.
- PZ: Slides -3.33% today and meets bearish technicals, but with RSI holding above 50; this divergence could present a contrarian bounce trade soon.
- CHELLARAM: Explosive price and volume move (+9.92% and +250% volume), but its MACD is only slightly positive—further rally may need confirmation before chasing.
📊 Sector Heatmap
| Sector | Idx Return | Retail% | Institutional% | Bullish Count (15DMA) | Bearish Count (15DMA) |
|---|---|---|---|---|---|
| Banking | +1.2% | 39.9% | 60.1% | 3 | 0 |
| Consumer Goods | -0.1% | 55.1% | 44.9% | 0 | 2 |
| Industrial | -1.4% | 59.3% | 40.7% | 1 | 2 |
| Insurance | +6.5% | 49.8% | 50.2% | 1 | 2 |
| Diversified | Mixed | 54.3% | 45.7% | 1 | 1 |
- Banking sector continues to outperform, confirmed by technicals and institutional flows.
- Consumer & Industrial Goods under selling pressure; traders should use caution and tighten stops within these sectors.
📈 Dividend-Beta Matrix
| Symbol | Name | Dividend Yield | Beta | Momentum/Signal |
|---|---|---|---|---|
| FIDELITYBK | Fidelity Bank | 5.48% | 0.89 | Bullish |
| STERLINGNG | Sterling Fin. Hldgs | 3.19% | 1.41 | Bullish |
| ACCESSCORP | Access Holdings | 1.87% | 1.42 | Bullish |
| ZENITHBANK | Zenith Int'l Bank | 2.25% | 1.20 | Bullish |
| CAVERTON | Caverton Off. Spt | 5.52% | 0.98 | Bearish |
- Defensive yield plays: FIDELITYBK and ZENITHBANK combine above-average dividend yields with below-market beta and positive momentum—attractive for stability-minded investors.
- CAVERTON’s bearish crossover despite high yield and near-market beta suggests prudence.
🛑 Institutional Clustering Alerts
- ZENITHBANK dominates institutional flows (20.2% of trade value among top institutions). Other top names are ACCESSCORP, FIDELITYBK, ARADEL, and DANGCEM.
- Institutional activity remains clustered in banking blue chips and oil & gas, confirming sector leadership.
🌟 YTD Gainers & Losers Highlights (Momentum and Valuation)
| Top 5 YTD Gainers | ||||||
|---|---|---|---|---|---|---|
| Symbol | Name | YTD Gain | %Chg5Dys | RSI | Dividend | Bullish/Bearish |
| CHELLARAM | Chellarams | +259.46% | +26.67% | 56.60 | 1.99% | Bullish |
| REGALINS | Regency Alliance | +151.52% | +27.69% | 55.85 | 6.52% | Bullish |
| DAARCOMM | DAAR Communications | +55.88% | +12.77% | 53.96 | 0.0% | Mixed |
| CHAMS | Chams Plc | +47.73% | +15.66% | 54.76 | 1.56% | Bullish |
| LAFARGE WAPCO | WAPCO | +83.51% | +13.27% | 51.95 | 2.70% | Bullish |
| Top 5 YTD Losers | ||||||
|---|---|---|---|---|---|---|
| Symbol | Name | YTD Loss | %Chg5Dys | RSI | Dividend | Bullish/Bearish |
| MERGROWTH | Meristem Growth ETF | +5.17% | -10.00% | 42.52 | 0.00% | Bearish |
| MAYBAKER | May & Baker | +72.87% | -9.97% | 48.86 | 3.75% | Bearish |
| NEM | NEM Insurance | +134.17% | -9.94% | 50.25 | 6.52% | Bearish |
| UNIONDICON | Union Dicon Salt | +36.11% | -9.26% | 48.98 | 6.25% | Bearish |
| NSLTECH | Sec. Electronic Tech | +24.64% | -7.53% | 49.32 | 15.87% | Bearish |
- CHELLARAM stands out as both a leading YTD gainer and among today's top unusual volume and daily gainers—a classic high-momentum, high-risk profile.
- REGALINS, DAARCOMM, CHAMS all combine multi-day momentum and YTD leadership—momentum traders should continue to monitor for possible parabolic extensions.
- Some YTD "losers" (NEM, UNIONDICON) are still positive YTD but suffered sharp 5-day declines—watch for oversold bounces.
💡 Unusual Volume Callouts
- NSLTECH (Secure Electronic Technology): Traded 71.4M shares (>6x 90-day average), -2.27% today and -7.5% over 5 days—warrants a cautionary stance as technical and volume signals diverge.
- ARADEL: High volume (+485%), price up (+2.79%), yet signals possible distribution after the strong run. Existing holders should review conviction.
- CHELLARAM: Exceptional volume confirms strength of price move—potential for continuation, but risk of volatility is high.
🔑 Institutional vs Retail Activity & Top Flows
- Institutional investors accounted for 60.1% of volume and a massive 90.5% of trade value, despite only 36.4% of trade count. They are focused on large, liquid names (ZENITHBANK, ACCESSCORP, FIDELITYBK, ARADEL, DANGCEM).
- Retail activity remains broad, with MTNN, ZENITHBANK, ACCESSCORP, UBA, and GTCO most traded, but values trail institutions sharply, underlining retail risk preference for lower-priced stocks.
- Correlation: Banking names dominate both institutional and retail flow—sector remains the institutional "safe haven" and a retail "momentum zone."
| Investor Type | Top 5 Stocks by Trade Value | % of Trade Value |
|---|---|---|
| Institutional | ZENITHBANK, ACCESSCORP, FIDELITYBK, ARADEL, DANGCEM | ~45% |
| Retail | MTNN, ZENITHBANK, ACCESSCORP, UBA, GTCO | ~35% |
🕵️ Hidden Insights & Cautions
- Momentum Overlaps: Notable that daily and YTD gainers such as CHELLARAM and REGALINS also show up in unusual volume tables—these may present further upside, but also heightened volatility risk.
- High-Yield Defensive Stocks: FIDELITYBK, ZENITHBANK, and CAVERTON offer defensive plays—strong dividend yields and below-average beta—but only the first two exhibit clear bullish trends.
- Sector Divergence Signals: While the overall market is flat, sector rotation is evident—banks/banking indices stay bullish while consumer/industrial are underweight, as confirmed by technicals.
🚩 Trader Suggestions & Action Points
- Momentum Seekers: Consider stocks that appear on both top gainers and unusual volume tables (e.g., CHELLARAM, REGALINS) for short-term upside—but monitor for reversal signals closely.
- Yield Investors: Banking names with strong yields and positive momentum (FIDELITYBK, ZENITHBANK) offer both income and exposure to ongoing sector strength. Favor these over high-yield stocks with bearish momentum (e.g., CAVERTON).
- Bargain Hunters: Watch for technical reversals in sector laggards (PZ, DANGCEM); some oversold signals may manifest if RSI drops further and volume spikes.
- Risk Management: With market turnover falling amidst rising volume, upper-tier investors should beware of excessive retail speculation in penny stocks and avoid chasing parabolic moves. Use trailing stops on momentum positions.
📈 Final Takeaway
NGX closed the week with positive market breadth but a battle of rotation under the surface: stalwart institutional flows into banks, surging speculation—and risk—in smaller names. With divergent turnover and rising volumes, traders should distinguish between genuine momentum and crowded speculative trades. A sector-tilted approach—overweighting banking, underweighting consumer/industrials—remains prudent.
Disclaimer: This analysis is for informational purposes and not investment advice. Timely monitoring and additional research recommended.
|
Top ASI Gainers Over Last 5 Trading Days
|
Top ASI Losers Over Last 5 Trading Days
|
For more detailed analysis, on InfoWARE Market Data Terminal <NSEPERF> <GO>
On InfoWARE Finance Mobile App (Android, iPhone & iPad, Windows Phone and Windows 8/10), "Top Gainers & Losers"
REGENCY ALLIANCE INSURANCE COMPANY PLC (REGALINS) topped the advancers list closing at N1.66 with a gain of 9.93% followed by E-TRANZACT INTERNATIONAL PLC (ETRANZACT) which closed at N14.95 with a gain of 9.93%.
On the flip side MUTUAL BENEFITS ASSURANCE PLC. (MBENEFIT) and LASACO ASSURANCE PLC. (LASACO) topped the decliners log with a loss of -7.80% at a close of N3.90, and -5.97% to close the day at N2.99 respectively.
For more detailed analysis,
- On InfoWARE Market Data Terminal <TOPG> <GO>
- On InfoWARE Finance Mobile App ( Android, iPhone & iPad and Windows 10) , "Top Gainers & Losers"
Currency Market
In the currency market, the Naira appreciated 0.05%(0.76) against the Dollar to settle at 1 to 1Investment Insights - Top 5 Gainers YTD
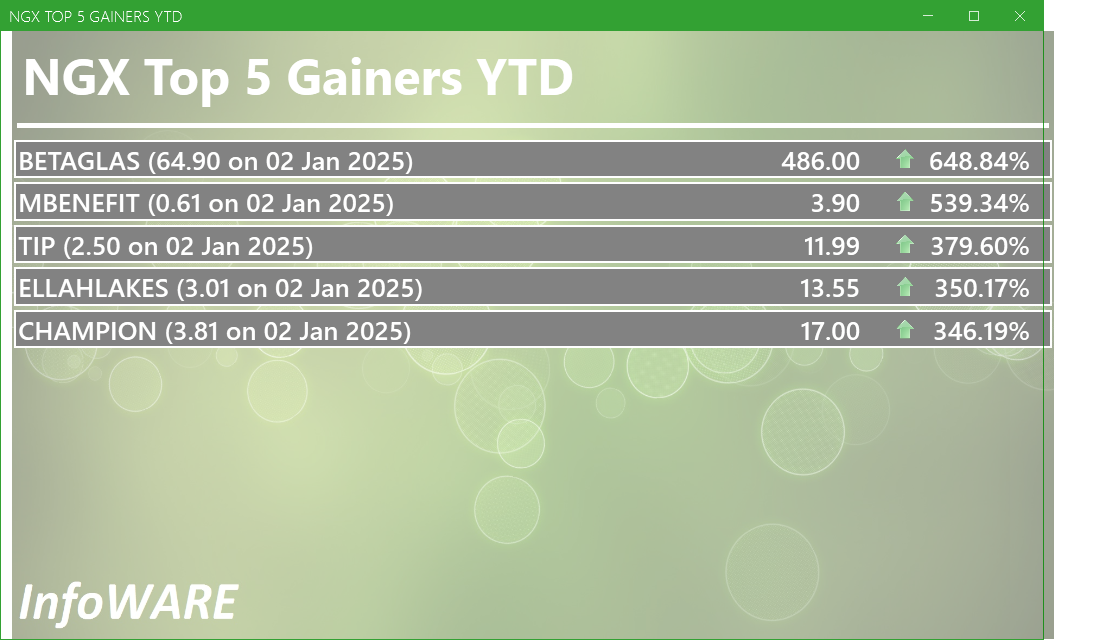
These stocks are the best performers whose price has risen faster than the market as a whole with the best returns year to date. Momentum investors believe that stocks that have outperformed the market will often continue to do so because the factors that caused them to outperform will not suddenly disappear. In addition, other investors seeking to benefit from the stock’s outperformance will often purchase the stock, further bidding its price higher and pushing the stock higher still
For more detailed analysis,
- On InfoWARE Market Data Terminal <T5YTD2> <GO>
- On InfoWARE Finance Mobile App ( Android , iPhone & iPad and Windows 10) , "Research"
NSE: Bull Signal - Price crossed above 15 Day MA
This signal implies these stocks are under buying pressure and the price might continue to rise and therefore positions should be monitored closely. Further suggested analysis include looking at the overall market (ASI) to see if the uptrend is market wide, sector wide or specific to the stock. Portfolio managers tend to use this as a signal to do more research to add to their positions or lock in some profits. Typically further analysis should be done using commands like PC and RV on the InfoWARE Market Data Terminal. Another command is ALERTS to set price triggers for possible exit or entry as necessary
For more detailed analysis,
- On InfoWARE Market Data Terminal <NSEPERF> <GO>
- On InfoWARE Finance Mobile App ( Android , iPhone & iPad and Windows 10) , "Top Gainers & Losers"
| Symbol | Price | %Chg | 15DMA | PE | EPS | DivY | MktCap | Vol | Trades | Value | LstTradeTime |
|---|---|---|---|---|---|---|---|---|---|---|---|
| FGS202778 | 100.00 | 70.00 | 48.67 | 0.00 | 0.00 | 500.00 | 1.00 | 500.00K | 12-Sep-2025 14:30:16.403 | ||
| FG162029S1 | 100.00 | 50.00 | 93.00 | 0.00 | 66.74B | 1.00 | 1.00 | 1.00K | 12-Sep-2025 14:30:15.563 | ||
| FGS202762 | 100.00 | 25.00 | 94.27 | 0.00 | 0.00 | 1.00 | 1.00 | 1.00K | 12-Sep-2025 14:30:16.317 | ||
| IMG | 36.60 | 9.02 | 35.99 | 59.72 | 0.64 | 1.32 | 18.28B | 128.36K | 21.00 | 4.68M | 12-Sep-2025 14:30:12.513 |
| TANTALIZER | 2.59 | 7.34 | 2.46 | 0.00 | 0.00 | 1.50 | 8.32B | 2.53M | 77.00 | 6.37M | 12-Sep-2025 14:30:13.497 |
| STERLINGNG | 7.90 | 5.06 | 7.66 | 15.75 | 0.30 | 3.19 | 227.44B | 37.15M | 265.00 | 279.02M | 12-Sep-2025 14:30:13.463 |
| ABBEYBDS | 6.80 | 4.41 | 6.57 | 0.00 | 0.00 | 1.43 | 69.05B | 152.04K | 42.00 | 1.04M | 12-Sep-2025 14:30:09.203 |
| CWG | 16.90 | 4.14 | 16.34 | 0.00 | 0.00 | 2.46 | 42.67B | 2.16M | 145.00 | 35.16M | 12-Sep-2025 14:30:12.000 |
| FIDELITYBK | 21.05 | 1.90 | 20.96 | 13.24 | 1.17 | 5.48 | 609.92B | 18.98M | 638.00 | 398.92M | 12-Sep-2025 14:30:12.280 |
| ZENITHBANK | 68.00 | 1.47 | 67.08 | 3.33 | 13.30 | 2.25 | 2,134.96B | 15.96M | 1,223.00 | 1.08B | 12-Sep-2025 14:30:27.647 |
| ACCESSCORP | 26.80 | 1.31 | 26.50 | 8.56 | 2.81 | 1.87 | 952.61B | 40.96M | 1,134.00 | 1.10B | 12-Sep-2025 14:30:29.080 |
| NGXBNK | 1,530.61 | 0.96 | 1,525.65 | 6.10 | 34.65 | 0.00 | 0.00 | 135.98M | 5,370.00 | 3.38B | 12-Sep-2025 14:30:16.877 |
| NGXAFRBVI | 3,576.80 | 0.96 | 3,545.97 | 3.14 | 35.50 | 0.00 | 0.00 | 68.19M | 4,519.00 | 2.86B | 12-Sep-2025 14:30:16.840 |
| NGXCG | 4,078.44 | 0.60 | 4,060.56 | 443.35 | 327.97 | 0.00 | 0.00 | 123.46M | 11,307.00 | 5.03B | 12-Sep-2025 14:30:16.890 |
| FGS202772 | 116.20 | 0.00 | 115.88 | 0.00 | 0.00 | 0.00 | 0.00 | 0.00 | 12-Sep-2025 14:30:16.370 | ||
| TIP | 11.99 | 0.00 | 11.97 | 0.00 | 10.67B | 693.43K | 114.00 | 8.32M | 12-Sep-2025 14:30:29.303 |
NSE: BEAR Signal - Price crossed below 15 Day MA
This signal implies these stocks are under selling pressure and the price might continue to slide and therefore positions should be monitored closely. Further suggested analysis include looking at the overall market (ASI) to see if the downtrend is market wide, sector wide or specific to the stock. If the overal market trend is upwards, then since these stocks are heading in the opposite direction, then further analysis should be done using commands like PC and RV on the InfoWARE Market Data Terminal. Another command is ALERTS to set price triggers for possible exit is necessar
For more detailed analysis,
- On InfoWARE Market Data Terminal <BEARM> <GO>
- On InfoWARE Finance Mobile App ( Android , iPhone & iPad and Windows 10)
| Symbol | Price | %Chg | 15DMA | PE | EPS | DivY | MktCap | Vol | Trades | Value | LstTradeTime |
|---|---|---|---|---|---|---|---|---|---|---|---|
| NGXCNSMRGDS | 3,183.69 | -0.13 | 3,185.50 | 30.19 | 55.24 | 0.00 | 0.00 | 14.49M | 3,074.00 | 829.34M | 12-Sep-2025 14:30:16.903 |
| NGXPREMIUM | 13,824.99 | -0.57 | 13,836.04 | 2,048.74 | 238.70 | 0.00 | 0.00 | 67.98M | 5,627.00 | 3.50B | 12-Sep-2025 14:30:17.077 |
| NGXINDUSTR | 4,926.35 | -1.41 | 4,944.39 | 39.90 | 18.97 | 0.00 | 0.00 | 6.27M | 1,896.00 | 890.24M | 12-Sep-2025 14:30:16.947 |
| UNIVINSURE | 1.23 | -1.63 | 1.24 | 0.00 | 0.00 | 0.00 | 19.68B | 7.65M | 155.00 | 9.31M | 12-Sep-2025 14:30:13.730 |
| NEWGOLD | 52,500.00 | -2.86 | 53,361.02 | 0.00 | 0.00 | 0.00 | 0.00 | 7.00 | 5.00 | 366.35K | 12-Sep-2025 14:30:27.420 |
| UCAP | 18.90 | -3.17 | 18.91 | 19.15 | 0.93 | 5.03 | 113.40B | 7.38M | 316.00 | 142.13M | 12-Sep-2025 14:30:13.660 |
| DANGCEM | 511.20 | -3.29 | 520.59 | 761.31 | 0.63 | 6.27 | 8,711.11B | 1.05M | 650.00 | 535.63M | 12-Sep-2025 14:30:27.517 |
| CAVERTON | 6.50 | -3.38 | 6.64 | 1.15 | 1.57 | 5.52 | 21.78B | 739.54K | 88.00 | 4.84M | 12-Sep-2025 14:30:09.583 |
| PZ | 34.85 | -3.44 | 35.33 | 44.17 | 0.50 | 4.59 | 138.37B | 4.11M | 231.00 | 138.03M | 12-Sep-2025 14:30:13.253 |
| MBENEFIT | 3.90 | -8.46 | 3.96 | 5.43 | 0.11 | 3.28 | 78.24B | 5.08M | 219.00 | 20.71M | 12-Sep-2025 14:30:27.147 |
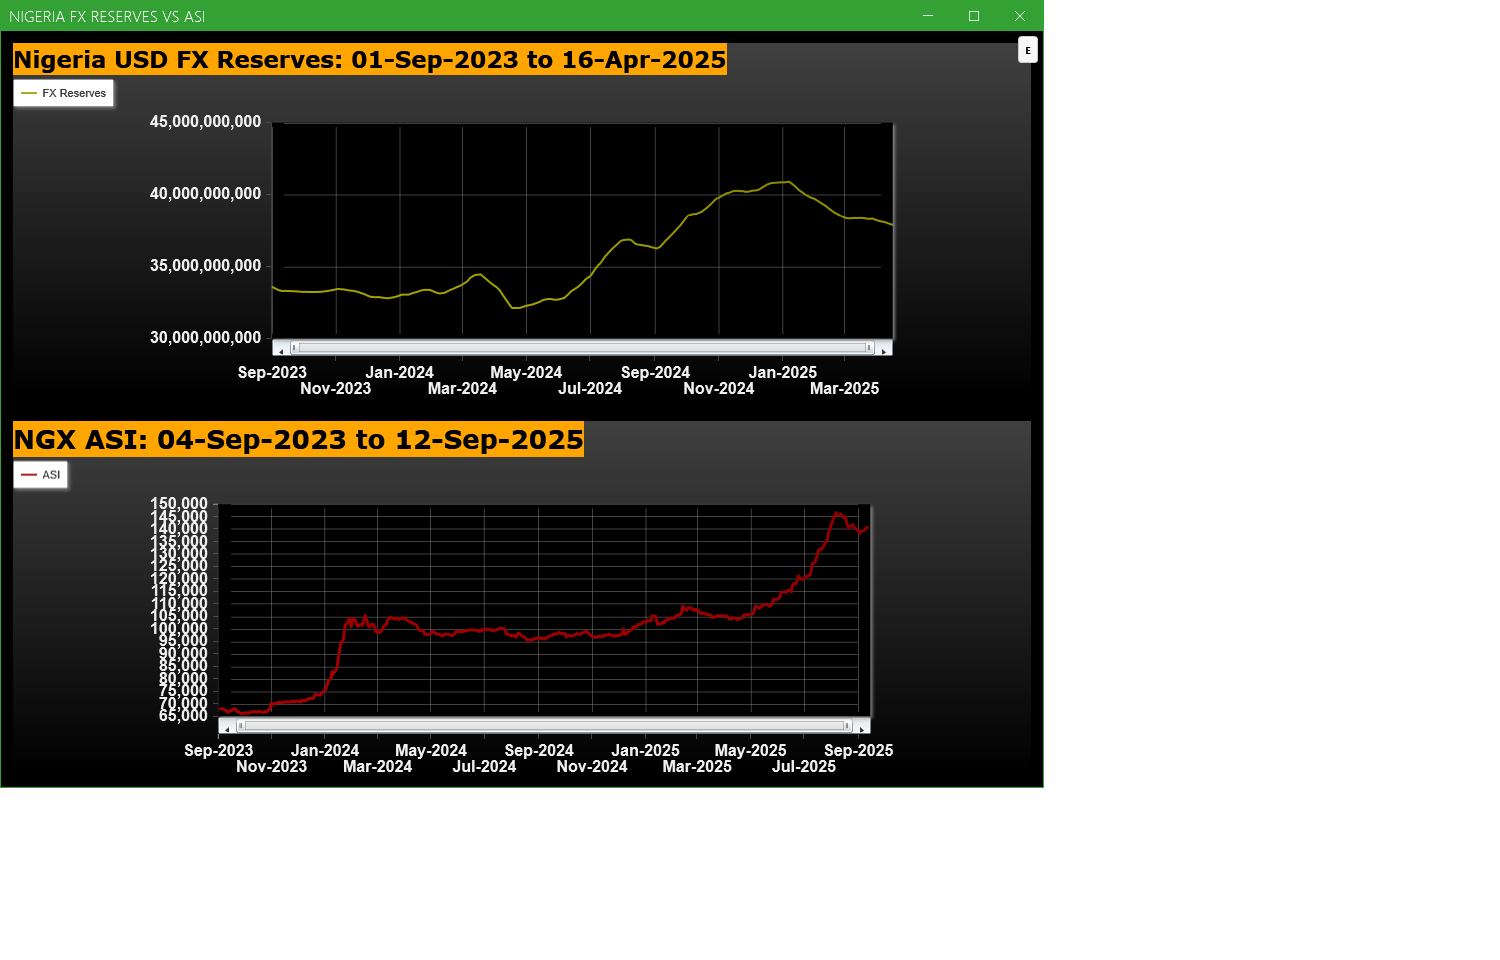
Economic Indicators - Nigeria FX Reserves Vs ASI Chart
Nigeria FX Reserves are assets held on reserve by CBN in foreign currencies. These reserves are used to back liabilities and influence monetary policy. Given the nature of the Nigeria economy, FX Reserves can appear to have an outsize influence on the economy and hence on the capital market. The chart below allows comparison of FX Reserves against the ASI to make investment decisions
For more detailed analysis,
- On InfoWARE Market Data Terminal <CI> <GO>
- On InfoWARE Finance Mobile App ( Android , iPhone & iPad and Windows 10) , "Research"
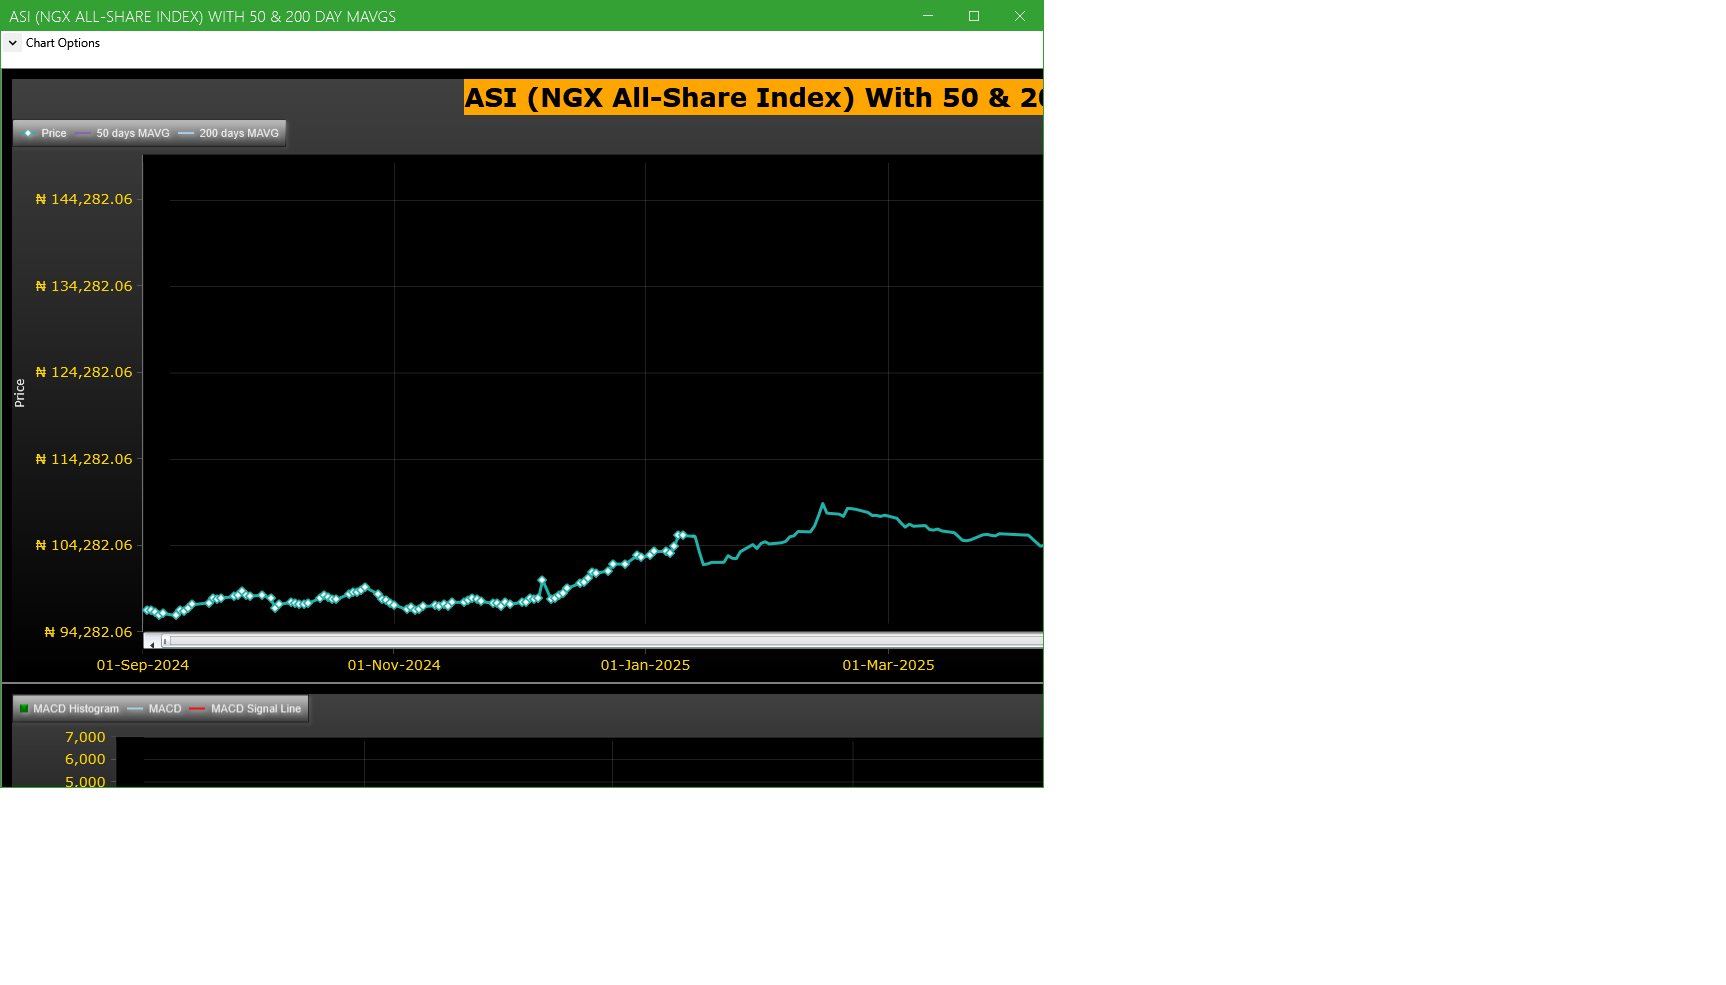
Market Trend - ASI (NGX All-Share-Index) With 50 & 200 Day MAvgs Chart
Technical traders typically use the 50 & 200 day moving averages to aid in choosing
where to enter or exit a position, which then causes these levels to act as strong
support or resistance. As a general guideline, if the price is above a moving average,
the trend is up. If the price is below a moving average, the trend is down.
It is important to note that critics of technical analysis say that moving averages act
as support and resistance because so many traders use these indicators to inform their
trading decisions. Also moving averages tend to work quite well in strong trending conditions
but poorly in choppy or ranging conditions.
Trading Strategies: Crossovers
Crossovers are one of the main moving average strategies. The first type is a price crossover,
which is when the price crosses above or below a moving average to signal a potential change
in trend. Another strategy is to apply two moving averages to a chart: one longer and one
shorter. When the shorter-term MA crosses above the longer-term MA, it is a buy signal, as
it indicates that the trend is shifting up. This is known as a golden cross. Meanwhile, when
the shorter-term MA crosses below the longer-term MA, it is a sell signal, as it indicates that
the trend is shifting down. This is known as a dead/death cross
For more detailed analysis,
- On InfoWARE Market Data Terminal <CI> <GO>
- On InfoWARE Finance Mobile App ( Android , iPhone & iPad and Windows 10) , "Research"
Unusual Volume: Volume traded is more than double the 90 day moving average (All exchanges; ASI & ASem). For more detailed analysis,
- On InfoWARE Market Data Terminal <UV> <GO>
- On InfoWARE Finance Mobile App ( Android , iPhone & iPad and Windows 10)
| Symbol | Name | Volume | 90DAvgVol | %VolChg | Price | LClose | %Chg | Trades | Value |
|---|---|---|---|---|---|---|---|---|---|
| NSLTECH | SECURE ELECTRONIC TECHNOLOGY PLC | 71.44M | 9.46M | 655.34 | 0.86 | 0.88 | -2.27 | 331 | 58.72M |
| ARADEL | ARADEL HOLDINGS PLC | 16.14M | 2.76M | 485.71 | 545.00 | 530.20 | 2.79 | 518 | 8.79B |
| UNIONDICON | UNION DICON SALT PLC. | 1.74M | 368.27K | 372.84 | 9.80 | 9.85 | -0.51 | 44 | 16.73M |
| LIVINGTRUST | LIVINGTRUST MORTGAGE BANK PLC | 298.28K | 106.15K | 180.99 | 4.62 | 4.62 | 0.00 | 19 | 1.46M |
| CHELLARAM | CHELLARAMS PLC. | 290.80K | 82.91K | 250.74 | 13.30 | 12.10 | 9.92 | 48 | 3.81M |
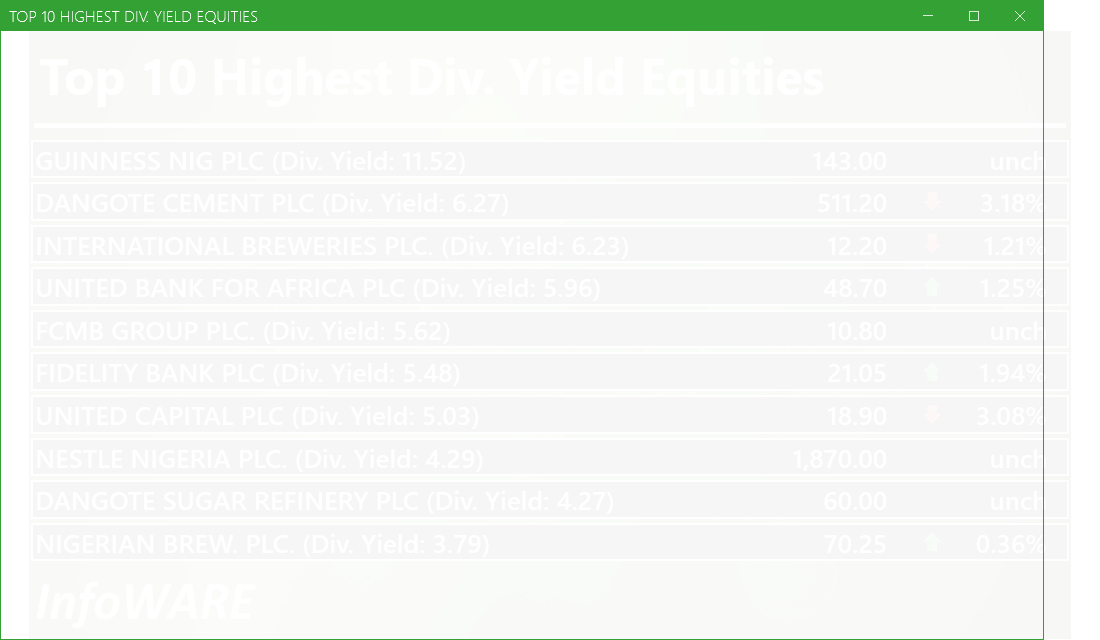
Investment Insights - High Div. Stocks
Dividend stocks distribute a portion of the company earnings to investors on a regular basis and they can a great choice for investors looking for regular income. As an investment or trading strategy, high dividend yield equities provide annual cash payments as against mostly capital gains in the price of a stock. The list in the table below represent the highest dividend paying stocks from the list of the most liquid stocks in the NSE top 30.
For more detailed analysis,
- On InfoWARE Market Data Terminal <HYIELD> <GO>
- On InfoWARE Finance Mobile App ( Android , iPhone & iPad and Windows 10) , "Research"
Investment Insights - Stocks outperforming the ASI but with approximately the same risk
These list of stocks represent equities that are less risky than the ASI but doing better than the ASI (All Shares Index) using the YTD (Year to Date) returns as the measure. The risk is measured by Beta. Beta is an assessment of a stock's tendency to undergo price changes, (its volatility), as well as its potential returns compared to the ASI. It is expressed as a ratio, where a score of 1 represents performance comparable to the ASI, and returns above or below the market may receive scores greater or lower than 1.
For a full list of both positively and negatively corelated stocks visit InfoWARE Market Data Terminal
- On InfoWARE Market Data Terminal <BANL> <GO>
- On InfoWARE Finance Mobile App ( Android , iPhone & iPad and Windows 10)
| Symbol | DivYield | PE | EPS | Beta | %ChgYTD | ASIYTDReturn | BetaDiff |
|---|---|---|---|---|---|---|---|
| HONYFLOUR | 1.40 | 16.28 | 0.31 | 0.99 | 232.37 | 36.21 | 0.01 |
| CAVERTON | 5.52 | 1.15 | 1.57 | 0.98 | 154.90 | 36.21 | 0.02 |
| ROYALEX | 7.81 | 0.00 | 0.00 | 0.96 | 109.09 | 36.21 | 0.04 |
| CORNERST | 5.28 | 8.62 | 0.35 | 0.93 | 85.10 | 36.21 | 0.07 |
| DEAPCAP | 13.76 | 188.84 | 0.01 | 0.89 | 55.83 | 36.21 | 0.11 |
| VERITASKAP | 4.17 | 48.77 | 0.02 | 0.88 | 47.65 | 36.21 | 0.12 |
| UNIVINSURE | 0.00 | 0.00 | 0.00 | 0.83 | 70.83 | 36.21 | 0.17 |
| FTNCOCOA | 1.60 | 0.00 | 0.00 | 0.79 | 229.79 | 36.21 | 0.21 |
| NB | 3.79 | 16.95 | 1.60 | 0.79 | 119.53 | 36.21 | 0.21 |
| MAYBAKER | 3.75 | 58.94 | 0.14 | 0.78 | 72.87 | 36.21 | 0.22 |
African Markets
| Name | LClose | Change | %Chg |
|---|---|---|---|
| BRVM Stock Exchange | 321.29 | 0.48 | 0.15 |
| Botswana Stock Exchange | 10,615.45 | 0.00 | 0.00 |
| Egyptian Exchange | 34,937.44 | 266.96 | 0.77 |
| Ghana Stock Exchange | 7,196.58 | 0.00 | 0.00 |
| Johannesburg Stock Exchange | 103,927.38 | 341.83 | 0.33 |
| Lusaka Stock Exchange | 24,645.74 | 66.36 | 0.27 |
| Casablanca Stock Exchange | 19,873.73 | 31.75 | 0.16 |
| Malawi Stock Exchange | 550,143.68 | -165.09 | -0.03 |
| Nigeria Stock Exchange | 140,665.84 | 294.78 | 0.21 |
| Nairobi Securities Exchange | 178.82 | 0.04 | 0.02 |
| Namibian Stock Exchange | 1,889.61 | 22.22 | 1.19 |
| Rwanda Stock Exchange | 178.91 | 0.00 | 0.00 |
| Tunis Stock Exchange | 12,019.40 | 89.47 | 0.75 |
| Uganda Securities Exchange | 1,441.64 | 8.74 | 0.61 |
Nigeria Market Indexes
| Symbol | LClose | %Chg | WTD% | MTD% | QTD% | YTD% | MktCap | Trades |
|---|---|---|---|---|---|---|---|---|
| ASI | 140,545.69 | -0.09 | 0.83 | 0.59 | 17.37 | 36.21 | 22,228 | |
| NGX30 | 5,120.44 | -0.12 | 0.75 | 0.46 | 8.40 | 34.22 | 11,795 | |
| NGXAFRBVI | 3,576.80 | 0.97 | 2.58 | 2.62 | 0.94 | 44.18 | 4,519 | |
| NGXAFRHDYI | 22,765.58 | 0.23 | 2.00 | 1.04 | 8.85 | 33.70 | 5,285 | |
| NGXASEM | 1,538.10 | 0.00 | 0.00 | 0.00 | -3.57 | -2.88 | 11 | |
| NGXBNK | 1,530.61 | 0.97 | 2.21 | 1.27 | 1.31 | 40.76 | 5,370 | |
| NGXCG | 4,078.44 | 0.61 | 2.01 | 1.08 | 18.60 | 44.15 | 11,307 | |
| NGXCNSMRGDS | 3,183.69 | -0.13 | 0.38 | -0.19 | -8.22 | 83.57 | 3,074 | |
| NGXCOMMDTY | 1,096.48 | 0.49 | 1.12 | 2.66 | 4.70 | 9.65 | ||
| NGXGROWTH | 12,366.55 | 0.77 | 10.25 | 10.41 | 30.05 | 59.30 | 236 | |
| NGXINDUSTR | 4,926.35 | -1.39 | 1.12 | -0.12 | 39.84 | 37.93 | 1,896 | |
| NGXINS | 1,310.28 | -0.62 | -0.70 | 2.13 | 77.40 | 66.66 | 2,024 | |
| NGXLOTUSISLM | 11,578.69 | -0.13 | 2.08 | 1.40 | 20.93 | 66.17 | 4,208 | |
| NGXMAINBOARD | 6,830.77 | 0.17 | 0.61 | 0.64 | 15.80 | 36.51 | 16,365 | |
| NGXMERIGRW | 9,994.23 | 0.08 | 0.84 | -0.20 | 3.54 | 53.21 | 3,145 | |
| NGXMERIVAL | 13,740.54 | 0.88 | 3.19 | 2.77 | 15.01 | 31.74 | 5,894 | |
| NGXOILGAS | 2,419.33 | 0.98 | 2.38 | 2.05 | 1.14 | -10.76 | 296 | |
| NGXPENBRD | 2,608.41 | -0.06 | 0.88 | 0.70 | 13.44 | 42.41 | 17,922 | |
| NGXPENSION | 6,696.86 | 0.53 | 1.73 | 1.16 | 5.39 | 47.70 | 13,294 | |
| NGXPREMIUM | 13,824.99 | -0.57 | 1.21 | 0.46 | 20.53 | 42.04 | 5,627 | |
| NGXSOVBND | 655.70 | 2.09 | 0.09 | -0.48 | 0.34 | 9.00 | 1 |
For more detailed analysis,
- On InfoWARE Market Data Terminal <MKTINS> <GO>
- On InfoWARE Finance Mobile App ( Android, iPhone & iPad and Windows 10) , "Market Indexes"
Find the topic interesting? Will like to comment? Contact Us at solutions@infowarelimited.com
Top News

InfoWARE AI Analyst Weekly Market Report: 12-Sep-2025
Chart Of The Day - ASI Chart Vs ASI Advance Decline Line (YTD) (12-Sep-2025 15:10:12.694)
InfoWARE AI Analyst Daily Market Report: 12-Sep-2025

[MERGROWTH]>> DAILY INDICATIVE PRICES
[VETINDETF]>> DAILY INDICATIVE PRICES
[XNSA]>> NGX FIXED INCOME INDICATIVE PRICE LIST FOR SEP 12, 2025
[XNSA]>> REGISTRATION FOR BATCH TWO- 2025 DEALING CLERKSHIP CERTIFICATION PROGRA
[XNSA]>> UPDATED- SAVE THE DATE: 29TH ANNUAL STOCKBROKERS CONFERENCE
[XNSA]>> CLOSING GONG CEREMONY IN HONOUR OF ISSB DELEGATION
[SIAMLETF40]>> DAILY INDICATIVE PRICES
[XNSA]>> DAILY FUND PRICE SUBMISSION - FCMB ASSET MANAGEMENT LIMITED
Chart Of The Day - ASI Chart Vs ASI Advance Decline Line (YTD) (11-Sep-2025 15:07:38.943)
InfoWARE AI Analyst Daily Market Report: 11-Sep-2025
[XNSA]>> CORDROS MILESTONE FUNDS' BID & OFFER PRICES
[MERVALUE]>> DAILY INDICATIVE PRICES
[VETGOODS]>> DAILY INDICATIVE PRICES
[XNSA]>> DAILY FUND PRICE SUBMISSION - FCMB ASSET MANAGEMENT LIMITED
[XNSA]>> REGISTRATION FOR BATCH TWO- 2025 DEALING CLERKSHIP CERTIFICATION PROGRA
[SIAMLETF40]>> DAILY INDICATIVE PRICES
[XNSA]>> UPDATED- SAVE THE DATE: 29TH ANNUAL STOCKBROKERS CONFERENCE
[XNSA]>> CLOSING GONG CEREMONY IN HONOUR OF ISSB DELEGATION
Chart Of The Day - ASI Chart Vs ASI Advance Decline Line (YTD) (10-Sep-2025 15:11:27.842)
InfoWARE AI Analyst Daily Market Report: 10-Sep-2025
[XNSA]>> DAILY FUND PRICE SUBMISSION - FCMB ASSET MANAGEMENT LIMITED
[VETGOODS]>> DAILY INDICATIVE PRICES
[XNSA]>> NGX FIXED INCOME INDICATIVE PRICE LIST FOR SEP 10, 2025
[XNSA]>> CLOSING GONG CEREMONY AND FACTS BEHIND THE FIGURES BY DANGOTE CEMENT
[XNSA]>> REGISTRATION FOR BATCH TWO- 2025 DEALING CLERKSHIP CERTIFICATION PROGRA
[XNSA]>> UPDATED- SAVE THE DATE: 29TH ANNUAL STOCKBROKERS CONFERENCE
[XNSA]>> CLOSING GONG CEREMONY IN HONOUR OF ISSB DELEGATION
Get IDIA - the stock trading app for the modern investor
Solutions by Business
Product Suites
Company
Contacts
- 8th Floor,
- South Atlantic Petroleum Towers,
- 1 Adeola Odeku Street,
- Victoria Island,
- Lagos, Nigeria.
- Email: solutions@infowarelimited.com
Follow Us
 |
 |
 |
 |