


InfoWARE AI Analyst Daily Market Report: 10-Mar-2025 | InfoWARE Finance
Get IDIA - the stock trading app for the modern investor


InfoWARE AI Analyst Daily Market Report: 10-Mar-2025
(Source: InfoWARE Terminal, Date: 10-Mar-2025)
Dear Investor,
Welcome to today's market summary for the Nigerian Stock Exchange (NGX) on March 10, 2025. The NGX ASI (All Share Index) experienced a slight uptick of 0.08%, closing at 106,538.60, with year-to-date returns now at 3.34%. Today's trading volume increased to 354.99 million shares, reflecting a significant rise in market turnover, which surged by 82.66% to 17.20 billion Naira. Market breadth was positive, with 36 advancers outpacing 30 decliners, indicating a healthy interest in equities.
- Market Breadth: The market breadth stood at 1.20x, with 36 advancers and 30 decliners, suggesting a bullish sentiment among investors.
- Top Gainers:
- ETERNA PLC (ETERNA): Closed at 37.55, up 9.96%
- TRANSNATIONAL CORPORATION OF NIGERIA PLC (TRANSCORP): Closed at 51.55, up 9.91%
- FCMB GROUP PLC (FCMB): Closed at 10, up 9.89%
- AFRICA PRUDENTIAL REGISTRARS PLC (AFRIPRUD): Closed at 36.25, up 9.85%
- ASSOCIATED BUS COMPANY PLC (ABCTRANS): Closed at 1.63, up 8.67%
- Top Losers:
- STANBIC IBTC ETF 30 (STANBICETF30): Closed at 396, down -9.99%
- VFD GROUP PLC (VFDGROUP): Closed at 47.2, down -9.92%
- INTERNATIONAL ENERGY INSURANCE COMPANY PLC (INTENEGINS): Closed at 1.78, down -8.72%
- NEWGOLD EXCHANGE TRADED FUND (ETF): Closed at 39000.01, down -8.66%
- CADBURY NIGERIA PLC (CADBURY): Closed at 23, down -8.00%
Insights and Predictions
- Turnover Increase: The significant increase in market turnover by 82.66% suggests heightened investor activity, potentially indicating bullish sentiment.
- Advancing vs. Declining Stocks: The ratio of advancing to declining stocks (1.20x) reflects a positive market sentiment, which could lead to further upward momentum if sustained.
- Unusual Volume Movements: Stocks like AFRIPRUD and FIDELITYBK showed unusual trading volumes, indicating strong investor interest that could lead to price adjustments.
- YTD Trends: Notably, stocks like AFRIPRUD have shown strong performance year-to-date, with a YTD change of 60.40%, suggesting continued bullish momentum.
Contrarian Signals
CHAMPION BREW. PLC. (CHAMPION) presents a conflicting indicator with an RSI of 54.4 and a bullish MACD, despite a YTD decline of -9.8%. This could indicate a potential reversal or a buying opportunity for contrarian investors.
Sector Heatmaps
| Sector | Performance | Institutional Activity | Retail Activity |
|---|---|---|---|
| Banking | +1.5% | High | Moderate |
| Food Products | +2.0% | Moderate | High |
| Insurance | -1.0% | Low | Low |
Dividend-Beta Matrix
| Stock | Dividend Yield | Beta |
|---|---|---|
| AFRIPRUD | 1.27% | 0.64 |
| CADBURY | 0.64% | 0.64 |
Institutional Clustering Alerts
ZENITHBANK has seen a significant institutional trade value share of 20.17%, indicating strong institutional interest that could drive future price movements.
High Dividend Yield Stocks
AFRIPRUD, with a dividend yield of 1.27%, is also showing bullish momentum, making it a potential defensive play for investors seeking income and growth.
Suggestions for Traders
- Monitor stocks with unusual volume for potential breakout opportunities.
- Consider taking positions in stocks like AFRIPRUD that show both strong YTD performance and bullish momentum indicators.
- Be cautious with stocks showing bearish momentum, particularly those with declining RSI and MACD signals.
|
Top ASI Gainers Over Last 5 Trading Days
|
Top ASI Losers Over Last 5 Trading Days
|
For more detailed analysis, on InfoWARE Market Data Terminal <NSEPERF> <GO>
On InfoWARE Finance Mobile App (Android, iPhone & iPad, Windows Phone and Windows 8/10), "Top Gainers & Losers"
ETERNA PLC. (ETERNA) topped the advancers list closing at N37.55 with a gain of 9.96% followed by TRANSNATIONAL CORPORATION OF NIGERIA PLC (TRANSCORP) which closed at N51.55 with a gain of 9.91%.
On the flip side STANBIC IBTC ETF 30 (STANBICETF30) and VFD GROUP PLC (VFDGROUP) topped the decliners log with a loss of -10.00% at a close of N396.00, and -9.92% to close the day at N47.20 respectively.
| Symbol | LClose | %Chg |
|---|---|---|
| ETERNA | 37.55 | 9.96 |
| TRANSCORP | 51.55 | 9.91 |
| FCMB | 10.00 | 9.89 |
| AFRIPRUD | 36.25 | 9.85 |
| ABCTRANS | 1.63 | 8.67 |
| Symbol | LClose | %Chg |
|---|---|---|
| STANBICETF30 | 396.00 | -10.00 |
| VFDGROUP | 47.20 | -9.92 |
| INTENEGINS | 1.78 | -8.72 |
| NEWGOLD | 39,000.01 | -8.66 |
| CADBURY | 23.00 | -8.00 |
For more detailed analysis,
- On InfoWARE Market Data Terminal <TOPG> <GO>
- On InfoWARE Finance Mobile App ( Android, iPhone & iPad and Windows 10) , "Top Gainers & Losers"
Currency Market
In the currency market, the Naira fell 0.53%(-7.93) against the Dollar to settle at 1 to 1Investment Insights - Top 5 Gainers YTD
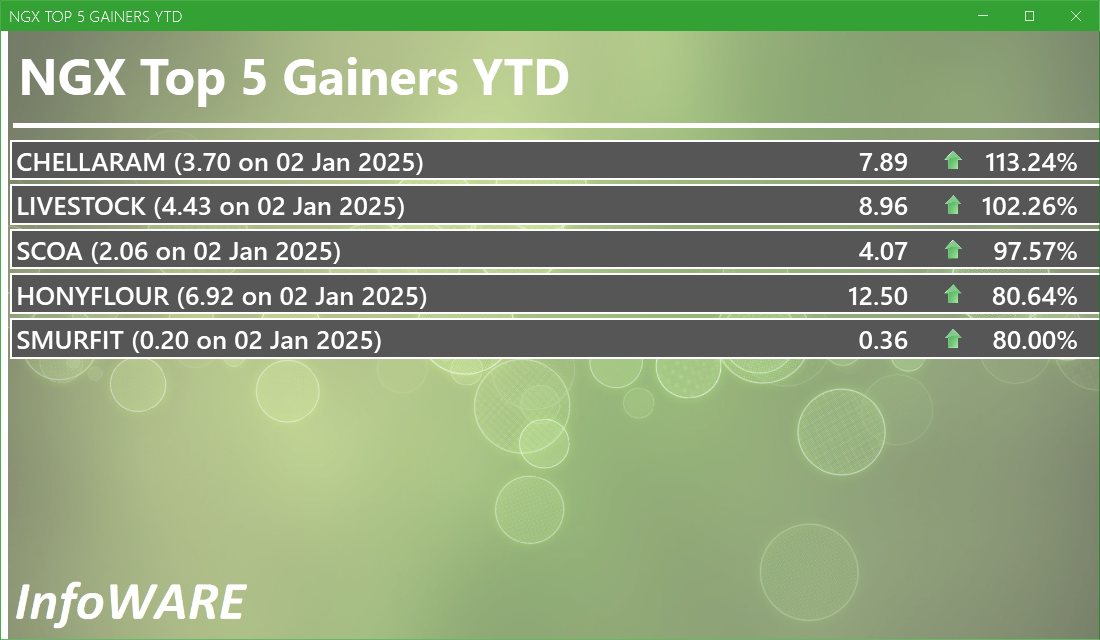
These stocks are the best performers whose price has risen faster than the market as a whole with the best returns year to date. Momentum investors believe that stocks that have outperformed the market will often continue to do so because the factors that caused them to outperform will not suddenly disappear. In addition, other investors seeking to benefit from the stock’s outperformance will often purchase the stock, further bidding its price higher and pushing the stock higher still
For more detailed analysis,
- On InfoWARE Market Data Terminal <T5YTD2> <GO>
- On InfoWARE Finance Mobile App ( Android , iPhone & iPad and Windows 10) , "Research"
NSE: Bull Signal - Price crossed above 15 Day MA
This signal implies these stocks are under buying pressure and the price might continue to rise and therefore positions should be monitored closely. Further suggested analysis include looking at the overall market (ASI) to see if the uptrend is market wide, sector wide or specific to the stock. Portfolio managers tend to use this as a signal to do more research to add to their positions or lock in some profits. Typically further analysis should be done using commands like PC and RV on the InfoWARE Market Data Terminal. Another command is ALERTS to set price triggers for possible exit or entry as necessary
For more detailed analysis,
- On InfoWARE Market Data Terminal <NSEPERF> <GO>
- On InfoWARE Finance Mobile App ( Android , iPhone & iPad and Windows 10) , "Top Gainers & Losers"
| Symbol | Price | %Chg | 15DMA | PE | EPS | DivY | MktCap | Vol | Trades | Value | LstTradeTime |
|---|---|---|---|---|---|---|---|---|---|---|---|
| FGSUK2032S5 | 108.95 | 8.21 | 100.51 | 0.00 | 0.00 | 30.00 | 1.00 | 32.68K | 10-Mar-2025 14:30:22.600 | ||
| DANGSUGAR | 40.00 | 7.50 | 38.73 | 11.48 | 3.06 | 4.27 | 485.88B | 6.61M | 417.00 | 264.06M | 10-Mar-2025 14:30:14.253 |
| FGS202768 | 100.00 | 2.00 | 99.33 | 0.00 | 0.00 | 1.00 | 1.00 | 1.00K | 10-Mar-2025 14:30:22.167 |
NSE: BEAR Signal - Price crossed below 15 Day MA
This signal implies these stocks are under selling pressure and the price might continue to slide and therefore positions should be monitored closely. Further suggested analysis include looking at the overall market (ASI) to see if the downtrend is market wide, sector wide or specific to the stock. If the overal market trend is upwards, then since these stocks are heading in the opposite direction, then further analysis should be done using commands like PC and RV on the InfoWARE Market Data Terminal. Another command is ALERTS to set price triggers for possible exit is necessar
For more detailed analysis,
- On InfoWARE Market Data Terminal <BEARM> <GO>
- On InfoWARE Finance Mobile App ( Android , iPhone & iPad and Windows 10)
| Symbol | Price | %Chg | 15DMA | PE | EPS | DivY | MktCap | Vol | Trades | Value | LstTradeTime |
|---|---|---|---|---|---|---|---|---|---|---|---|
| NGXOILGAS | 2,545.45 | -0.45 | 2,551.31 | 8.74 | 228.15 | 0.00 | 0.00 | 1.49M | 395.00 | 319.34M | 10-Mar-2025 14:30:23.667 |
| VETGRIF30 | 40.10 | -2.24 | 40.19 | 0.00 | 0.00 | 1.50K | 2.00 | 60.15K | 10-Mar-2025 14:30:52.423 | ||
| FIRSTHOLDCO | 28.50 | -2.81 | 28.89 | 0.00 | 0.00 | 3.67M | 271.00 | 105.98M | 10-Mar-2025 14:30:52.540 | ||
| CHAMPION | 3.85 | -3.64 | 3.96 | 412.83 | 0.01 | 0.41 | 30.14B | 1.70M | 43.00 | 6.55M | 10-Mar-2025 14:30:13.970 |
| HONYFLOUR | 12.50 | -7.60 | 12.67 | 16.28 | 0.31 | 1.40 | 99.13B | 4.53M | 292.00 | 57.26M | 10-Mar-2025 14:30:14.960 |
| NEWGOLD | 39,000.01 | -9.48 | 41,032.88 | 0.00 | 0.00 | 0.00 | 0.00 | 5.00 | 2.00 | 203.00K | 10-Mar-2025 14:30:52.370 |
| STANBICETF30 | 396.00 | -11.11 | 419.76 | 0.00 | 0.00 | 41.00 | 8.00 | 17.42K | 10-Mar-2025 14:30:52.390 |
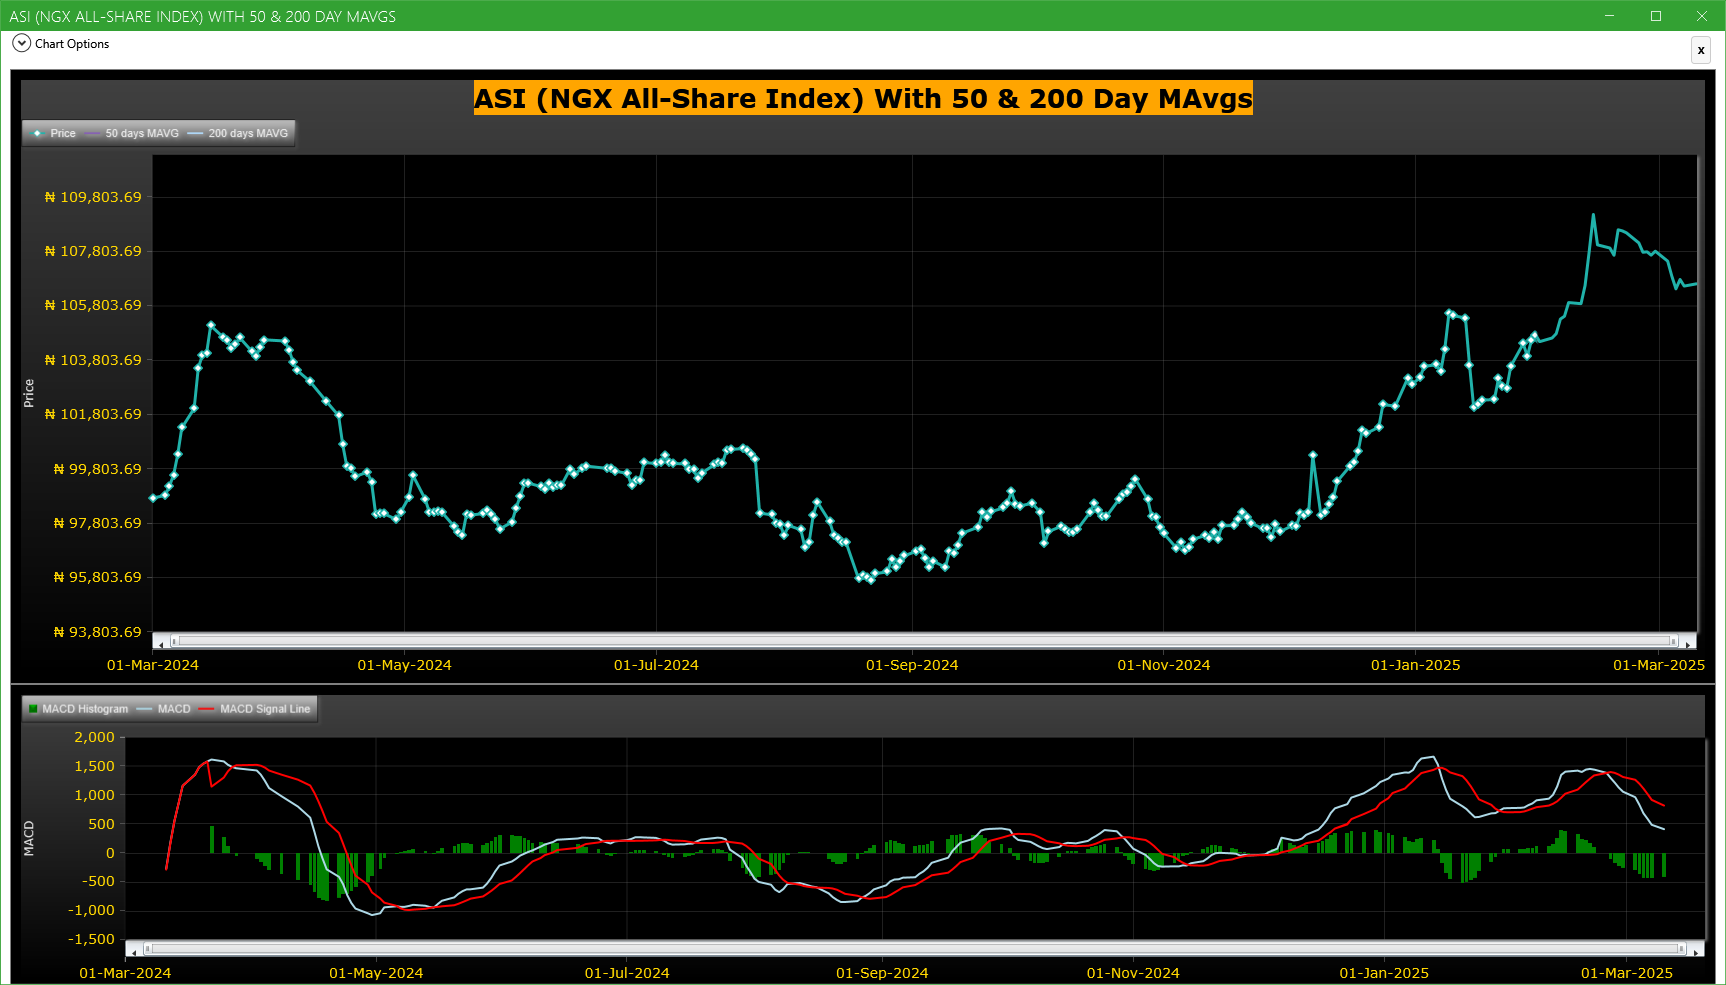
Market Trend - ASI (NGX All-Share-Index) With 50 & 200 Day MAvgs Chart
Technical traders typically use the 50 & 200 day moving averages to aid in choosing
where to enter or exit a position, which then causes these levels to act as strong
support or resistance. As a general guideline, if the price is above a moving average,
the trend is up. If the price is below a moving average, the trend is down.
It is important to note that critics of technical analysis say that moving averages act
as support and resistance because so many traders use these indicators to inform their
trading decisions. Also moving averages tend to work quite well in strong trending conditions
but poorly in choppy or ranging conditions.
Trading Strategies: Crossovers
Crossovers are one of the main moving average strategies. The first type is a price crossover,
which is when the price crosses above or below a moving average to signal a potential change
in trend. Another strategy is to apply two moving averages to a chart: one longer and one
shorter. When the shorter-term MA crosses above the longer-term MA, it is a buy signal, as
it indicates that the trend is shifting up. This is known as a golden cross. Meanwhile, when
the shorter-term MA crosses below the longer-term MA, it is a sell signal, as it indicates that
the trend is shifting down. This is known as a dead/death cross
For more detailed analysis,
- On InfoWARE Market Data Terminal <CI> <GO>
- On InfoWARE Finance Mobile App ( Android , iPhone & iPad and Windows 10) , "Research"
Unusual Volume: Volume traded is more than double the 90 day moving average (All exchanges; ASI & ASem). For more detailed analysis,
- On InfoWARE Market Data Terminal <UV> <GO>
- On InfoWARE Finance Mobile App ( Android , iPhone & iPad and Windows 10)
| Symbol | Name | Volume | 90DAvgVol | %VolChg | Price | LClose | %Chg | Trades | Value |
|---|---|---|---|---|---|---|---|---|---|
| FIDELITYBK | FIDELITY BANK PLC | 56.41M | 15.99M | 252.89 | 17.50 | 17.25 | 1.45 | 568 | 970.85M |
| AFRIPRUD | AFRICA PRUDENTIAL REGISTRARS PLC | 23.32M | 3.43M | 580.06 | 36.25 | 33.00 | 9.85 | 688 | 834.20M |
| GEREGU | GEREGU Power PLC | 9.13M | 695.44K | 1,212.24 | 1,150.00 | 1,150.00 | 0.00 | 135 | 9.45B |
| DANGSUGAR | DANGOTE SUGAR REFINERY PLC | 6.61M | 2.68M | 146.25 | 40.00 | 37.00 | 8.11 | 417 | 264.06M |
| CUSTODIAN | CUSTODIAN AND ALLIED PLC | 3.30M | 1.37M | 141.99 | 19.85 | 19.90 | -0.25 | 85 | 63.17M |
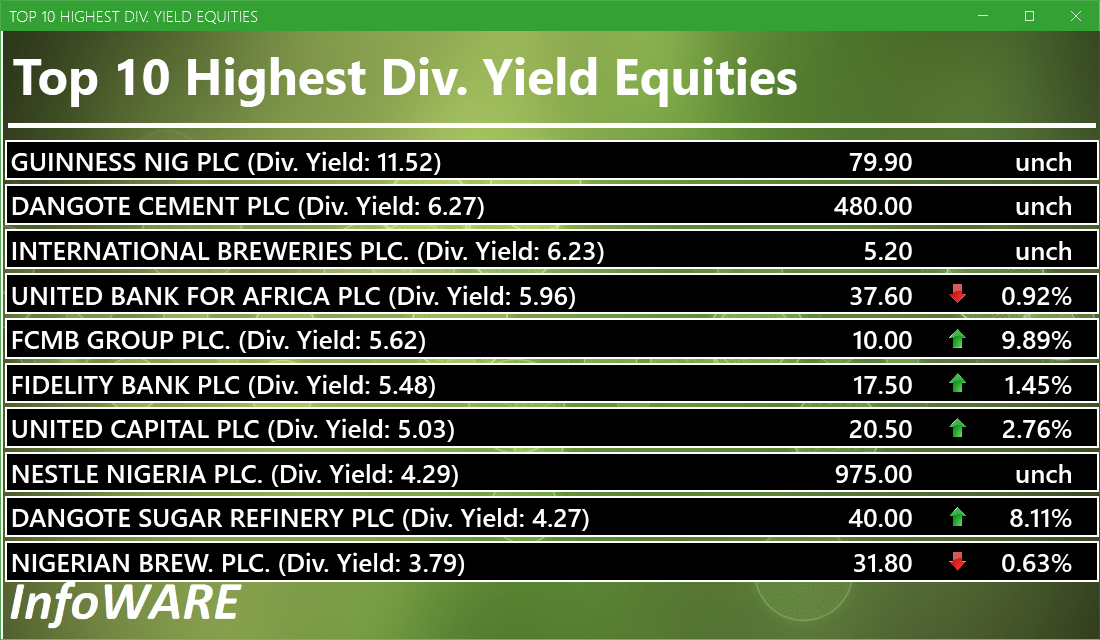
Investment Insights - High Div. Stocks
Dividend stocks distribute a portion of the company earnings to investors on a regular basis and they can a great choice for investors looking for regular income. As an investment or trading strategy, high dividend yield equities provide annual cash payments as against mostly capital gains in the price of a stock. The list in the table below represent the highest dividend paying stocks from the list of the most liquid stocks in the NSE top 30.
For more detailed analysis,
- On InfoWARE Market Data Terminal <HYIELD> <GO>
- On InfoWARE Finance Mobile App ( Android , iPhone & iPad and Windows 10) , "Research"
Investment Insights - Stocks outperforming the ASI but with approximately the same risk
These list of stocks represent equities that are less risky than the ASI but doing better than the ASI (All Shares Index) using the YTD (Year to Date) returns as the measure. The risk is measured by Beta. Beta is an assessment of a stock's tendency to undergo price changes, (its volatility), as well as its potential returns compared to the ASI. It is expressed as a ratio, where a score of 1 represents performance comparable to the ASI, and returns above or below the market may receive scores greater or lower than 1.
For a full list of both positively and negatively corelated stocks visit InfoWARE Market Data Terminal
- On InfoWARE Market Data Terminal <BANL> <GO>
- On InfoWARE Finance Mobile App ( Android , iPhone & iPad and Windows 10)
| Symbol | DivYield | PE | EPS | Beta | %ChgYTD | ASIYTDReturn | BetaDiff |
|---|---|---|---|---|---|---|---|
| HONYFLOUR | 1.40 | 16.28 | 0.31 | 0.99 | 80.64 | 3.34 | 0.01 |
| CAVERTON | 5.52 | 1.15 | 1.57 | 0.98 | 10.20 | 3.34 | 0.02 |
| UNILEVER | 2.81 | 67.09 | 0.40 | 0.75 | 11.11 | 3.34 | 0.25 |
| HMCALL | 0.00 | 0.00 | 0.00 | -0.74 | 20.53 | 3.34 | 0.26 |
| VETGOODS | 0.00 | 0.71 | 13.08 | 3.34 | 0.29 | ||
| VETGRIF30 | 0.00 | 0.71 | 6.23 | 3.34 | 0.29 | ||
| ABBEYBDS | 1.43 | 0.00 | 0.00 | 0.70 | 20.00 | 3.34 | 0.30 |
| NEM | 6.52 | 24.99 | 0.37 | 0.69 | 16.67 | 3.34 | 0.31 |
| TANTALIZER | 1.50 | 0.00 | 0.00 | 0.69 | 22.22 | 3.34 | 0.31 |
| NAHCO | 6.66 | 92.98 | 0.41 | 0.65 | 31.25 | 3.34 | 0.35 |
African Markets
| Name | LClose | Change | %Chg |
|---|---|---|---|
| BRVM Stock Exchange | 293.14 | 0.50 | 0.17 |
| Botswana Stock Exchange | 10,112.31 | 0.00 | 0.00 |
| Egyptian Exchange | 30,947.44 | 71.02 | 0.23 |
| Ghana Stock Exchange | 6,037.85 | 26.45 | 0.44 |
| Johannesburg Stock Exchange | 88,570.19 | 308.91 | 0.35 |
| Lusaka Stock Exchange | 15,365.77 | -7.69 | -0.05 |
| Casablanca Stock Exchange | 16,609.78 | 38.11 | 0.23 |
| Malawi Stock Exchange | 289,111.37 | 6,831.18 | 2.42 |
| Nigeria Stock Exchange | 106,538.60 | -245.60 | -0.23 |
| Nairobi Securities Exchange | 133.71 | 0.01 | 0.01 |
| Namibian Stock Exchange | 1,775.91 | -6.24 | -0.35 |
| Rwanda Stock Exchange | 148.89 | 0.00 | 0.00 |
| Tunis Stock Exchange | 10,658.33 | -81.62 | -0.76 |
| Uganda Securities Exchange | 1,333.00 | 0.27 | 0.02 |
Nigeria Market Indexes
| Symbol | LClose | %Chg | WTD% | MTD% | QTD% | YTD% | MktCap | Trades |
|---|---|---|---|---|---|---|---|---|
| ASI | 106,621.91 | 0.08 | 0.00 | -0.78 | 3.34 | 3.34 | 13,855 | |
| NGX30 | 3,953.12 | 0.24 | 0.00 | -0.91 | 3.63 | 3.63 | 7,086 | |
| NGXAFRBVI | 2,598.75 | 0.46 | 0.00 | -0.24 | 4.75 | 4.75 | 2,380 | |
| NGXAFRHDYI | 17,144.18 | 0.53 | 0.00 | 0.76 | 0.69 | 0.69 | 2,824 | |
| NGXASEM | 1,587.23 | 0.00 | 0.00 | 0.04 | 0.22 | 0.22 | 2 | |
| NGXBNK | 1,134.52 | 0.20 | 0.00 | -1.49 | 4.33 | 4.33 | 3,181 | |
| NGXCG | 2,986.94 | 0.20 | 0.00 | -0.48 | 5.57 | 5.57 | 7,260 | |
| NGXCNSMRGDS | 1,812.44 | 0.23 | 0.00 | -0.46 | 4.50 | 4.50 | 1,570 | |
| NGXGROWTH | 7,829.65 | -0.21 | 0.00 | -0.62 | 0.86 | 0.86 | 45 | |
| NGXINDUSTR | 3,613.26 | -0.18 | 0.00 | -0.16 | 1.17 | 1.17 | 856 | |
| NGXINS | 693.53 | -0.87 | 0.00 | -2.62 | -11.79 | -11.79 | 967 | |
| NGXLOTUSISLM | 7,645.10 | -0.16 | 0.00 | -0.83 | 9.72 | 9.72 | 1,895 | |
| NGXMAINBOARD | 5,089.37 | 0.17 | 0.00 | -0.83 | 1.71 | 1.71 | 10,675 | |
| NGXMERIGRW | 7,043.97 | 3.34 | 0.00 | -1.82 | 7.98 | 7.98 | 2,019 | |
| NGXMERIVAL | 10,667.47 | 0.95 | 0.00 | -0.85 | 2.27 | 2.27 | 4,115 | |
| NGXOILGAS | 2,545.45 | -0.44 | 0.00 | -1.05 | -6.11 | -6.11 | 395 | |
| NGXPENBRD | 1,904.60 | 0.13 | 0.00 | -0.76 | 3.98 | 3.98 | 10,822 | |
| NGXPENSION | 4,754.06 | 0.34 | 0.00 | -0.85 | 4.85 | 4.85 | 8,227 | |
| NGXPREMIUM | 10,354.77 | -0.08 | 0.00 | -0.68 | 6.39 | 6.39 | 3,135 | |
| NGXSOVBND | 622.40 | 0.00 | 0.00 | -0.03 | 3.47 | 3.47 | 0 |
For more detailed analysis,
- On InfoWARE Market Data Terminal <MKTINS> <GO>
- On InfoWARE Finance Mobile App ( Android, iPhone & iPad and Windows 10) , "Market Indexes"
Find the topic interesting? Will like to comment? Contact Us at solutions@infowarelimited.com
Top News

Chart Of The Day - ASI Chart Vs ASI Advance Decline Line (YTD) (11-Mar-2025 15:07:16.841)
InfoWARE AI Analyst Daily Market Report: 11-Mar-2025

[SEPLAT]>>Corporate Disclosures-<SEPLAT ENERGY PLC>
[SEPLAT]>>Corporate Disclosures-<SEPLAT ENERGY PLC>
[NAHCO]>>Notice of Meeting -<NIGERIAN AVIATION HANDLING COMPANY PLC>
[XNSA]>> CORDROS MILESTONE FUNDS' BID & OFFER PRICES
[VSPBONDETF]>> DAILY INDICATIVE PRICES
[CAP]>>Notice of Meeting -<CHEMICAL AND ALLIED PRODUCTS PLC>
[NOTORE]>>Corporate Disclosures-<Notore Chemical Industries Plc>
[AIRTELAFRI]>>Corporate Disclosures-<Airtel Africa Plc>
[MERGROWTH]>> DAILY INDICATIVE PRICES
[XNSA]>> DAILY FUND PRICE SUBMISSION - FCMB ASSET MANAGEMENT LIMITED
[XNSA]>> NGX FIXED INCOME INDICATIVE PRICE LIST FOR MAR 11, 2025
[UCAP]>>Notice of Meeting -<UNITED CAPITAL PLC>
[NCR]>>Notice of Meeting -<NCR (NIGERIA) PLC.>
[XNSA]>> EMERGING AFRICA DAILY MUTUAL FUND PRICES
[XNSA]>> FBF PRESENTATION BY TANTALIZERS PLC - THURSDAY 13/3/25
[SIAMLETF40]>> DAILY INDICATIVE PRICES
[XNSA]>> REGISTRATION FOR BATCH ONE- 2025 DEALING CLERKSHIP CERTIFICATION PROGR
Chart Of The Day - ASI Chart Vs ASI Advance Decline Line (YTD) (10-Mar-2025 15:10:56.852)
InfoWARE AI Analyst Daily Market Report: 10-Mar-2025
[XNSA]>> CORDROS MILESTONE FUNDS' BID & OFFER PRICES
[MERVALUE]>> DAILY INDICATIVE PRICES
[XNSA]>> NGX FIXED INCOME INDICATIVE PRICE LIST FOR MAR 10, 2025
[XNSA]>> SUPPLEMENTARY LISTING OF FGN BONDS FEBRUARY 2025
[VETINDETF]>> DAILY INDICATIVE PRICES
[XNSA]>> EMERGING AFRICA DAILY MUTUAL FUND PRICES
[XNSA]>> DAILY FUND PRICE SUBMISSION - FCMB ASSET MANAGEMENT LIMITED
[GEREGU]>> Earning Forcast - <Q2-2025> ?-<GEREGU POWER PLC>
[XNSA]>> REGISTRATION FOR BATCH ONE- 2025 DEALING CLERKSHIP CERTIFICATION PROGR
Get IDIA - the stock trading app for the modern investor
Solutions by Business
Product Suites
Company
Contacts
- 8th Floor,
- South Atlantic Petroleum Towers,
- 1 Adeola Odeku Street,
- Victoria Island,
- Lagos, Nigeria.
- Email: solutions@infowarelimited.com
Follow Us
 |
 |
 |
 |