


InfoWARE AI Analyst Daily Market Report: 24-Apr-2025 | InfoWARE Finance
Get IDIA - the stock trading app for the modern investor


InfoWARE AI Analyst Daily Market Report: 24-Apr-2025
(Source: InfoWARE Terminal, Date: 24-Apr-2025)
Dear Investor,
NGX Daily Market Summary - Thursday, April 24, 2025
The Nigerian equities market snapped back with a +0.75% rise in the ASI, closing at 105,283.67. Despite this uptick, underlying activity was sharply lower: trading volume more than halved (-58% vs previous day), and turnover slumped by -45.4% to ₦9.69B. Breadth was robust (advance-decline ratio at 3.07x), underpinned by 46 advancers and just 15 decliners, indicating broad-based positive sentiment even as liquidity dried up. Notably, the ETF NEWGOLD surged 19.05%, while blue-chip NESTLE tumbled 10.00%. Below the surface, institutional flows remained highly concentrated in a few symbols, and high-momentum plays appeared in key sectors like building materials and consumer goods. However, some defensive, dividend-yielding stocks started to show fatigue, signaling the need for tactical adjustments in positioning.
Significant Trends in Market Breadth
- Breadth strong at 3.07x advancers to decliners, with 46 stocks rising and only 15 falling – this is typically a bullish market undercurrent even as ASI’s YTD return remains a modest 2.80%.
- Volume trends mixed: 64 names saw increased volume, but overall market volume shrank, suggesting action was clustered in select high-interest names (WAPCO, VFDGROUP, UNILEVER, NASCON, MTNN).
- Market liquidity drain: Aggregate turnover was down -45.4%, highlighting the risk of false breakouts in low-volume rallies.
Top Gainers and Losers
| Symbol | Name | % Change | RSI | Notes |
|---|---|---|---|---|
| NEWGOLD | NEWGOLD ETF | +19.05% | 48.0 | ETF delivered outsized gains on light volume; not overbought (RSI below 70). |
| ETERNA | ETERNA PLC | +10.00% | 35.2 | Petroleum distributor staging a turnaround; RSI still at low end. |
| CADBURY | CADBURY NIG PLC | +10.00% | 32.3 | Bounce from oversold (RSI near 30), still below long-term averages. |
| IKEJAHOTEL | IKEJA HOTEL PLC | +10.00% | 36.7 | Reversal from recent lows, volume in line. |
| NESTLE | NESTLE NIG PLC | -10.00% | 54.0 | Major profit-taking, but not yet technically oversold. |
| Symbol | Name | % Change | RSI | Notes |
|---|---|---|---|---|
| JOHNHOLT | JOHN HOLT PLC | -10.00% | 13.4 | Now deeply oversold, RSI at extreme low, potential for technical bounce. |
| HMCALL | HALDANE MCCALL | -9.96% | 10.1 | RSI at 10, strong selling pressure persists. |
| MULTIVERSE | MULTIVERSE PLC | -9.83% | 38.5 | Near oversold on momentum deceleration. |
| GUINEAINS | GUINEA INSURANCE | -8.57% | 53.0 | Heavy sell-off but no "oversold” signal yet. |
| JAPAULGOLD | JAPAUL GOLD | -6.19% | 58.2 | Pulled back from resistance, not oversold. |
Key Insights & Predictions
- Turnover Drop: The -45% drop in turnover (₦9.7B vs ₦17.8B prev.) alongside a market-wide advance signals the day’s gains could be fragile. This environment increases the risk of sharp reversals on any negative catalyst.
- Advance/Decline: With 46 advancers outnumbering 15 decliners, breadth remains bullish, but caution is advised given the declining liquidity – less money is chasing more winners.
- Unusual Volume: Five tickers had volume at least double the 90-day average, with WAPCO posting +328% volume and +10% price jump (in both institutional and retail top trades) – a signal of conviction behind the move. VFDGROUP's wild volatility and +8.19% rise (yet a YTD loss of -58.3%) mark it as a candidate for short covering or speculative repositioning.
- Bullish Momentum Standouts:
- NEWGOLD, CADBURY, ETERNA, IKEJAHOTEL each closed above their 15D MAs and posted sizable gains, suggesting the rally may extend, but watch for profit-taking as RSIs approach mid-range.
- VITAFOAM: Price now above both 15D/50D MAs; strong uptrend (YTD +70.4%), RSI moderate at ~46—momentum potential intact, with a solid 7.03% dividend yield, offering a rare blend of growth and income.
- Bearish Momentum Names:
- UBA and GUINEAINS crossed below their 15D MAs – UBA’s RSI dropping to 50 reflects growing caution among banks, while GUINEAINS’s selloff suggests sector fatigue. However, both face key support levels (watch for turnarounds if RSI dips further).
- Both stocks are top picks for cautious monitoring: reversal traders may hunt entries if oversold conditions arise.
- YTD Trends:
- NASCON (+60.8% YTD), INTBREW (+27.3% YTD, recent RSI 81.8, i.e. overbought), and VITAFOAM (+70.4% YTD) are still clear trend leaders with strong momentum, though INTBREW is running hot and due for a near-term pause.
- On the flip side, VFDGROUP (-58.3% YTD, massive rebound today but erratic chart), JOHNHOLT (-19.1% YTD), HMCALL (-3.5%), and MRS (-27.7%) epitomize persistent underperformance. Particularly, JOHNHOLT with RSI 13.4 is deeply oversold and merits contrarian interest.
Contrarian Signals
- NESTLE: Fell -10%, but RSI at 54 (not oversold), and still above its 50DMA; might tempt bottom-fishers, but bears remain in control in the short term.
- CADBURY: Rebounded with +10% and crossed key averages, but RSI still low—bulls should watch for confirmation of momentum.
- JOHNHOLT: Deeply oversold at RSI 13.4 and -19.1% YTD; typically ripe for a technical bounce, though poor fundamentals could extend the slide.
- VFDGROUP: Despite wild volume and price pops, YTD is -58%, and momentum remains volatile; this is a classic high-risk, "get out while you can” situation for traders.
- INTBREW: RSI above 80, strong recent runup, but beware mean reversion risk.
Sector Heatmaps (Top Movers)
| Sector | Top Gainer | Top Loser | Momentum (Bullish/Bearish) | Institutional Activity % |
|---|---|---|---|---|
| Building Materials | WAPCO (+10%) | - | Bullish (15DMA cross; unusual vol) | 8.4% |
| Consumer Goods | CADBURY (+10%) | NESTLE (-10%) | Bullish (CADBURY 15DMA cross; NESTLE contrarian) | n/a |
| Insurance | VERITASKAP (+12% 5D) | GUINEAINS (-8.6%) | Bearish (GUINEAINS 15DMA break below) | n/a |
| Oil & Gas | ETERNA (+10%) | JAPAULGOLD (-6.2%) | Bullish (ETERNA 15DMA cross, volumes solid) | n/a |
| Banking | FIDELITYBK | UBA (-2.79%) | Bearish (UBA 15DMA break below, falling RSI) | Large >20% (see below) |
Dividend-Beta Matrix (Defensive Opportunities)
| Symbol | Name | Dividend Yield | Beta | Momentum | Insight |
|---|---|---|---|---|---|
| AFRIPRUD | Africa Prudential | 1.27% | 0.64 | Bearish (-26.5% YTD) | Not yet reversing; lower beta provides defense but watch for recovery signals. |
| REGALINS | Regency Insurance | 6.52% | 0.47 | Stable | Attractive for yield; high yield, low beta, relatively stable RSI near 50. |
| VITAFOAM | VITAFOAM NIG PLC. | 7.03% | 0.47 | Bullish | Rare combination: high growth, high yield, low volatility – defensive plus upside. |
| FIDELITYBK | Fidelity Bank | 5.48% | 0.89 | Bullish | High yield with upward momentum, moderate risk, institutional inflow observed. |
Institutional Clustering Alerts
- ZENITHBANK: Institutional trades made up 20.17% of all trade value, with significant volumes but price just +0.89%. This highlights continued institutional "parking” in blue-chip banks.
- WAPCO: Dominant both in institutional and retail flows, paired with a price breakout and high volume. Institutionals may continue to rotate here for relative strength.
- ACCESSCORP & FIDELITYBK: Both remain top institutional darlings, combining upward technical momentum and value-trade concentration. Watch if rising institutional activity pushes these further.
High Dividend Stocks in Momentum Tables
- VITAFOAM (7.03% yield): Both high dividend and in bullish momentum table. Offers a compelling low-beta, defensive growth profile, especially important with market liquidity falling.
- FIDELITYBK (5.48% yield): While not the highest yield, it features in both institutional flows and positive momentum lists—combining yield with technical strength.
- REGALINS (6.5%): Among top YTD gainers, stable risk profile but not in bullish momentum yet; still one to watch for upturn.
Trading Suggestions / Opportunities
- Momentum Seekers: Focus on stocks breaking above the 15DMA with strong RSI (avoid those already in the "overbought” 80+ zone). WAPCO, VITAFOAM, FIDELITYBK stand out for persistent upside potential with supporting volumes.
- Contrarians: Deeply oversold laggards like JOHNHOLT, HMCALL could rebound technically. Risk-tolerant traders may look for reversal confirmation as RSI recovers from extreme lows.
- Yield Hunters: VITAFOAM, FIDELITYBK, and REGALINS offer solid dividends with either defensive or improving momentum. Diversify across low-beta income payers.
- Caution: Market-wide liquidity is low despite positive breadth. Be wary of false breakouts and high volatility in speculative tickers like VFDGROUP and INTBREW.
- Institutional Flows: Follow the money—ACCESSCORP and FIDELITYBK have strong institutional positioning and likely continued demand.
Year-To-Date (YTD) Top 5 Gainers and Losers
| Symbol | Name | YTD % Change | RSI | Notes |
|---|---|---|---|---|
| VITAFOAM | Vitafoam Nig. Plc. | +70.35% | 46.41 | Continues multi-month uptrend, now breaking out again. |
| NASCON | National Salt Co. | +60.83% | 55.11 | High volume on up moves, insider activity? |
| INTBREW | Intl. Breweries | +27.27% | 81.78 | Overbought, but momentum intact for now. |
| DANGSUGAR | Dangote Sugar | +21.08% | 56.66 | Momentum up, moderate RSI increases confidence. |
| FTNCOCOA | FTN Cocoa | +2.66% | 55.57 | Dividend mini play, mid-trend up. |
| Symbol | Name | YTD % Change | RSI | Notes |
|---|---|---|---|---|
| VFDGROUP | VFD Group Plc | -58.33% | 25.74 | Volatile recovery, liquidity event ongoing. |
| JOHNHOLT | John Holt Plc | -19.13% | 13.45 | Oversold, reversal watch. |
| TRIPPLEG | Tripple Gee | -12.00% | 1.04 | Near all-time technical exhaustion; high risk, high reward reversal possible. |
| HMCALL | Haldane McCall | -3.49% | 10.06 | Potential bottoming, still risky. |
| MRS | MRS Oil Nig. | -27.69% | 21.61 | Showing early stabilization, but patience needed. |
Market Activity / Trades Summaries & Retail vs Institutional Patterns
- Retail Investors: Accounted for 86.2% of total trade count but only 11.5% of value, showing they remain price takers and mostly in illiquid small caps.
- Institutional Investors: Just 13.8% of trade count, but an outsized 88.5% of value, confirming their dominance in block trades and impact on market direction.
-
Top 5 Institutional Trades:
- ACCESSCORP (13.5% of inst’l volume) – consistent large inflow, uptrend supported by institutions.
- FIDELITYBK (11.7%) – momentum aligning with institutional buying.
- ZENITHBANK, WAPCO, GTCO – blue chips preferred in volatile sessions; subject to program trading.
- Top 5 Retail Trades:
- ACCESSCORP leads again, but retail accounts for much less of the daily volume; spillover effect from institutional activity draws in retail.
- GTCO, VFDGROUP, ZENITHBANK, and UBA: Retailers mainly chase momentum or "safe” banking names, but risk being late to the move.
- Hidden Insights: Stocks with outsized institutional action (especially when both retail and institutional are active, as in ACCESSCORP, WAPCO, GTCO) tend to lead in both price action and news flow the following day. Look for repeat leaders from this list for short-term swing trades.
Summary Tactics for Traders
- Short-term traders: Focus on momentum breakouts like WAPCO, VITAFOAM, and FIDELITYBK.
- Reversal seekers: Scan for bottoming action in deeply oversold names—JOHNHOLT or TRIPPLEG.
- Yield seekers: Layer into high yield, low-beta gainers with intact uptrends (VITAFOAM, FIDELITYBK).
- If the market remains thin on volume, take partial profits on sharp upside moves—especially in stocks where price gains are not matched by rising volume.
Final word: The day’s strong breadth is encouraging, but falling turnover warns not all is well beneath the surface. Lean towards stocks with clear momentum (15DMA crossover, strong volume) and those with institutional backing, but be nimble—especially in ongoing low-liquidity conditions.
|
Top ASI Gainers Over Last 5 Trading Days
|
Top ASI Losers Over Last 5 Trading Days
|
For more detailed analysis, on InfoWARE Market Data Terminal <NSEPERF> <GO>
On InfoWARE Finance Mobile App (Android, iPhone & iPad, Windows Phone and Windows 8/10), "Top Gainers & Losers"
NEWGOLD EXCHANGE TRADED FUND (ETF) (NEWGOLD) topped the advancers list closing at N50,000.00 with a gain of 19.05% followed by NESTLE NIGERIA PLC. (NESTLE) which closed at N1,100.00 with a gain of 10.00%.
On the flip side JOHN HOLT PLC. (JOHNHOLT) and HALDANE MCCALL PLC (HMCALL) topped the decliners log with a loss of -10.00% at a close of N6.30, and -9.96% to close the day at N4.70 respectively.
| Symbol | LClose | %Chg |
|---|---|---|
| NEWGOLD | 50,000.00 | 19.05 |
| NESTLE | 1,100.00 | 10.00 |
| Ikejahotel | 11.00 | 10.00 |
| CADBURY | 24.20 | 10.00 |
| ETERNA | 36.30 | 10.00 |
| Symbol | LClose | %Chg |
|---|---|---|
| JOHNHOLT | 6.30 | -10.00 |
| HMCALL | 4.70 | -9.96 |
| MULTIVERSE | 7.80 | -9.83 |
| GUINEAINS | 0.64 | -8.57 |
| JAPAULGOLD | 1.97 | -6.19 |
For more detailed analysis,
- On InfoWARE Market Data Terminal <TOPG> <GO>
- On InfoWARE Finance Mobile App ( Android, iPhone & iPad and Windows 10) , "Top Gainers & Losers"
Currency Market
In the currency market, the Naira was unchanged against the dollar at 1 to 1NSE: Bull Signal - Price crossed above 15 Day MA
This signal implies these stocks are under buying pressure and the price might continue to rise and therefore positions should be monitored closely. Further suggested analysis include looking at the overall market (ASI) to see if the uptrend is market wide, sector wide or specific to the stock. Portfolio managers tend to use this as a signal to do more research to add to their positions or lock in some profits. Typically further analysis should be done using commands like PC and RV on the InfoWARE Market Data Terminal. Another command is ALERTS to set price triggers for possible exit or entry as necessary
For more detailed analysis,
- On InfoWARE Market Data Terminal <NSEPERF> <GO>
- On InfoWARE Finance Mobile App ( Android , iPhone & iPad and Windows 10) , "Top Gainers & Losers"
| Symbol | Price | %Chg | 15DMA | PE | EPS | DivY | MktCap | Vol | Trades | Value | LstTradeTime |
|---|---|---|---|---|---|---|---|---|---|---|---|
| NEWGOLD | 50,000.00 | 16.00 | 45,479.79 | 0.00 | 0.00 | 0.00 | 0.00 | 47.00 | 5.00 | 2.36M | 24-Apr-2025 14:31:54.087 |
| CADBURY | 24.20 | 9.09 | 22.92 | 33.25 | 0.64 | 1.88 | 45.45B | 619.92K | 39.00 | 15.00M | 24-Apr-2025 14:30:39.637 |
| ETERNA | 36.30 | 9.09 | 34.17 | 29.51 | 0.75 | 0.68 | 47.34B | 1.48M | 89.00 | 52.36M | 24-Apr-2025 14:30:41.243 |
| IKEJAHOTEL | 11.00 | 9.09 | 10.17 | 51.55 | 0.16 | 0.94 | 22.87B | 571.29K | 39.00 | 6.27M | 24-Apr-2025 14:30:42.347 |
| NESTLE | 1,100.00 | 9.09 | 1,017.33 | 20.58 | 41.31 | 4.29 | 871.92B | 117.27K | 50.00 | 128.86M | 24-Apr-2025 14:30:44.857 |
| WAPCO | 79.20 | 9.09 | 72.44 | 24.60 | 2.87 | 2.70 | 1,275.74B | 11.73M | 244.00 | 907.11M | 24-Apr-2025 14:31:55.763 |
| VITAFOAM | 40.80 | 9.07 | 37.56 | 8.66 | 2.56 | 7.03 | 51.03B | 3.54M | 71.00 | 141.13M | 24-Apr-2025 14:30:50.530 |
| ACADEMY | 2.87 | 9.06 | 2.64 | 0.00 | 0.00 | 3.51 | 2.17B | 1.07M | 26.00 | 3.05M | 24-Apr-2025 14:30:38.257 |
| VETGRIF30 | 40.20 | 8.21 | 40.11 | 0.00 | 0.00 | 10.00K | 1.00 | 402.00K | 24-Apr-2025 14:31:54.390 | ||
| CONHALLPLC | 3.00 | 6.67 | 2.93 | 69.63 | 0.03 | 2.08 | 32.11B | 1.32M | 32.00 | 3.76M | 24-Apr-2025 14:30:40.187 |
| FGSUK2032S5 | 100.00 | 5.00 | 96.45 | 0.00 | 0.00 | 127.00 | 1.00 | 127.00K | 24-Apr-2025 14:31:05.720 | ||
| TRANSCORP | 43.85 | 4.22 | 42.00 | 0.00 | 0.00 | 0.23 | 1,782.41B | 1.24M | 181.00 | 53.00M | 24-Apr-2025 14:30:49.330 |
| NGXINS | 659.77 | 4.14 | 640.09 | 10.41 | 2.09 | 0.00 | 0.00 | 23.49M | 894.00 | 51.45M | 24-Apr-2025 14:31:10.350 |
| MANSARD | 8.20 | 3.66 | 8.16 | 31.16 | 0.24 | 4.59 | 73.80B | 465.74K | 43.00 | 3.88M | 24-Apr-2025 14:30:43.517 |
| OANDO | 40.50 | 2.72 | 40.13 | 24.10 | 2.53 | 1.15 | 503.47B | 5.68M | 437.00 | 225.84M | 24-Apr-2025 14:30:45.813 |
| STERLINGNG | 5.23 | 2.68 | 5.17 | 15.75 | 0.30 | 3.19 | 150.57B | 2.89M | 103.00 | 15.12M | 24-Apr-2025 14:30:48.737 |
| MTNN | 245.00 | 2.45 | 243.16 | 16,715.80 | 0.01 | 3.29 | 4,986.86B | 5.85M | 438.00 | 1.42B | 24-Apr-2025 14:32:09.533 |
| NGXLOTUSISLM | 7,618.49 | 1.77 | 7,488.80 | 1,270.93 | 62.77 | 0.00 | 0.00 | 25.20M | 1,494.00 | 2.95B | 24-Apr-2025 14:31:10.503 |
| NGXINDUSTR | 3,520.43 | 1.28 | 3,480.29 | 39.90 | 18.97 | 0.00 | 0.00 | 13.87M | 619.00 | 971.71M | 24-Apr-2025 14:31:10.313 |
| MAYBAKER | 7.40 | 0.00 | 7.36 | 58.94 | 0.14 | 3.75 | 12.77B | 153.84K | 32.00 | 1.16M | 24-Apr-2025 14:30:43.620 |
NSE: BEAR Signal - Price crossed below 15 Day MA
This signal implies these stocks are under selling pressure and the price might continue to slide and therefore positions should be monitored closely. Further suggested analysis include looking at the overall market (ASI) to see if the downtrend is market wide, sector wide or specific to the stock. If the overal market trend is upwards, then since these stocks are heading in the opposite direction, then further analysis should be done using commands like PC and RV on the InfoWARE Market Data Terminal. Another command is ALERTS to set price triggers for possible exit is necessar
For more detailed analysis,
- On InfoWARE Market Data Terminal <BEARM> <GO>
- On InfoWARE Finance Mobile App ( Android , iPhone & iPad and Windows 10)
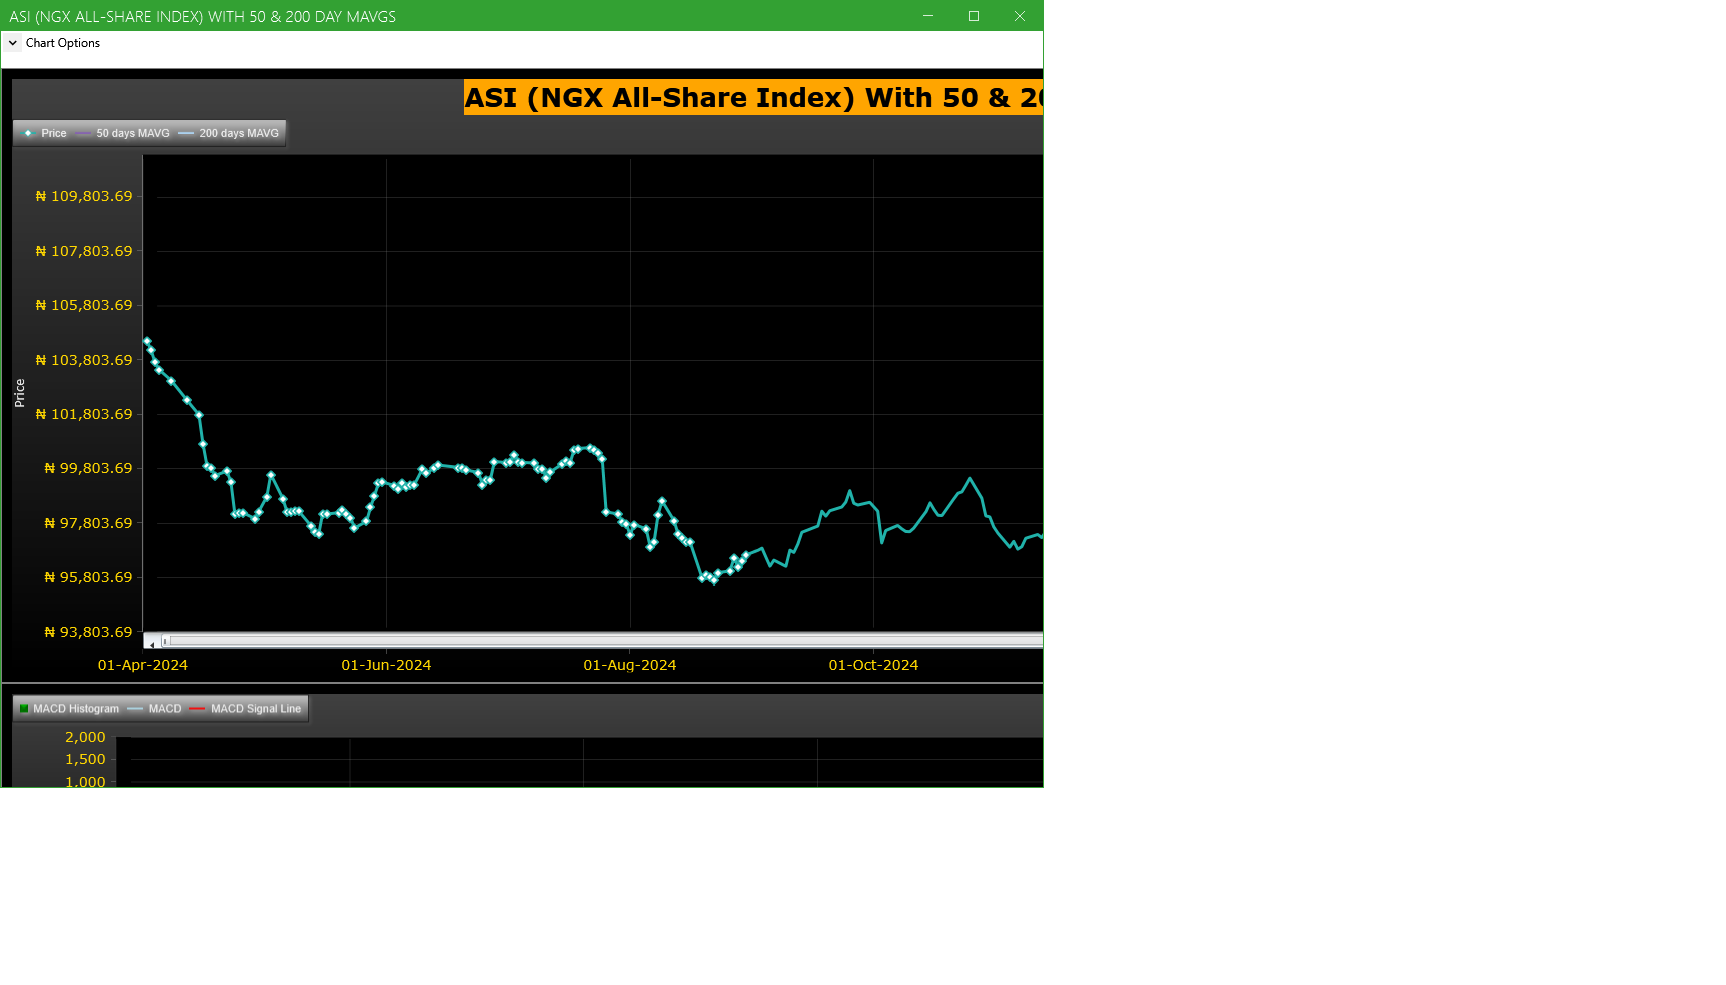
Market Trend - ASI (NGX All-Share-Index) With 50 & 200 Day MAvgs Chart
Technical traders typically use the 50 & 200 day moving averages to aid in choosing
where to enter or exit a position, which then causes these levels to act as strong
support or resistance. As a general guideline, if the price is above a moving average,
the trend is up. If the price is below a moving average, the trend is down.
It is important to note that critics of technical analysis say that moving averages act
as support and resistance because so many traders use these indicators to inform their
trading decisions. Also moving averages tend to work quite well in strong trending conditions
but poorly in choppy or ranging conditions.
Trading Strategies: Crossovers
Crossovers are one of the main moving average strategies. The first type is a price crossover,
which is when the price crosses above or below a moving average to signal a potential change
in trend. Another strategy is to apply two moving averages to a chart: one longer and one
shorter. When the shorter-term MA crosses above the longer-term MA, it is a buy signal, as
it indicates that the trend is shifting up. This is known as a golden cross. Meanwhile, when
the shorter-term MA crosses below the longer-term MA, it is a sell signal, as it indicates that
the trend is shifting down. This is known as a dead/death cross
For more detailed analysis,
- On InfoWARE Market Data Terminal <CI> <GO>
- On InfoWARE Finance Mobile App ( Android , iPhone & iPad and Windows 10) , "Research"
Unusual Volume: Volume traded is more than double the 90 day moving average (All exchanges; ASI & ASem). For more detailed analysis,
- On InfoWARE Market Data Terminal <UV> <GO>
- On InfoWARE Finance Mobile App ( Android , iPhone & iPad and Windows 10)
| Symbol | Name | Volume | 90DAvgVol | %VolChg | Price | LClose | %Chg | Trades | Value |
|---|---|---|---|---|---|---|---|---|---|
| WAPCO | LAFARGE WAPCO PLC. | 11.73M | 2.74M | 328.22 | 79.20 | 72.00 | 10.00 | 244 | 907.11M |
| VFDGROUP | VFD GROUP PLC | 9.15M | 846.38K | 981.25 | 18.50 | 17.10 | 8.19 | 482 | 167.70M |
| UNILEVER | UNILEVER NIGERIA PLC. | 8.68M | 1.08M | 706.47 | 38.50 | 38.05 | 1.18 | 85 | 333.24M |
| NASCON | NATIONAL SALT CO. NIG. PLC | 7.52M | 1.75M | 330.83 | 48.25 | 43.90 | 9.91 | 252 | 356.94M |
| MTNN | MTN NIGERIA PLC | 5.85M | 2.38M | 145.91 | 245.00 | 239.00 | 2.51 | 438 | 1.42B |
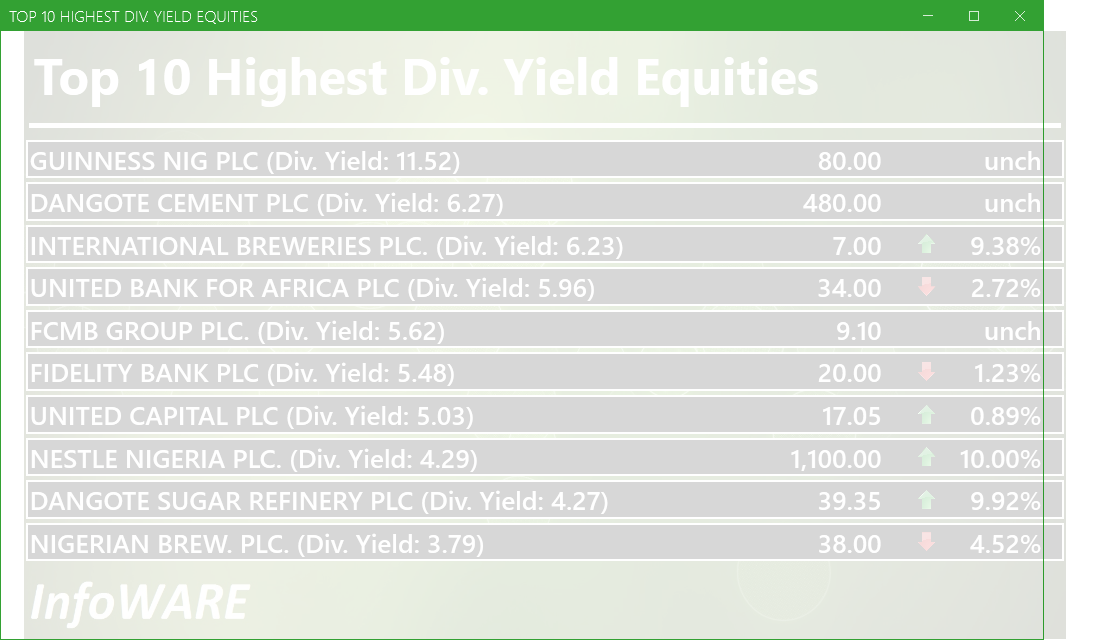
Investment Insights - High Div. Stocks
Dividend stocks distribute a portion of the company earnings to investors on a regular basis and they can a great choice for investors looking for regular income. As an investment or trading strategy, high dividend yield equities provide annual cash payments as against mostly capital gains in the price of a stock. The list in the table below represent the highest dividend paying stocks from the list of the most liquid stocks in the NSE top 30.
For more detailed analysis,
- On InfoWARE Market Data Terminal <HYIELD> <GO>
- On InfoWARE Finance Mobile App ( Android , iPhone & iPad and Windows 10) , "Research"
African Markets
| Name | LClose | Change | %Chg |
|---|---|---|---|
| BRVM Stock Exchange | 290.79 | 1.59 | 0.55 |
| Botswana Stock Exchange | 10,113.04 | 0.00 | 0.00 |
| Egyptian Exchange | 30,810.70 | 730.94 | 2.43 |
| Ghana Stock Exchange | 6,100.93 | 1.22 | 0.02 |
| Casablanca Stock Exchange | 16,070.49 | -306.24 | -1.87 |
| Malawi Stock Exchange | 294,562.18 | -1,837.68 | -0.62 |
| Nigeria Stock Exchange | 104,563.34 | -220.05 | -0.21 |
| Nairobi Securities Exchange | 126.78 | 1.02 | 0.81 |
| Rwanda Stock Exchange | 148.96 | 0.00 | 0.00 |
| Uganda Securities Exchange | 1,262.37 | -32.37 | -2.50 |
Nigeria Market Indexes
| Symbol | LClose | %Chg | WTD% | MTD% | QTD% | YTD% | MktCap | Trades |
|---|---|---|---|---|---|---|---|---|
| ASI | 106,074.26 | 0.75 | 1.27 | 0.50 | 0.50 | 2.80 | 10,871 | |
| NGX30 | 3,933.38 | 0.74 | 1.28 | 0.36 | 0.36 | 3.11 | 5,846 | |
| NGXAFRBVI | 2,520.05 | -0.03 | 2.52 | -5.37 | -5.37 | 1.58 | 2,499 | |
| NGXAFRHDYI | 16,932.81 | 0.01 | 1.59 | 1.74 | 1.74 | -0.56 | 2,344 | |
| NGXASEM | 1,591.68 | 0.09 | 0.09 | 0.24 | 0.24 | 0.50 | 4 | |
| NGXBNK | 1,112.29 | -0.20 | 2.72 | -4.18 | -4.18 | 2.29 | 2,743 | |
| NGXCG | 2,960.18 | 0.44 | 2.71 | -1.67 | -1.67 | 4.63 | 5,749 | |
| NGXCNSMRGDS | 1,945.31 | 2.35 | 3.63 | 7.14 | 7.14 | 12.16 | 1,392 | |
| NGXCOMMDTY | 1,002.50 | 0.00 | 0.00 | -0.11 | -0.11 | 0.25 | ||
| NGXGROWTH | 7,386.33 | -0.14 | -1.10 | -0.08 | -0.08 | -4.85 | 77 | |
| NGXINDUSTR | 3,520.43 | 1.29 | 1.27 | 0.87 | 0.87 | -1.43 | 619 | |
| NGXINS | 659.77 | 4.32 | 3.48 | -3.02 | -3.02 | -16.08 | 894 | |
| NGXLOTUSISLM | 7,618.49 | 1.80 | 2.22 | 0.85 | 0.85 | 9.34 | 1,494 | |
| NGXMAINBOARD | 5,111.74 | 0.62 | 1.13 | 1.00 | 1.00 | 2.15 | 8,062 | |
| NGXMERIGRW | 7,171.13 | 0.38 | 3.14 | 4.54 | 4.54 | 9.93 | 1,534 | |
| NGXMERIVAL | 10,482.88 | 1.52 | 3.19 | 1.84 | 1.84 | 0.50 | 3,309 | |
| NGXOILGAS | 2,419.24 | 0.27 | -0.02 | -1.12 | -1.12 | -10.77 | 319 | |
| NGXPENBRD | 1,908.91 | 0.61 | 1.11 | 1.07 | 1.07 | 4.22 | 8,451 | |
| NGXPENSION | 4,855.94 | 0.35 | 1.69 | 1.45 | 1.45 | 7.10 | 6,467 | |
| NGXPREMIUM | 10,250.89 | 1.00 | 1.54 | 0.84 | 0.84 | 5.32 | 2,732 | |
| NGXSOVBND | 651.61 | 0.00 | 0.00 | 3.95 | 3.95 | 8.32 | 0 |
For more detailed analysis,
- On InfoWARE Market Data Terminal <MKTINS> <GO>
- On InfoWARE Finance Mobile App ( Android, iPhone & iPad and Windows 10) , "Market Indexes"
Find the topic interesting? Will like to comment? Contact Us at solutions@infowarelimited.com
Top News

Chart Of The Day - ASI Chart Vs ASI Advance Decline Line (YTD) (24-Apr-2025 15:12:22.507)
InfoWARE AI Analyst Daily Market Report: 24-Apr-2025

[PRESCO]>>Notice of Meeting -<PRESCO PLC>
[XNSA]>> CORDROS MILESTONE FUNDS' BID & OFFER PRICES
[WAPCO]>>Corporate Disclosures-<LAFARGE AFRICA PLC.>
[WAPCO]>>Corporate Disclosures-<LAFARGE AFRICA PLC.>
[WAPCO]>>Corporate Disclosures-<LAFARGE AFRICA PLC.>
[XNSA]>> DAILY FUND PRICE SUBMISSION - FCMB ASSET MANAGEMENT LIMITED
[XNSA]>> EMERGING AFRICA DAILY MUTUAL FUND PRICES
[NEWGOLD]>> DAILY INDICATIVE PRICES
[VETINDETF]>> DAILY INDICATIVE PRICES
[LOTUSHAL15]>> DAILY INDICATIVE PRICES
[AIRTELAFRI]>>Corporate Disclosures-<Airtel Africa Plc>

Daily Business News Brief
CSL Research Cement Sector Report - Cementing Resilience: Strengthening Growth in 2025
[XNSA]>> NGX FIXED INCOME INDICATIVE PRICE LIST FOR APR 24, 2025
[XNSA]>> MONTHLY SUBMISSION OF CLIENT DATA FOR INVESTORS USING TRADING LICENSE H
[XNSA]>> LISTING OF LEGEND INTERNET PLC'S 2,000,000,000 ORDINARY SHARES OF 50 KO
[XNSA]>> WEMA BANK PLC: ACTIVATION OF CODE FOR TRADING IN RIGHTS
[XNSA]>> BEHIND THE LISTING PRESENTATION AND CLOSING GONG CEREMONY
Chart Of The Day - ASI Chart Vs ASI Advance Decline Line (YTD) (23-Apr-2025 15:08:41.269)
InfoWARE AI Analyst Daily Market Report: 23-Apr-2025
[MERVALUE]>> DAILY INDICATIVE PRICES
Breaking News! Unusual Volume Alert (23-Apr-2025 13:21:42.759)
Breaking News! Bulls Momentum Alert (23-Apr-2025 13:21:36.068)
Breaking News! Bears Momentum Alert (23-Apr-2025 13:21:35.969)
[VSPBONDETF]>> DAILY INDICATIVE PRICES
[XNSA]>> THE NGX FIXED INCOME INDICATIVE PRICE LIST FOR APR 23, 2025
[XNSA]>> WEMA BANK PLC: ACTIVATION OF CODE FOR TRADING IN RIGHTS
[XNSA]>> DAILY FUND PRICE SUBMISSION - FCMB ASSET MANAGEMENT LIMITED
Get IDIA - the stock trading app for the modern investor
Solutions by Business
Product Suites
Company
Contacts
- 8th Floor,
- South Atlantic Petroleum Towers,
- 1 Adeola Odeku Street,
- Victoria Island,
- Lagos, Nigeria.
- Email: solutions@infowarelimited.com
Follow Us
 |
 |
 |
 |