


InfoWARE AI Analyst Daily Market Report: 23-Jun-2025 | InfoWARE Finance
Get IDIA - the stock trading app for the modern investor


InfoWARE AI Analyst Daily Market Report: 23-Jun-2025
(Source: InfoWARE Terminal, Date: 23-Jun-2025)
Dear Investor,
NGX Daily Market Summary — Monday, June 23, 2025
The Nigerian equities market started the week on a positive note, with the NGX All Share Index up by 0.37% to close at 118,138.22 and solidifying its impressive 14.92% YTD return. Total market volume climbed slightly to 628.7M shares (from 601.8M), but market turnover dipped 16.15% to ₦19.9bn in the face of a robust 1.3x market breadth (43 advancers vs 33 decliners). Standout gainers like BETAGLAS, PRESCO, and NEIMETH led the rally, while CHAMPION and JBERGER suffered heavy losses. Notably, unusual trading volumes were seen in FTNCOCOA, NASCON, and NB, hinting at heightened market interest and possible trend changes.
Key Trends & Breadth
- Market Breadth: A bullish slant, as advancers outweighed decliners (43 to 33). However, volume was up for 68 stocks but down for 71 – suggesting selective buying and some sector rotation rather than a broad-based rally.
- Turnover Drop: Despite more shares changing hands, the 16.15% decrease in turnover points to flows into less expensive or small-cap names. This could signal rising risk appetite, or a temporary shift as institutions await greater clarity.
- Unusual Volumes: FTNCOCOA (+738% volatility spike), NASCON (+407%), NB (+234%), CUSTODIAN (+211%), and FIDELITYBK (+114%) all traded volumes much higher than their 90-day averages. These may be signalling accumulation/distribution or upcoming fundamental catalysts.
Top Gainers & Losers
| Top 5 Gainers | ||||
|---|---|---|---|---|
| Stock | Price (₦) | % Change | RSI | Notes |
| BETAGLAS | 303.60 | 10.00 | 81.79 | Strong momentum, RSI>80 (overbought); YTD: +367.8% |
| PRESCO | 1210 | 10.00 | 89.67 | Extremely overbought; MACD confirms trend |
| CHAMPION | 9.02 | 10.00 | 69.95 | Approaching overbought; see Contrarian below |
| NEIMETH | 4.07 | 10.00 | 65.05 | Bullish, but RSI not yet overbought |
| FTNCOCOA | 3.08 | 10.00 | 65.06 | Unusual volume; YTD: +63.8% |
| Top 5 Losers | ||||
|---|---|---|---|---|
| Stock | Price (₦) | % Change | RSI | Notes |
| CHAMPION | 9.02 | -10.00 | 69.95 | High volatility; unusual for a name to top both gainer/loser tables |
| JBERGER | 117.5 | -7.48 | 47.66 | Crossed below 15DMA; caution sign |
| CHAMS | 2.05 | -5.09 | 45.99 | Consolidation after prior gains |
| NSLTECH | 0.57 | -5.00 | 51.94 | No dividend, spec-trading |
| MULTIVERSE | 9.2 | -4.66 | 58.18 | Loss after YTD rally (+14.3%) |
Analysis, Patterns & Opportunities
-
Momentum Watch:
-
Bullish Flags:
- Stocks triggering bullish momentum (crossed above 15DMA) include CWG, FIRSTHOLDCO, ETERNA, NEWGOLD, FCMB, NB. Notably, FCMB’s 5.6% dividend yield may attract yield-starved investors.
- BETAGLAS, PRESCO, NASCON, and GTCO: All have extremely high RSI readings (>80), suggesting a strong trend but also potential for near-term pullback or profit-taking.
-
Bearish Flags:
- UBA, DANGCEM, JAIZBANK, FIDELITYBK, JBERGER are among stocks now crossing below 15DMA, implying rising seller control in these names, despite some (e.g. FIDELITYBK) reporting high institutional trade and robust YTD.
- Several stocks with decent dividend yields (UBA 5.96%, FIDELITYBK 5.48%, DANGCEM 6.27%) are flashing technical sell signals, suggesting defensive rotation or pre-dividend "sell the news".
-
Bullish Flags:
-
Unusual Volume Movers:
- FTNCOCOA: Price up 10%, volume 7x average — likely aggressive accumulation; recent momentum signals further upside but potential for volatility remains high.
- NB (Nigerian Brew): 234% volume surge, now above 15DMA, but muted price action (+0.35%) could mean distribution—watch for breakout or exhaustion.
- NASCON: Volume up 407% with a +7.9% gain; institutional interest apparent, also confirmed by high RSI (>80).
- Turnover Dip: Despite higher volumes, lower turnover (₦19.9bn vs ₦23.75bn) suggests increased trading in lower-priced stocks, possibly signaling speculative activity or rotation out of blue chips into smaller caps.
- Advance-Decline Trends: Advancers lead decliners substantially, suggesting underlying support, but the nearly equal split in volume direction (up for 68, down for 71) hints at increased stock-picking and developing divergences.
Contrarian Signals
- CHAMPION BREW (CHAMPION): Appearing on both gainer and loser tables with an RSI of 69.9 (approaching overbought), bullish MACD, yet also significant price volatility. Its +136.7% YTD run-up may be peaking—possible candidate for profit-taking or a one-day reversal trap.
- FIDELITYBK: Flashing a bearsih momentum (cross below 15DMA) despite high YTD growth (+11.8%), institutional interest, and a high volume spike. Mixed technicals urge caution—could be rotation ahead of key corporate events or dividend actions.
- NASCON: RSI at 81.8 (deeply overbought), but with institutional buying and high volatility, the risk/reward is now skewed; short-term traders may consider scaling back, while long-termers may await pullbacks.
Sector Heatmaps
| Sector | Performance | Institutional Activity | Bullish/Bearish Trends |
|---|---|---|---|
| Banking | Mixed | ZENITHBANK (20.17%), FIDELITYBK, ACCESSCORP |
Bullish: ZENITHBANK (RSI 70.7) Bearish: UBA, JAIZBANK, FIDELITYBK (all below 15DMA) |
| Building Materials | Weak | DANGCEM (heavyweight, low momentum) | Bearish signals in DANGCEM, WAPCO |
| Palm Oil/Agric | Strong | PRESCO | Bullish trend, high RSI (PRESCO) |
| Beverages | Strong | NB (unusual volume), CHAMPION | NB: Bullish; CHAMPION: Contrarian |
| Insurance | Mildly Positive | SOVRENINS, AIICO | SOVRENINS: Upward price action, moderate volume |
| Food Products | Very Strong | NASCON | Ultra-high volume; deeply overbought |
Dividend-Beta Matrix (Defensive Value Ideas)
| Stock | Dividend Yield (%) | Beta | Momentum | Comment |
|---|---|---|---|---|
| FCMB | 5.62 | 1.17 | Bullish | Above 15DMA; solid yield for moderate risk |
| FIDELITYBK | 5.48 | 0.89 | Bearish | Technical sell, but high yield and low beta may appeal on pullbacks |
| UBA | 5.96 | 1.56 | Bearish | Yield attractive but bear cross suggests patience |
| AIICO | 4.13 | 1.33 | Bearish | Turnover down, combine technical + fundamental caution suggested |
| NB | 3.79 | 0.79 | Bullish | Surging volume; low beta, above 15DMA; fits defensive momentum profile |
Institutional Clustering Alerts
- ZENITHBANK: Commanded 20.17% of institutional trade value, with a bullish RSI of 70.7—a major institutional favorite and a clear sector leader.
- FIDELITYBK: 21.16% of institutional volume, but technicals weaken—a warning that institutional rotation or short-term profit-taking could be underway.
- NASDAQ, NASCON: Institutional interest evident with high volume, price spikes, and positive technicals.
Notable Overlaps & Key Insights
- BETAGLAS: Dominates across gainer, YTD, and momentum tables—trend followers may ride, but beware frothy RSI.
- FTNCOCOA: Appears as both YTD and daily gainer, unusual volume play; potential short-term catalyst or pump-and-dump setup—traders beware.
- NB, FCMB: Bullish cross with high yield, attracting both momentum and conservative capital.
- AIICO, FIDELITYBK, UBA: All offer income potential but are short-term technical bears—patience or hedging advised.
Trade Activity & Participation Analysis
- Institutions: Only 37.05% of trades by count, but driving 70.73% of volume and a whopping 90.64% of value—showing clear preference for block trades, likely in large caps (ZENITHBANK, FIDELITYBK, ACCESSCORP, and NASCON).
- Retail: Dominating trade count (62.95%), but just 29.27% of volume; retail flow more scattered, favoring diverse mid/smaller cap opportunities.
- Pattern: 3 of the 5 most-traded stocks by both institutional and retail are in banking (ZENITHBANK, ACCESSCORP, UBA) signifying broad interest but diverging strategies (block trades vs. active swing trading).
- Takeaway: Watch for potential volatility and swing opportunities in stocks with both institutional clustering and high retail activity, especially if technical momentum aligns (case in point: ZENITHBANK and FIDELITYBK).
Monday Special: Last Week’s Performance in Review
Last week, the market sustained its bullish posture, with leading names like BETAGLAS, UPL, PRESCO, and CHAMPION notching strong double-digit gains over 5 days. These coincided with technical breakouts (high RSI, MACD cross), while turnover shifts and rising volumes in second-tier stocks signaled growing speculative interest. The breadth remained supportive, but profit warnings for overbought leaders are timely.
Tuesday/Wednesday Special — YTD Top Gainers & Losers
| Top 5 YTD Gainers | |||||
|---|---|---|---|---|---|
| Stock | YTD% | 5-Day% | RSI | Dividend Yield | Notes |
| BETAGLAS | 367.8 | 21.0 | 81.8 | 2.42 | Star performer YTD and daily, high overbought risk |
| PRESCO | 154.7 | 16.9 | 89.7 | 0.44 | Same as above; highly overbought |
| UPL | 71.9 | 20.8 | 61.7 | 0.60 | Strong momentum, but modest yield |
| FTNCOCOA | 63.8 | 17.1 | 65.1 | 1.60 | Momentum name, potential for swing trades |
| NEIMETH | 62.2 | 20.4 | 65.1 | 3.38 | Good blend of growth and yield |
| Top 5 YTD Losers | |||||
|---|---|---|---|---|---|
| Stock | YTD% | 5-Day% | RSI | Dividend Yield | Notes |
| SUNUASSUR | -57.5 | -5.4 | 27.4 | 0.99 | Oversold, possible rebound play (RSI=27.4) |
| GREENWETF | -47.8 | -19.0 | 15.74 | 0 | Extremely oversold (RSI=15.7), possible contrarian bounce |
| HMCALL | -17.9 | -5.9 | 19.0 | 0 | Technically oversold |
| LASACO | -11.5 | -3.2 | 56.7 | 4.05 | Yield play, but losing streak |
| MULTIVERSE | 14.3 | -6.6 | 58.2 | 0.85 | Recent selloff after strong YTD gain |
Suggestions for Traders
- Momentum traders: Focus on BETAGLAS, NEIMETH, and NB for trend continuation (monitor for RSI > 80 pullbacks).
- Mean-reversion & contrarians: Consider GREENWETF or SUNUASSUR for rebound setups (very low RSI).
- Yield seekers: Favor high-yielding stocks with technical strength (FCMB, NB), but avoid chasing names on bearish technicals (Fidelity, UBA) until a base is found.
- Caution: Avoid stocks with both high RSI and declining turnover/volume—these are prone to sudden spikes and quick corrections.
- Small caps/unusual volume: FTNCOCOA, NASCON — trade with tight stops as this may be transient accumulation or a pump-and-dump episode. Scale in/out rationally.
- Institutional cluster momentum: Names with both high institutional value and bullish signals (ZENITHBANK) may see sustained flows, but monitor for sudden reversals if institutional trades dry up.
- Keep an eye on sector rotation: Declining banking/financials and rising food/palm oil/beverages suggest short-term sector swings.
|
Top ASI Gainers Over Last 5 Trading Days
|
Top ASI Losers Over Last 5 Trading Days
|
For more detailed analysis, on InfoWARE Market Data Terminal <NSEPERF> <GO>
On InfoWARE Finance Mobile App (Android, iPhone & iPad, Windows Phone and Windows 8/10), "Top Gainers & Losers"
BETA GLASS CO PLC. (BETAGLAS) topped the advancers list closing at N303.60 with a gain of 10.00% followed by CHAMPION BREW. PLC. (CHAMPION) which closed at N9.02 with a gain of 10.00%.
On the flip side JULIUS BERGER NIG. PLC. (JBERGER) and CHAMS PLC (CHAMS) topped the decliners log with a loss of -7.48% at a close of N117.50, and -5.09% to close the day at N2.05 respectively.
| Symbol | LClose | %Chg |
|---|---|---|
| BETAGLAS | 303.60 | 10.00 |
| CHAMPION | 9.02 | 10.00 |
| FTNCOCOA | 3.08 | 10.00 |
| NEIMETH | 4.07 | 10.00 |
| PRESCO | 1,210.00 | 10.00 |
| Symbol | LClose | %Chg |
|---|---|---|
| JBERGER | 117.50 | -7.48 |
| CHAMS | 2.05 | -5.09 |
| NSLTECH | 0.57 | -5.00 |
| MULTIVERSE | 9.20 | -4.66 |
| REDSTAREX | 7.50 | -3.85 |
For more detailed analysis,
- On InfoWARE Market Data Terminal <TOPG> <GO>
- On InfoWARE Finance Mobile App ( Android, iPhone & iPad and Windows 10) , "Top Gainers & Losers"
Currency Market
In the currency market, the Naira was unchanged against the dollar at 1 to 1Investment Insights - Top 5 Gainers YTD
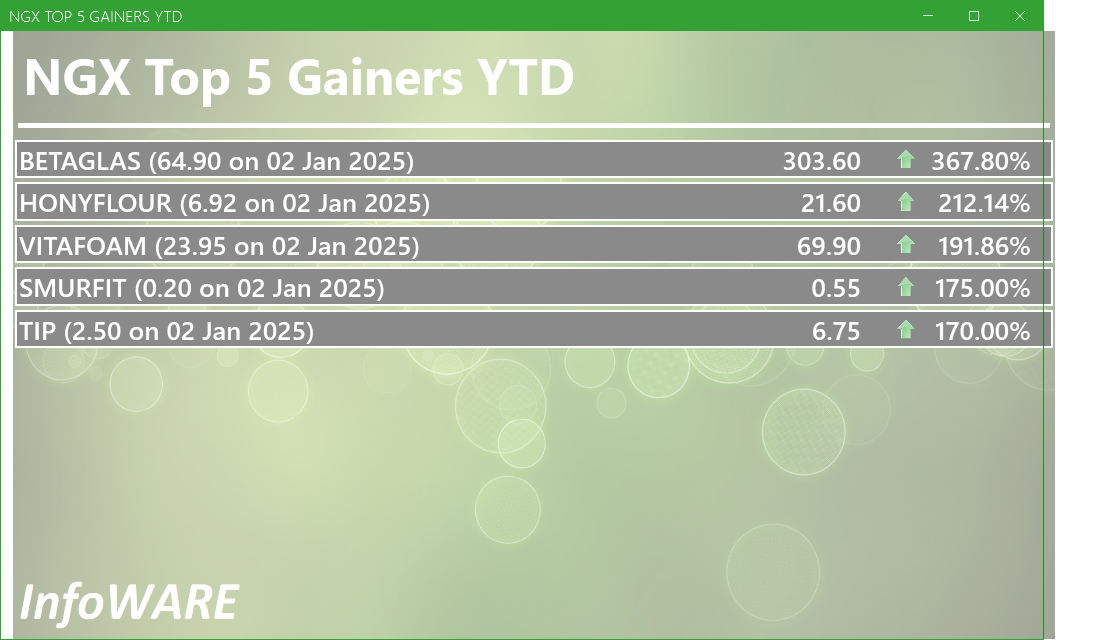
These stocks are the best performers whose price has risen faster than the market as a whole with the best returns year to date. Momentum investors believe that stocks that have outperformed the market will often continue to do so because the factors that caused them to outperform will not suddenly disappear. In addition, other investors seeking to benefit from the stock’s outperformance will often purchase the stock, further bidding its price higher and pushing the stock higher still
For more detailed analysis,
- On InfoWARE Market Data Terminal <T5YTD2> <GO>
- On InfoWARE Finance Mobile App ( Android , iPhone & iPad and Windows 10) , "Research"
NSE: Bull Signal - Price crossed above 15 Day MA
This signal implies these stocks are under buying pressure and the price might continue to rise and therefore positions should be monitored closely. Further suggested analysis include looking at the overall market (ASI) to see if the uptrend is market wide, sector wide or specific to the stock. Portfolio managers tend to use this as a signal to do more research to add to their positions or lock in some profits. Typically further analysis should be done using commands like PC and RV on the InfoWARE Market Data Terminal. Another command is ALERTS to set price triggers for possible exit or entry as necessary
For more detailed analysis,
- On InfoWARE Market Data Terminal <NSEPERF> <GO>
- On InfoWARE Finance Mobile App ( Android , iPhone & iPad and Windows 10) , "Top Gainers & Losers"
| Symbol | Price | %Chg | 15DMA | PE | EPS | DivY | MktCap | Vol | Trades | Value | LstTradeTime |
|---|---|---|---|---|---|---|---|---|---|---|---|
| CWG | 9.60 | 4.17 | 9.27 | 0.00 | 0.00 | 2.46 | 24.24B | 2.97M | 178.00 | 28.13M | 23-Jun-2025 14:30:13.437 |
| FIRSTHOLDCO | 28.00 | 3.75 | 27.33 | 0.00 | 0.00 | 7.14M | 420.00 | 193.83M | 23-Jun-2025 14:30:42.317 | ||
| ETERNA | 43.95 | 3.30 | 42.68 | 29.51 | 0.75 | 0.68 | 57.32B | 1.39M | 125.00 | 59.34M | 23-Jun-2025 14:30:13.893 |
| NEWGOLD | 57,000.00 | 1.05 | 55,533.33 | 0.00 | 0.00 | 0.00 | 0.00 | 5.00 | 4.00 | 285.90K | 23-Jun-2025 14:30:42.147 |
| FCMB | 9.90 | 0.51 | 9.87 | 104.31 | 0.09 | 5.62 | 196.05B | 15.80M | 344.00 | 154.98M | 23-Jun-2025 14:30:13.997 |
| NB | 58.00 | 0.34 | 57.96 | 16.95 | 1.60 | 3.79 | 596.02B | 38.09M | 203.00 | 2.21B | 23-Jun-2025 14:30:14.820 |
NSE: BEAR Signal - Price crossed below 15 Day MA
This signal implies these stocks are under selling pressure and the price might continue to slide and therefore positions should be monitored closely. Further suggested analysis include looking at the overall market (ASI) to see if the downtrend is market wide, sector wide or specific to the stock. If the overal market trend is upwards, then since these stocks are heading in the opposite direction, then further analysis should be done using commands like PC and RV on the InfoWARE Market Data Terminal. Another command is ALERTS to set price triggers for possible exit is necessar
For more detailed analysis,
- On InfoWARE Market Data Terminal <BEARM> <GO>
- On InfoWARE Finance Mobile App ( Android , iPhone & iPad and Windows 10)
| Symbol | Price | %Chg | 15DMA | PE | EPS | DivY | MktCap | Vol | Trades | Value | LstTradeTime |
|---|---|---|---|---|---|---|---|---|---|---|---|
| UBA | 34.90 | 1.43 | 34.97 | 8.29 | 4.05 | 5.96 | 1,193.56B | 10.95M | 856.00 | 379.84M | 23-Jun-2025 14:30:42.353 |
| DANGCEM | 440.00 | 0.00 | 443.31 | 761.31 | 0.63 | 6.27 | 7,497.82B | 318.53K | 415.00 | 137.26M | 23-Jun-2025 14:30:42.303 |
| GEREGU | 1,141.50 | 0.00 | 1,149.11 | 0.00 | 0.00 | 0.70 | 2,853.75B | 7.53K | 77.00 | 7.74M | 23-Jun-2025 14:30:14.070 |
| WAPCO | 86.00 | 0.00 | 86.31 | 24.60 | 2.87 | 2.70 | 1,385.27B | 1.98M | 173.00 | 169.70M | 23-Jun-2025 14:30:42.370 |
| AIICO | 1.59 | -0.63 | 1.61 | 2.01 | 0.60 | 4.13 | 58.20B | 11.25M | 304.00 | 17.81M | 23-Jun-2025 14:30:12.277 |
| JAIZBANK | 3.16 | -1.58 | 3.18 | 83.05 | 0.03 | 1.67 | 109.15B | 5.72M | 220.00 | 18.04M | 23-Jun-2025 14:30:41.760 |
| FIDELITYBK | 19.00 | -2.11 | 19.20 | 13.24 | 1.17 | 5.48 | 550.52B | 141.71M | 826.00 | 2.66B | 23-Jun-2025 14:30:14.010 |
| DEAPCAP | 0.93 | -2.15 | 0.94 | 188.84 | 0.01 | 13.76 | 1.40B | 694.83K | 30.00 | 651.71K | 23-Jun-2025 14:30:13.507 |
| JBERGER | 117.50 | -8.09 | 122.52 | 16.73 | 10.31 | 1.74 | 188.00B | 403.57K | 162.00 | 47.31M | 23-Jun-2025 14:30:14.467 |
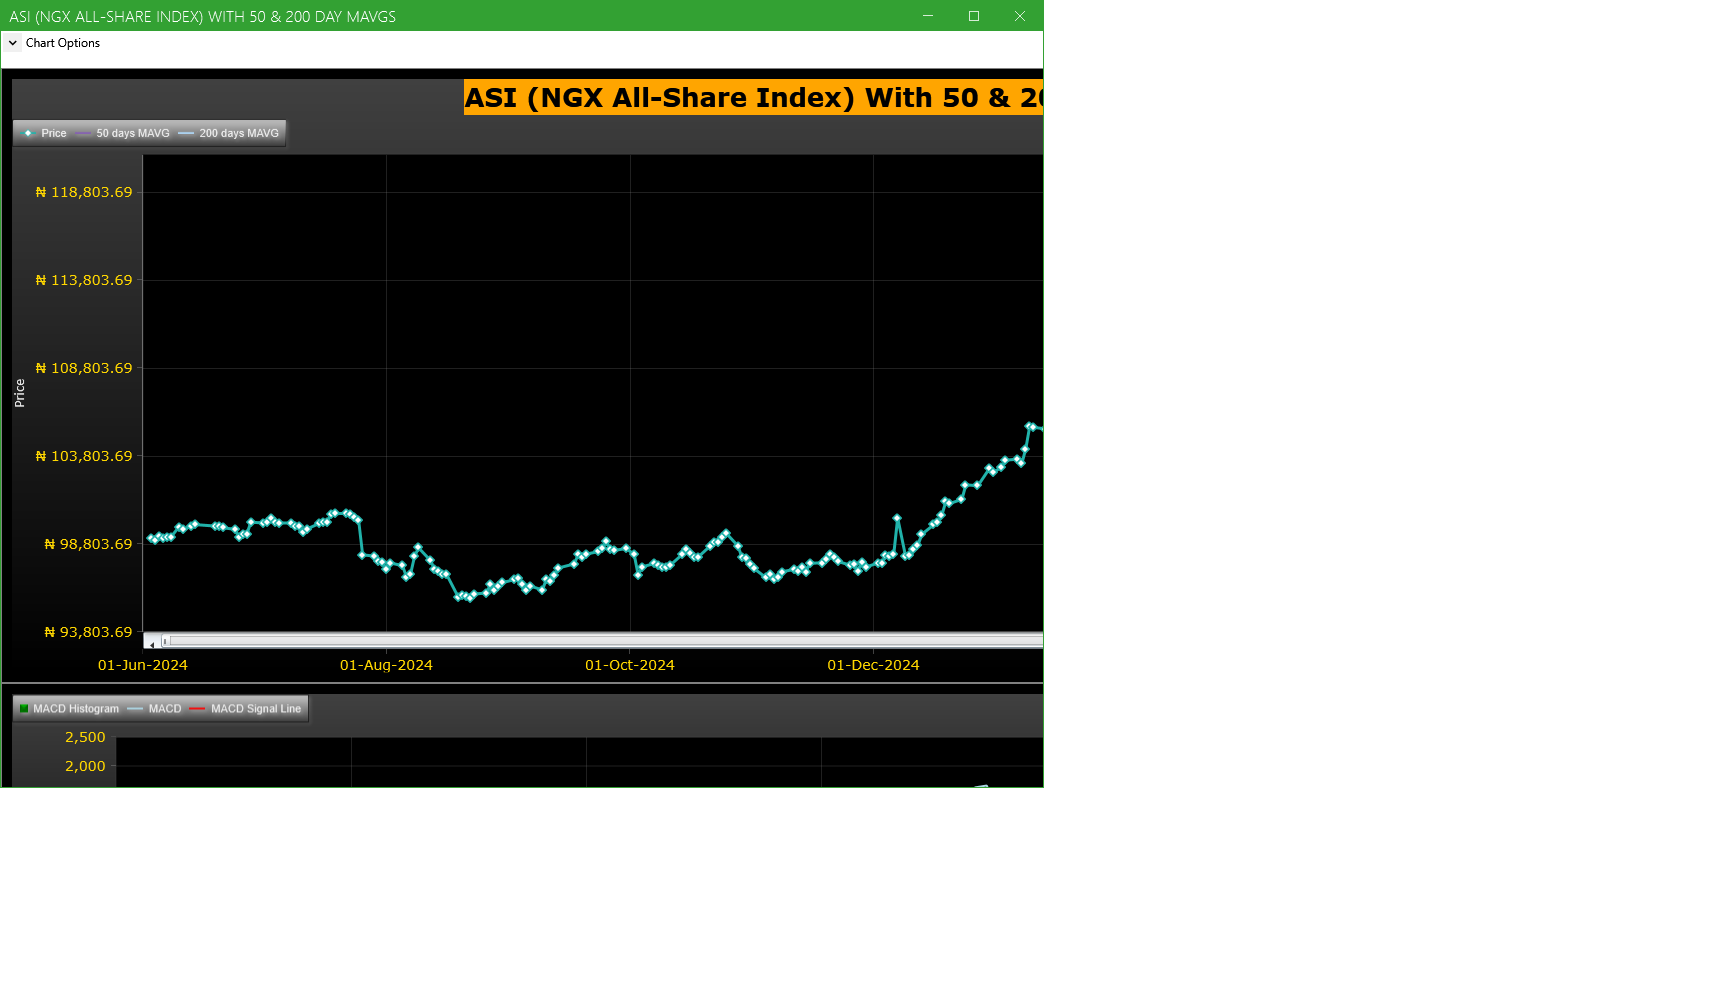
Market Trend - ASI (NGX All-Share-Index) With 50 & 200 Day MAvgs Chart
Technical traders typically use the 50 & 200 day moving averages to aid in choosing
where to enter or exit a position, which then causes these levels to act as strong
support or resistance. As a general guideline, if the price is above a moving average,
the trend is up. If the price is below a moving average, the trend is down.
It is important to note that critics of technical analysis say that moving averages act
as support and resistance because so many traders use these indicators to inform their
trading decisions. Also moving averages tend to work quite well in strong trending conditions
but poorly in choppy or ranging conditions.
Trading Strategies: Crossovers
Crossovers are one of the main moving average strategies. The first type is a price crossover,
which is when the price crosses above or below a moving average to signal a potential change
in trend. Another strategy is to apply two moving averages to a chart: one longer and one
shorter. When the shorter-term MA crosses above the longer-term MA, it is a buy signal, as
it indicates that the trend is shifting up. This is known as a golden cross. Meanwhile, when
the shorter-term MA crosses below the longer-term MA, it is a sell signal, as it indicates that
the trend is shifting down. This is known as a dead/death cross
For more detailed analysis,
- On InfoWARE Market Data Terminal <CI> <GO>
- On InfoWARE Finance Mobile App ( Android , iPhone & iPad and Windows 10) , "Research"
Unusual Volume: Volume traded is more than double the 90 day moving average (All exchanges; ASI & ASem). For more detailed analysis,
- On InfoWARE Market Data Terminal <UV> <GO>
- On InfoWARE Finance Mobile App ( Android , iPhone & iPad and Windows 10)
| Symbol | Name | Volume | 90DAvgVol | %VolChg | Price | LClose | %Chg | Trades | Value |
|---|---|---|---|---|---|---|---|---|---|
| FIDELITYBK | FIDELITY BANK PLC | 141.71M | 65.98M | 114.76 | 19.00 | 19.40 | -2.06 | 826 | 2.66B |
| NB | NIGERIAN BREW. PLC. | 38.09M | 11.40M | 234.29 | 58.00 | 57.80 | 0.35 | 203 | 2.21B |
| FTNCOCOA | FTN COCOA PROCESSORS PLC | 37.98M | 4.53M | 738.97 | 3.08 | 2.80 | 10.00 | 170 | 115.90M |
| CUSTODIAN | CUSTODIAN AND ALLIED PLC | 21.49M | 6.90M | 211.36 | 25.00 | 25.50 | -1.96 | 134 | 528.34M |
| NASCON | NATIONAL SALT CO. NIG. PLC | 10.45M | 2.06M | 407.03 | 68.00 | 63.00 | 7.94 | 316 | 682.14M |
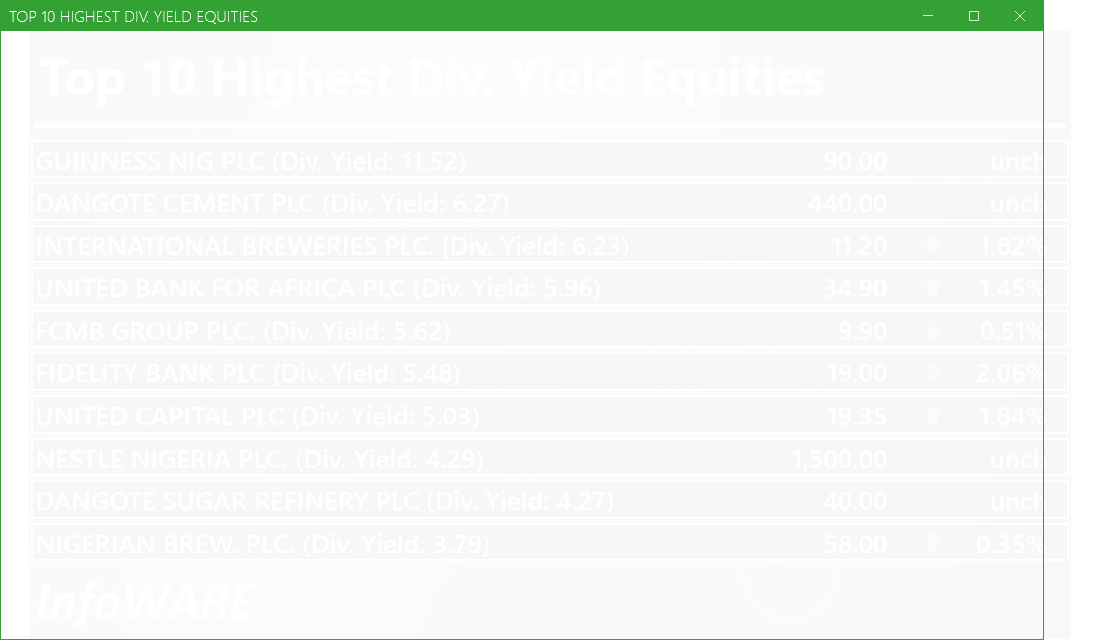
Investment Insights - High Div. Stocks
Dividend stocks distribute a portion of the company earnings to investors on a regular basis and they can a great choice for investors looking for regular income. As an investment or trading strategy, high dividend yield equities provide annual cash payments as against mostly capital gains in the price of a stock. The list in the table below represent the highest dividend paying stocks from the list of the most liquid stocks in the NSE top 30.
For more detailed analysis,
- On InfoWARE Market Data Terminal <HYIELD> <GO>
- On InfoWARE Finance Mobile App ( Android , iPhone & iPad and Windows 10) , "Research"
Investment Insights - Stocks outperforming the ASI but with approximately the same risk
These list of stocks represent equities that are less risky than the ASI but doing better than the ASI (All Shares Index) using the YTD (Year to Date) returns as the measure. The risk is measured by Beta. Beta is an assessment of a stock's tendency to undergo price changes, (its volatility), as well as its potential returns compared to the ASI. It is expressed as a ratio, where a score of 1 represents performance comparable to the ASI, and returns above or below the market may receive scores greater or lower than 1.
For a full list of both positively and negatively corelated stocks visit InfoWARE Market Data Terminal
- On InfoWARE Market Data Terminal <BANL> <GO>
- On InfoWARE Finance Mobile App ( Android , iPhone & iPad and Windows 10)
| Symbol | DivYield | PE | EPS | Beta | %ChgYTD | ASIYTDReturn | BetaDiff |
|---|---|---|---|---|---|---|---|
| HONYFLOUR | 1.40 | 16.28 | 0.31 | 0.99 | 212.14 | 14.92 | 0.01 |
| CAVERTON | 5.52 | 1.15 | 1.57 | 0.98 | 80.00 | 14.92 | 0.02 |
| FTNCOCOA | 1.60 | 0.00 | 0.00 | 0.79 | 63.83 | 14.92 | 0.21 |
| NB | 3.79 | 16.95 | 1.60 | 0.79 | 81.25 | 14.92 | 0.21 |
| MAYBAKER | 3.75 | 58.94 | 0.14 | 0.78 | 70.21 | 14.92 | 0.22 |
| UNILEVER | 2.81 | 67.09 | 0.40 | 0.75 | 27.92 | 14.92 | 0.25 |
| VETGOODS | 0.00 | 0.71 | 46.51 | 14.92 | 0.29 | ||
| VETGRIF30 | 0.00 | 0.71 | 15.23 | 14.92 | 0.29 | ||
| CUTIX | 6.52 | 8.81 | 0.26 | 0.70 | 26.48 | 14.92 | 0.30 |
| Ikejahotel | 0.94 | 51.55 | 0.16 | 0.70 | 26.32 | 14.92 | 0.30 |
African Markets
| Name | LClose | Change | %Chg |
|---|---|---|---|
| BRVM Stock Exchange | 313.02 | 2.08 | 0.67 |
| Botswana Stock Exchange | 10,351.25 | 15.50 | 0.15 |
| Egyptian Exchange | 30,248.44 | -589.00 | -1.91 |
| Ghana Stock Exchange | 6,210.28 | 17.96 | 0.29 |
| Johannesburg Stock Exchange | 94,710.50 | -208.82 | -0.22 |
| Lusaka Stock Exchange | 20,521.84 | 20.50 | 0.10 |
| Casablanca Stock Exchange | 17,957.33 | 331.37 | 1.88 |
| Malawi Stock Exchange | 307,031.13 | 5,636.09 | 1.87 |
| Nigeria Stock Exchange | 118,138.22 | 282.85 | 0.24 |
| Nairobi Securities Exchange | 145.68 | 1.06 | 0.73 |
| Namibian Stock Exchange | 1,734.40 | -1.91 | -0.11 |
| Rwanda Stock Exchange | 150.53 | 0.00 | 0.00 |
| Tunis Stock Exchange | 11,297.63 | 106.32 | 0.95 |
| Uganda Securities Exchange | 1,282.76 | 5.11 | 0.40 |
Nigeria Market Indexes
| Symbol | LClose | %Chg | WTD% | MTD% | QTD% | YTD% | MktCap | Trades |
|---|---|---|---|---|---|---|---|---|
| ASI | 118,579.65 | 0.37 | 0.00 | 5.85 | 12.35 | 14.92 | 20,364 | |
| NGX30 | 4,371.96 | 0.24 | 0.00 | 5.80 | 11.55 | 14.60 | 10,781 | |
| NGXAFRBVI | 2,899.74 | 0.53 | 0.00 | 10.36 | 8.89 | 16.89 | 4,641 | |
| NGXAFRHDYI | 19,168.63 | 0.35 | 0.00 | 4.08 | 15.17 | 12.57 | 4,683 | |
| NGXASEM | 1,593.40 | 0.00 | 0.00 | 0.00 | 0.35 | 0.61 | 16 | |
| NGXBNK | 1,269.62 | 0.62 | 0.00 | 9.18 | 9.37 | 16.76 | 4,831 | |
| NGXCG | 3,400.12 | 0.35 | 0.00 | 8.78 | 12.94 | 20.18 | 11,056 | |
| NGXCNSMRGDS | 2,539.41 | 0.73 | 0.00 | 6.78 | 39.87 | 46.42 | 3,042 | |
| NGXCOMMDTY | 1,041.21 | 0.87 | 0.00 | 4.55 | 3.75 | 4.12 | ||
| NGXGROWTH | 8,648.28 | -0.02 | 0.00 | 11.03 | 17.00 | 11.41 | 134 | |
| NGXINDUSTR | 3,522.07 | 0.19 | 0.00 | 2.25 | 0.92 | -1.39 | 1,412 | |
| NGXINS | 737.49 | 1.90 | 0.00 | 6.79 | 8.41 | -6.19 | 1,278 | |
| NGXLOTUSISLM | 9,018.74 | 0.65 | 0.00 | 8.38 | 19.39 | 29.43 | 3,185 | |
| NGXMAINBOARD | 5,820.55 | 0.44 | 0.00 | 4.84 | 15.00 | 16.32 | 15,440 | |
| NGXMERIGRW | 7,944.91 | 0.50 | 0.00 | 3.83 | 15.82 | 21.79 | 3,813 | |
| NGXMERIVAL | 10,663.65 | 1.02 | 0.00 | 3.87 | 3.60 | 2.24 | 5,461 | |
| NGXOILGAS | 2,511.17 | 0.43 | 0.00 | 7.65 | 2.64 | -7.38 | 567 | |
| NGXPENBRD | 2,164.13 | 0.30 | 0.00 | 6.86 | 14.58 | 18.15 | 17,001 | |
| NGXPENSION | 5,723.47 | 0.29 | 0.00 | 8.96 | 19.57 | 26.23 | 12,617 | |
| NGXPREMIUM | 11,444.13 | 0.24 | 0.00 | 10.13 | 12.58 | 17.58 | 4,790 | |
| NGXSOVBND | 652.03 | 0.00 | 0.00 | -0.64 | 4.02 | 8.39 | 0 |
For more detailed analysis,
- On InfoWARE Market Data Terminal <MKTINS> <GO>
- On InfoWARE Finance Mobile App ( Android, iPhone & iPad and Windows 10) , "Market Indexes"
Find the topic interesting? Will like to comment? Contact Us at solutions@infowarelimited.com
Top News

Chart Of The Day - ASI Chart Vs ASI Advance Decline Line (YTD) (23-Jun-2025 15:10:18.461)
InfoWARE AI Analyst Daily Market Report: 23-Jun-2025

[NASCON]>>Notice of Meeting -<NASCON Allied Industries Plc>
[XNSA]>> CIS TRAINING ON "RETIREMENT PLANNING AND WEALTH CREATION & MANAGEMENT
[NEWGOLD]>> DAILY INDICATIVE PRICES
[VETBANK]>> DAILY INDICATIVE PRICES
[XNSA]>> NGX FIXED INCOME INDICATIVE PRICE LIST FOR JUN 23, 2025
[XNSA]>> DAILY FUND PRICE SUBMISSION - FCMB ASSET MANAGEMENT LIMITED
[LASACO]>>Corporate Disclosures-<LASACO ASSURANCE PLC.>
[MERVALUE]>> DAILY INDICATIVE PRICES
[XNSA]>> EMERGING AFRICA DAILY FUND PRICES
[XNSA]>> CORDROS MILESTONE FUNDS' BID & OFFER PRICES
[MTNN]>>Notice of Meeting -<MTN Nigeria Communications Plc>
[SOVRENINS]>>Corporate Disclosures-<SOVEREIGN TRUST INSURANCE PLC>
InfoWARE AI Analyst Weekly Market Report: 20-Jun-2025
Chart Of The Day - ASI Chart Vs ASI Advance Decline Line (YTD) (20-Jun-2025 15:07:23.447)
InfoWARE AI Analyst Daily Market Report: 20-Jun-2025
[NEWGOLD]>>Corporate Disclosures-<NEWGOLD EXCHANGE TRADED FUND (ETF)>
[XNSA]>> NORRENBERGER MUTUAL FUNDS WEEKLY UPDATE
[XNSA]>> CIS TRAINING ON "RETIREMENT PLANNING AND WEALTH CREATION & MANAGEMENT
[XNSA]>> CORDROS MILESTONE FUNDS' BID & OFFER PRICES
[NPFMCRFBK]>>Corporate Disclosures-<NPF MICROFINANCE BANK PLC>
[TRANSEXPR]>>Corporate Disclosures-<TRANS-NATIONWIDE EXPRESS PLC.>
[XNSA]>> EMERGING AFRICA DAILY FUND PRICES
[NEWGOLD]>> DAILY INDICATIVE PRICES
[VSPBONDETF]>> DAILY INDICATIVE PRICES
[LOTUSHAL15]>> DAILY INDICATIVE PRICES
Breaking News! Unusual Volume Alert (20-Jun-2025 11:21:12.918)
Breaking News! Bulls Momentum Alert (20-Jun-2025 11:21:10.564)
Breaking News! Bears Momentum Alert (20-Jun-2025 11:21:10.392)
Get IDIA - the stock trading app for the modern investor
Solutions by Business
Product Suites
Company
Contacts
- 8th Floor,
- South Atlantic Petroleum Towers,
- 1 Adeola Odeku Street,
- Victoria Island,
- Lagos, Nigeria.
- Email: solutions@infowarelimited.com
Follow Us
 |
 |
 |
 |