


InfoWARE AI Analyst Daily Market Report: 03-Jul-2025 | InfoWARE Finance
Get IDIA - the stock trading app for the modern investor


InfoWARE AI Analyst Daily Market Report: 03-Jul-2025
(Source: InfoWARE Terminal, Date: 03-Jul-2025)
Dear Investor,
NGX Market Recap & Analysis – Thursday, July 3, 2025
The NGX All Share Index surged 0.53% to close at 120,339.90, pushing YTD gains to 17.25%, signaling renewed bullish sentiment. Today's session was marked by vibrant activity: market turnover soared by 152.19% to ₦28.33B despite a slight dip in trading volumes (-12.8% vs. previous day). Market breadth expanded impressively (3.17x advancers-to-decliners), with 57 stocks advancing against 18 declining—clear evidence of widespread buying. Notably, sector rotation into mid- and small-cap momentum names continued, spurred by technical breakouts and unusual volume spikes in several overlooked counters.
Key Market Trends
-
Market Breadth: Very robust, with 57 advancers vs. 18 decliners (breadth: 3.17x).
- Volume rose in 73 stocks, showing broad-based buying strength, even as it fell in 67 others.
- Top Gainer: BERGER PAINTS PLC (BERGER) up +10.00% to ₦33.00 – close to critical technical levels. RSI at 68.3 (nearing overbought).
- Top Loser: ACADEMY PRESS PLC. (ACADEMY) down -10.00% to ₦5.61 – yet the RSI is 74.6, implying it remains technically overbought despite today's selloff.
- ETF action: VETIVA S&P NIGERIA SOVEREIGN BOND ETF (VSPBONDETF) plunged -29.54%, the largest drop, reflecting exceptional volatility in the bond-ETF space.
- Unusual Volume Leaders: CHAMS (+6.84%, 494% volume surge), UNIVINSURE (+3.33%, 392% volume uptick), FTNCOCOA (+9.95%, 395% volume jump) flagged as short-term momentum hotspots.
Deep Dives & Market Implications
- Turnover: Despite lower aggregate volumes, the sharp spike in turnover (₦28.33B vs. ₦11.23B prior) implies large-cap and block trades—mostly driven by institutional flows. This suggests confidence in continued market momentum.
-
Institutional Footprint:
- Institutions accounted for 62.1% of volume and 91.98% of total trade value, but only 39% of trade count, indicating fewer, larger-sized trades (classic signature of strategic positioning in blue chips).
- Top institutional trades: GTCO, ACCESSCORP, ZENITHBANK, FIDELITYBK, VFDGROUP – mostly banks, further underscoring sectoral rotation back into financials.
-
Retail Action:
- Retail dominated trade count at 61%, but only 8% of value, highlighting smaller, speculative trades in popular tickers (e.g., ELLAHLAKES, CUTIX).
-
Stocks with Unusual Volume:
- CHAMS and UNIVINSURE (both with >390% surge in volumes vs. 90-day averages) may be primed for price discovery moves—watch for post-spike retracements or trend extensions.
- FTNCOCOA: Momentum both in price and volume (see also YTD gainers table), suggesting high speculative interest. RSI at 78.2 flags overbought.
-
Bullish Momentum Clusters (crossed above 15DMA): GTCO, MANSARD, AIICO, UPL, THOMASWY
- Insurance names stand out (MANSARD, AIICO), aided by technical breakouts and healthy dividend yields.
- GTCO: Both institutional and retail favorite, with YTD +45% and now confirming fresh upside on strong liquidity.
-
Bearish Momentum Clusters (crossed below 15DMA): ETI, LEGENDINT, VSPBONDETF
- LEGENDINT and VSPBONDETF also appear among today's biggest losers, pointing to further downside risk, especially amid high volatility signals.
- GREENWETF (YTD -58%, RSI 20): strong technical oversold signal; potential for speculative bounce, but caution advised until reversal confirmed.
- Currency Market: The Naira appreciated 0.25% to 1,533/$, signaling macro support for equities.
Contrarian Signals: Hidden Tensions
- ACADEMY: Despite a -10% drop, RSI remains highly elevated at 74.6—typically, RSI above 70 signals overbought, so the price decline may have further to run, or it could be a sharp correction in a strong uptrend.
- NEIMETH: Down -8.5% but showing extreme overbought reading (RSI 94!) – this suggests either a technical anomaly or a pending sharp mean-reversion selloff.
- VFDGROUP: Trading at new lows (-69.6% YTD), yet recent institutional flows are picking up (institutional volume up >340%). RSI at 31.5 (approaching oversold territory). Potential "dump then pump" candidate for short-term speculators.
- LEGENDINT: Appearing both in top losers (-7.98%) and bearish momentum (below 15DMA), but MACD still hovering around positive territory—look for volatility, but beware of false reversal signals.
Sector Heatmap & Technical Trends
| Sector | Top Performer | Day Change (%) | YTD Leader | YTD (%) | Momentum Clusters | Retail/Institutional Flow |
|---|---|---|---|---|---|---|
| Insurance | AIICO | +2.45 | MUTUAL BENEFIT | +136.07 | Bullish: AIICO, MANSARD Unusual Vol: UNIVINSURE, VERITASKAP |
Retail-heavy, strong price/vol momentum |
| Banking | GTCO | +3.32 | GTCO | +45.18 | Bullish: GTCO Bearish: ETI Strong institutional flows |
Dominated by institutional trades (GTCO, ZENITHBANK) |
| Crop Production | FTNCOCOA | +9.95 | FTNCOCOA | +158.51 | Major momentum, unusual volume | Speculative retail flows |
| Processing Systems | CHAMS | +6.84 | CHAMS | — | Unusual volume, momentum | Retail |
| ETF/Bond | - | -29.54 | VSPBONDETF, GREENWETF | -29.54 / -58.10 | Bearish (GREENWETF, VSPBONDETF) Extreme volatility, technical weakness |
N/A |
Dividend–Beta Matrix: Defensive Opportunities
| Stock | Dividend Yield (%) | Beta | Momentum | Insight |
|---|---|---|---|---|
| CUTIX | 6.52 | 0.70 | Bullish, overbought (RSI 81.7) | Defensive yield + price upside, but consider trimming as overbought |
| FIDELITYBK | 5.48 | 0.89 | Strong institutional support, above 15DMA | Value pick for yield & safety |
| AIICO | 4.13 | 1.33 | Bullish 15DMA cross | Moderate yield, higher risk, momentum upside |
| UPDC | 34.25 | 1.10 | YTD Top Gainer | High yield, but check for payout sustainability & valuation |
| MUTUAL BENEFIT | 3.28 | 1.27 | Bullish, overbought (RSI 73.7) | High beta, increased volatility |
| ZENITHBANK | 2.25 | 1.20 | Strong institutional clustering | Blue-chip defensive |
Institutional Clustering Alerts
- ZENITHBANK: 20.17% of institutional trade value in top 5 trades—watch for block trade moves and large-scale positioning as a possible leading indicator for wider sector rotations.
- GTCO: Heavy institutional volume and value (11.24% of inst. trade value), technical breakout above 15DMA. Supported by both institutional and retail liquidity—potential further upside.
- ACCESSCORP: Consistent institutional interest, even after a -2.60% daily drop, indicating possible "buy the dip" set-up.
- VFDGROUP: Despite being a major YTD loser (-69.6%), institutional volumes surged more than 300% over its 90-day average—potential for event-driven re-rating.
High Dividend Yield Stocks & Momentum
- CUTIX (6.52%) and FIDELITYBK (5.48%) marry yield with strong price action and institutional support—prime for portfolio defensive tilts.
- UPDC (34.25%) and MUTUAL BENEFIT (3.28%) offer yield and YTD momentum; however, monitor for overextension as both show RSIs in overbought territory.
- DANGCEM (6.27%) appears among YTD Top Losers – potential value trap if dividend payouts are at risk due to negative momentum and sector headwinds.
Opportunities & Cautions for Traders
- Momentum Play: Consider short-term momentum in FTNCOCOA, JAPAULGOLD, MCNICHOLS – but beware RSI readings above 70 (overbought), indicating a pullback is possible.
- Bounce Candidates: GREENWETF and VFDGROUP are technically oversold (RSI near/below 30); momentum reversal traders can watch for mean-reversion setups but avoid early entry ahead of confirmed stabilization.
- Yield & Defense: Defensive investors may look at CUTIX and FIDELITYBK for a blend of yield and technical breakouts, with relatively low Beta.
- Contrarian Shorts: If high-volume movers like CHAMS or UNIVINSURE gap further, watch for exhaustion/fade opportunities as volume momentum wanes.
- Sectoral Rotation: The banking and insurance sectors are drawing both retail and institutional capital; traders may overweight these themes pending technical confirmations in coming sessions.
Top 5 YTD Gainers
| Stock | YTD % | 5D % | RSI | Div. Yield (%) | BETA | PE | Sparkline (15D/50D MA) |
|---|---|---|---|---|---|---|---|
| FTNCOCOA | 158.51 | 32.79 | 78.21 | 1.60 | 0.79 | 0.00 | 📈 |
| UPDC | 149.13 | 32.62 | 70.58 | 34.25 | 1.10 | 0.00 | 📈 |
| MUTUAL BENEFIT | 136.07 | 30.91 | 73.69 | 3.28 | 1.27 | 5.43 | 📈 |
| SCOA | 135.92 | -9.83 | 29.92 | 3.40 | 0.16 | 2.26 | 📉 |
| MCNICHOLS | 89.44 | 32.61 | 67.56 | 5.88 | -0.11 | 26.80 | 📈 |
Top 5 YTD Losers
| Stock | YTD % | 5D % | RSI | Div. Yield (%) | BETA | PE | Sparkline (15D/50D MA) |
|---|---|---|---|---|---|---|---|
| VFDGROUP | -69.59 | -2.88 | 31.47 | 0.00 | 0.11 | 0.00 | 📉 |
| GREENWETF | -58.10 | -18.99 | 20.00 | 0.00 | 0.83 | 0.00 | 📉 |
| SUNUASSUR | -57.17 | -2.92 | 46.88 | 0.99 | 0.27 | 0.00 | 📉 |
| HALDANE MCCALL | -17.86 | -4.76 | 30.32 | 0.00 | -0.74 | 0.00 | 📉 |
| JOHN HOLT | -10.14 | -5.41 | 51.56 | 1.25 | -0.20 | 8.80 | — |
Market Activity Analysis
- Distribution of Trades: Retail investors conducted nearly two-thirds (61.0%) of trades but contributed just 8.0% of value, while institutional flows, although only 39.0% of trades, controlled a massive 92% of value and 62.1% of volume—reaffirming the institutional dominance in dictating price levels.
-
Top 5 Most Traded (Institutions): GTCO, ACCESSCORP, ZENITHBANK, FIDELITYBK, VFDGROUP (all major banks/diversified financials except VFDGROUP).
- These tend to coincide with price stability, technical support, and are often bellweathers for sector rotation. Notably, VFDGROUP is unusual as a top traded institutional yet is a YTD laggard—potential special situation play or bottom fishing by value funds.
-
Top 5 Most Traded by Retail: ELLAHLAKES, ACCESSCORP, GTCO, CUTIX, ZENITHBANK
- Heavily speculative retail positioning in ELLAHLAKES (RSI 89.6, +199% YTD) and CUTIX (RSI 81.7, +66% YTD, Div 6.5%), likely chasing short-term upside. GTCO and ZENITHBANK also popular among retail, revealing cross-over in institutional favorites.
-
Patterns:
- Stocks with both high retail & institutional activity (e.g., GTCO, ZENITHBANK, ACCESSCORP) often trade with greater liquidity and are supported during market volatility.
- Contrastingly, speculative retail-only names (ELLAHLAKES, CUTIX) typically show outsized recent gains and indications of overextension (very high RSI and standard deviation).
Hidden Insights & Final Takeaways
- Bullish momentum and institutional liquidity are converging in financials and insurance, restoring confidence post-pullback. Watch for potential new highs in large caps if turnover remains elevated.
- Momentum clusters (especially those flagged by RSI > 70 and high MACD) are at risk of short-term exhaustion. Potential for tactical profit-taking and mean reversion in the coming days.
- Contrarian/undervalued setups (GREENWETF, VFDGROUP) offer "event play" potential but require nimble, risk-managed trade entries.
- Watch for continued sector rotation—financials may broaden to selected consumer staples and select small caps with improving earnings visibility.
- Yield-seekers: Prioritize stocks pairing above-market dividend yield with low beta and technical support (e.g., CUTIX, FIDELITYBK) for portfolio stability.
|
Top ASI Gainers Over Last 5 Trading Days
|
Top ASI Losers Over Last 5 Trading Days
|
For more detailed analysis, on InfoWARE Market Data Terminal <NSEPERF> <GO>
On InfoWARE Finance Mobile App (Android, iPhone & iPad, Windows Phone and Windows 8/10), "Top Gainers & Losers"
BERGER PAINTS PLC (BERGER) topped the advancers list closing at N33.00 with a gain of 10.00% followed by ACADEMY PRESS PLC. (ACADEMY) which closed at N5.61 with a gain of 10.00%.
On the flip side VETIVA S & P NIGERIA SOVEREIGN BOND ETF (VSPBONDETF) and GREENWICH ASSET ETF (GREENWETF) topped the decliners log with a loss of -29.55% at a close of N310.00, and -10.00% to close the day at N223.73 respectively.
| Symbol | LClose | %Chg |
|---|---|---|
| BERGER | 33.00 | 10.00 |
| ACADEMY | 5.61 | 10.00 |
| DEAPCAP | 1.10 | 10.00 |
| GUINEAINS | 0.99 | 10.00 |
| UNILEVER | 56.85 | 9.96 |
| Symbol | LClose | %Chg |
|---|---|---|
| VSPBONDETF | 310.00 | -29.55 |
| GREENWETF | 223.73 | -10.00 |
| NEIMETH | 7.22 | -8.49 |
| LEGENDINT | 7.73 | -7.98 |
| NEWGOLD | 52,000.00 | -5.45 |
For more detailed analysis,
- On InfoWARE Market Data Terminal <TOPG> <GO>
- On InfoWARE Finance Mobile App ( Android, iPhone & iPad and Windows 10) , "Top Gainers & Losers"
Currency Market
In the currency market, the Naira appreciated 0.25%(3.83) against the Dollar to settle at 1 to 1NSE: Bull Signal - Price crossed above 15 Day MA
This signal implies these stocks are under buying pressure and the price might continue to rise and therefore positions should be monitored closely. Further suggested analysis include looking at the overall market (ASI) to see if the uptrend is market wide, sector wide or specific to the stock. Portfolio managers tend to use this as a signal to do more research to add to their positions or lock in some profits. Typically further analysis should be done using commands like PC and RV on the InfoWARE Market Data Terminal. Another command is ALERTS to set price triggers for possible exit or entry as necessary
For more detailed analysis,
- On InfoWARE Market Data Terminal <NSEPERF> <GO>
- On InfoWARE Finance Mobile App ( Android , iPhone & iPad and Windows 10) , "Top Gainers & Losers"
| Symbol | Price | %Chg | 15DMA | PE | EPS | DivY | MktCap | Vol | Trades | Value | LstTradeTime |
|---|---|---|---|---|---|---|---|---|---|---|---|
| UPL | 6.09 | 9.03 | 5.81 | 7.13 | 0.59 | 0.60 | 2.63B | 3.78M | 90.00 | 22.79M | 03-Jul-2025 14:30:49.700 |
| THOMASWY | 2.05 | 8.78 | 2.02 | 0.00 | 0.00 | 1.05 | 451.00M | 1.08M | 21.00 | 2.20M | 03-Jul-2025 14:30:47.810 |
| MANSARD | 9.97 | 7.62 | 9.54 | 31.16 | 0.24 | 4.59 | 89.73B | 881.36K | 90.00 | 8.52M | 03-Jul-2025 14:30:42.610 |
| FGSUK2032S5 | 97.00 | 7.17 | 93.71 | 0.00 | 0.00 | 10.00K | 1.00 | 9.70M | 03-Jul-2025 14:31:06.330 | ||
| GTCO | 82.75 | 3.32 | 81.05 | 7.49 | 7.10 | 1.88 | 2,435.43B | 40.64M | 968.00 | 3.37B | 03-Jul-2025 14:31:50.323 |
| AIICO | 1.63 | 2.45 | 1.61 | 2.01 | 0.60 | 4.13 | 59.67B | 13.29M | 308.00 | 21.33M | 03-Jul-2025 14:30:38.190 |
| FGS202654 | 65.00 | 0.00 | 65.00 | 0.00 | 0.00 | 0.00 | 0.00 | 0.00 | 03-Jul-2025 14:31:04.913 |
NSE: BEAR Signal - Price crossed below 15 Day MA
This signal implies these stocks are under selling pressure and the price might continue to slide and therefore positions should be monitored closely. Further suggested analysis include looking at the overall market (ASI) to see if the downtrend is market wide, sector wide or specific to the stock. If the overal market trend is upwards, then since these stocks are heading in the opposite direction, then further analysis should be done using commands like PC and RV on the InfoWARE Market Data Terminal. Another command is ALERTS to set price triggers for possible exit is necessar
For more detailed analysis,
- On InfoWARE Market Data Terminal <BEARM> <GO>
- On InfoWARE Finance Mobile App ( Android , iPhone & iPad and Windows 10)
| Symbol | Price | %Chg | 15DMA | PE | EPS | DivY | MktCap | Vol | Trades | Value | LstTradeTime |
|---|---|---|---|---|---|---|---|---|---|---|---|
| ETI | 30.50 | -1.64 | 30.69 | 5.00 | 5.10 | 2.00 | 559.66B | 1.39M | 86.00 | 42.38M | 03-Jul-2025 14:30:40.933 |
| LEGENDINT | 7.73 | -8.67 | 7.99 | 0.00 | 0.00 | 5.36M | 116.00 | 42.99M | 03-Jul-2025 14:30:42.367 | ||
| VSPBONDETF | 310.00 | -41.94 | 324.10 | 0.00 | 0.00 | 571.00 | 9.00 | 256.59K | 03-Jul-2025 14:31:52.063 | ||
| DIF2032S1TB | 20.00 | -400.00 | 94.67 | 0.00 | 0.00 | 100.00 | 1.00 | 20.00K | 03-Jul-2025 14:31:01.403 |
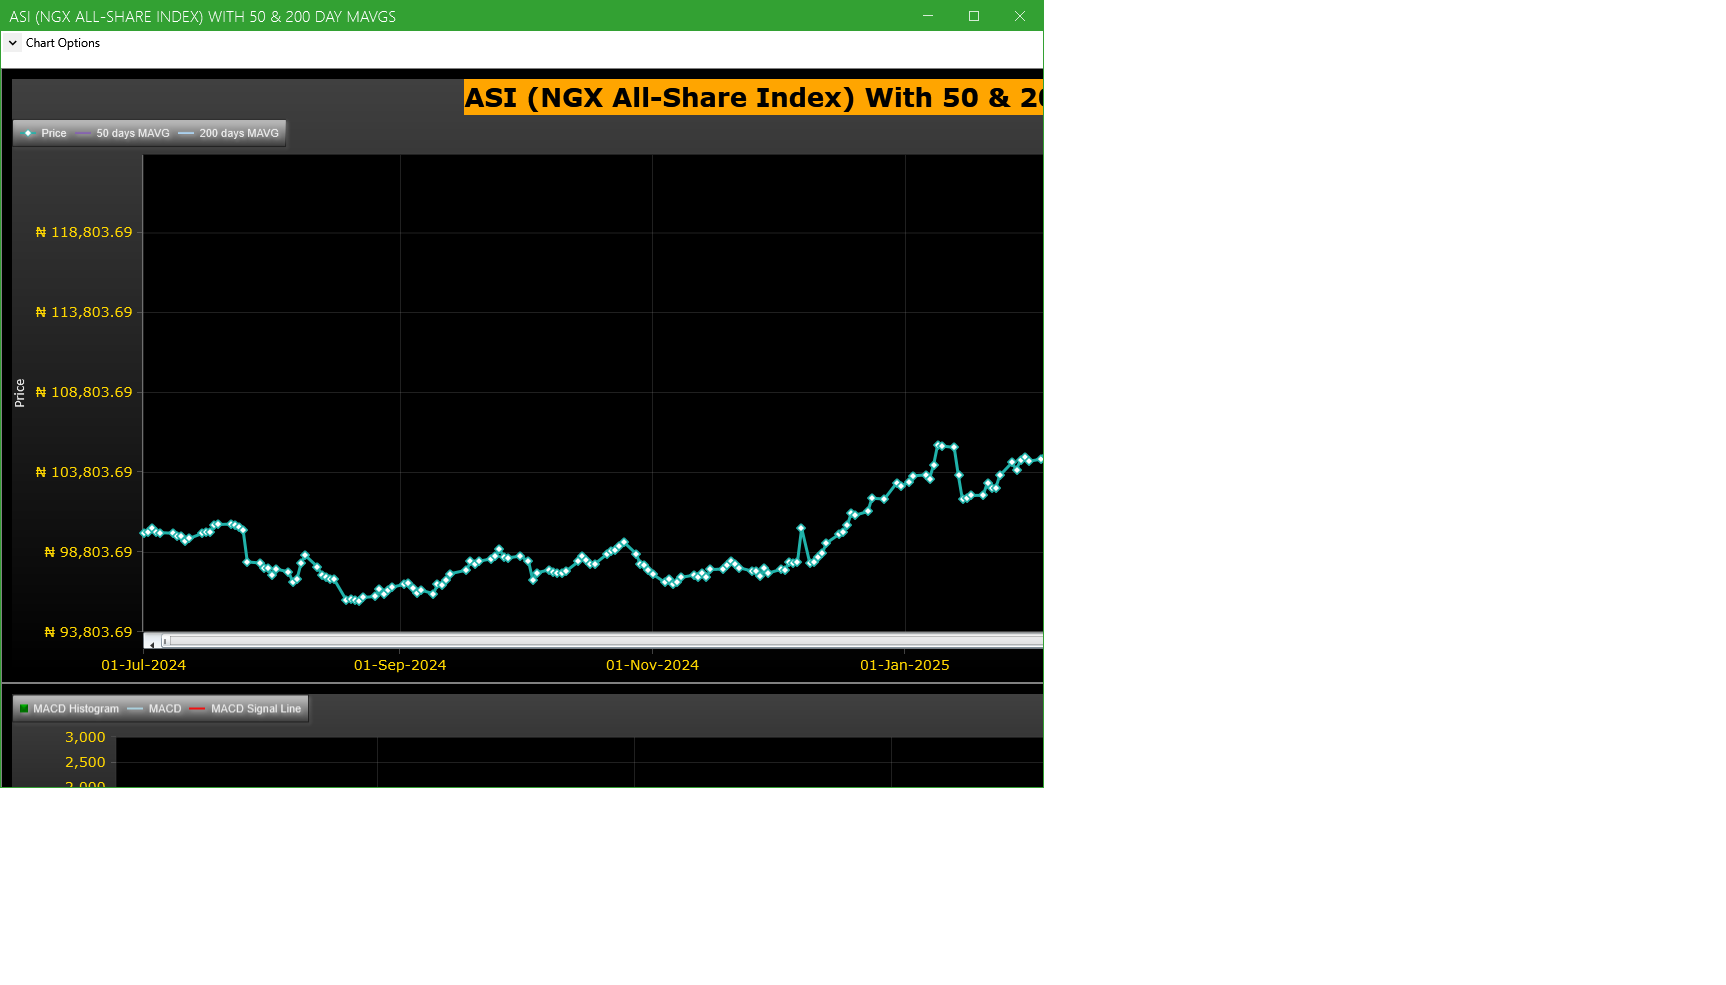
Market Trend - ASI (NGX All-Share-Index) With 50 & 200 Day MAvgs Chart
Technical traders typically use the 50 & 200 day moving averages to aid in choosing
where to enter or exit a position, which then causes these levels to act as strong
support or resistance. As a general guideline, if the price is above a moving average,
the trend is up. If the price is below a moving average, the trend is down.
It is important to note that critics of technical analysis say that moving averages act
as support and resistance because so many traders use these indicators to inform their
trading decisions. Also moving averages tend to work quite well in strong trending conditions
but poorly in choppy or ranging conditions.
Trading Strategies: Crossovers
Crossovers are one of the main moving average strategies. The first type is a price crossover,
which is when the price crosses above or below a moving average to signal a potential change
in trend. Another strategy is to apply two moving averages to a chart: one longer and one
shorter. When the shorter-term MA crosses above the longer-term MA, it is a buy signal, as
it indicates that the trend is shifting up. This is known as a golden cross. Meanwhile, when
the shorter-term MA crosses below the longer-term MA, it is a sell signal, as it indicates that
the trend is shifting down. This is known as a dead/death cross
For more detailed analysis,
- On InfoWARE Market Data Terminal <CI> <GO>
- On InfoWARE Finance Mobile App ( Android , iPhone & iPad and Windows 10) , "Research"
Unusual Volume: Volume traded is more than double the 90 day moving average (All exchanges; ASI & ASem). For more detailed analysis,
- On InfoWARE Market Data Terminal <UV> <GO>
- On InfoWARE Finance Mobile App ( Android , iPhone & iPad and Windows 10)
| Symbol | Name | Volume | 90DAvgVol | %VolChg | Price | LClose | %Chg | Trades | Value |
|---|---|---|---|---|---|---|---|---|---|
| UNIVINSURE | UNIVERSAL INSURANCE COMPANY PLC | 67.33M | 13.68M | 392.36 | 0.62 | 0.60 | 3.33 | 171 | 40.67M |
| CHAMS | CHAMS PLC | 59.74M | 10.05M | 494.50 | 2.50 | 2.34 | 6.84 | 474 | 147.10M |
| JAPAULGOLD | JAPAUL GOLD & VENTURES PLC | 49.46M | 17.84M | 177.23 | 2.99 | 2.72 | 9.93 | 181 | 147.88M |
| VERITASKAP | VERITAS KAPITAL ASSURANCE PLC | 36.27M | 7.47M | 385.31 | 1.04 | 1.03 | 0.97 | 299 | 36.99M |
| FTNCOCOA | FTN COCOA PROCESSORS PLC | 34.81M | 7.04M | 394.88 | 4.86 | 4.42 | 9.95 | 503 | 166.59M |
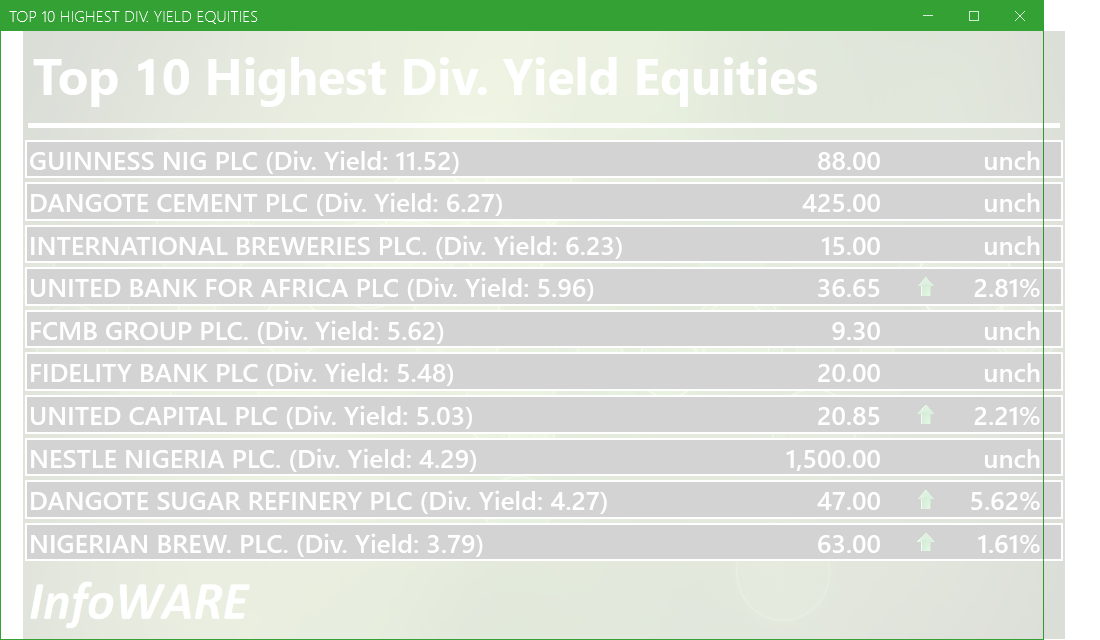
Investment Insights - High Div. Stocks
Dividend stocks distribute a portion of the company earnings to investors on a regular basis and they can a great choice for investors looking for regular income. As an investment or trading strategy, high dividend yield equities provide annual cash payments as against mostly capital gains in the price of a stock. The list in the table below represent the highest dividend paying stocks from the list of the most liquid stocks in the NSE top 30.
For more detailed analysis,
- On InfoWARE Market Data Terminal <HYIELD> <GO>
- On InfoWARE Finance Mobile App ( Android , iPhone & iPad and Windows 10) , "Research"
African Markets
| Name | LClose | Change | %Chg |
|---|---|---|---|
| BRVM Stock Exchange | 306.15 | -2.31 | -0.75 |
| Botswana Stock Exchange | 10,404.95 | 2.08 | 0.02 |
| Egyptian Exchange | 32,820.49 | 114.47 | 0.35 |
| Ghana Stock Exchange | 6,246.35 | 0.00 | 0.00 |
| Johannesburg Stock Exchange | 96,609.38 | -300.42 | -0.31 |
| Lusaka Stock Exchange | 20,145.02 | -58.59 | -0.29 |
| Casablanca Stock Exchange | 18,517.45 | 106.78 | 0.58 |
| Malawi Stock Exchange | 332,086.40 | 2,177.40 | 0.66 |
| Nigeria Stock Exchange | 120,339.90 | 598.71 | 0.50 |
| Nairobi Securities Exchange | 157.86 | 1.28 | 0.82 |
| Namibian Stock Exchange | 1,798.26 | 4.48 | 0.25 |
| Tunis Stock Exchange | 11,574.53 | -15.07 | -0.13 |
| Uganda Securities Exchange | 1,299.04 | -0.91 | -0.07 |
Nigeria Market Indexes
| Symbol | LClose | %Chg | WTD% | MTD% | QTD% | YTD% | MktCap | Trades |
|---|---|---|---|---|---|---|---|---|
| ASI | 120,977.20 | 0.53 | 0.83 | 1.03 | 1.03 | 17.25 | 22,410 | |
| NGX30 | 4,448.47 | 0.46 | 0.57 | -5.83 | -5.83 | 16.61 | 8,803 | |
| NGXAFRBVI | 3,014.02 | 1.69 | 1.90 | -14.94 | -14.94 | 21.49 | 3,641 | |
| NGXAFRHDYI | 20,164.43 | 1.47 | 3.46 | -3.58 | -3.58 | 18.42 | 4,406 | |
| NGXASEM | 1,597.18 | 0.00 | 0.13 | 0.13 | 0.13 | 0.85 | 10 | |
| NGXBNK | 1,297.72 | 1.29 | 1.35 | -14.10 | -14.10 | 19.34 | 4,072 | |
| NGXCG | 3,495.10 | 1.07 | 1.69 | 1.64 | 1.64 | 23.54 | 9,599 | |
| NGXCNSMRGDS | 2,715.33 | 0.74 | 3.02 | -21.72 | -21.72 | 56.56 | 2,812 | |
| NGXCOMMDTY | 1,047.37 | 0.00 | 0.02 | 0.01 | 0.01 | 4.73 | ||
| NGXGROWTH | 9,931.44 | 0.11 | 5.43 | 4.44 | 4.44 | 27.94 | 434 | |
| NGXINDUSTR | 3,609.64 | 0.34 | -0.78 | 2.46 | 2.46 | 1.06 | 2,009 | |
| NGXINS | 783.86 | 2.76 | 3.75 | 6.13 | 6.13 | -0.30 | 1,696 | |
| NGXLOTUSISLM | 9,304.59 | 0.28 | 0.81 | -2.82 | -2.82 | 33.54 | 2,438 | |
| NGXMAINBOARD | 5,969.46 | 0.64 | 1.37 | 1.20 | 1.20 | 19.29 | 18,111 | |
| NGXMERIGRW | 8,322.93 | 1.45 | 2.13 | -13.77 | -13.77 | 27.59 | 2,670 | |
| NGXMERIVAL | 11,504.07 | 1.03 | 3.17 | -3.71 | -3.71 | 10.29 | 4,759 | |
| NGXOILGAS | 2,443.86 | 0.69 | 0.26 | 2.16 | 2.16 | -9.86 | 394 | |
| NGXPENBRD | 2,191.69 | 0.48 | 0.54 | -4.68 | -4.68 | 19.66 | 16,801 | |
| NGXPENSION | 5,859.54 | 0.75 | 1.05 | -7.79 | -7.79 | 29.24 | 10,269 | |
| NGXPREMIUM | 11,549.70 | 0.31 | -0.23 | 0.70 | 0.70 | 18.67 | 3,865 | |
| NGXSOVBND | 654.79 | 0.20 | 0.27 | 0.20 | 0.20 | 8.85 | 0 |
For more detailed analysis,
- On InfoWARE Market Data Terminal <MKTINS> <GO>
- On InfoWARE Finance Mobile App ( Android, iPhone & iPad and Windows 10) , "Market Indexes"
Find the topic interesting? Will like to comment? Contact Us at solutions@infowarelimited.com
Top News

Chart Of The Day - ASI Chart Vs ASI Advance Decline Line (YTD) (03-Jul-2025 15:10:28.129)
InfoWARE AI Analyst Daily Market Report: 03-Jul-2025

[XNSA]>> TRADING ACCOUNT POSITIONS
[XNSA]>> CORDROS MILESTONE FUNDS' BID & OFFER PRICES
[XNSA]>> EMERGING AFRICA DAILY FUND PRICES
[XNSA]>> RESIGNATION OF A DIRECTOR (FSDH CAPITAL LIMITED)
[VSPBONDETF]>> DAILY INDICATIVE PRICES
[XNSA]>> NGX FIXED INCOME INDICATIVE PRICE LIST FOR JUL 03, 2025
[XNSA]>> CIS TRAINING ON "RETIREMENT PLANNING AND WEALTH CREATION & MANAGEMENT
[XNSA]>> CLOSING GONG CEREMONY
[XNSA]>> APPOINTMENT OF A DIRECTOR (ANCHORIA SECURITIES LIMITED)
[CILEASING]>>Corporate Disclosures-<C AND I LEASING PLC.>
Chart Of The Day - ASI Chart Vs ASI Advance Decline Line (YTD) (02-Jul-2025 15:07:10.584)
InfoWARE AI Analyst Daily Market Report: 02-Jul-2025
[MORISON]>>Notice of Meeting -<MORISON INDUSTRIES PLC.>
[UBA]>>Notice of Meeting -<UNITED BANK FOR AFRICA PLC>
[RONCHESS]>>Corporate Disclosures-<RONCHESS GLOBAL RESOURCES PLC>
[XNSA]>> DAILY FUND PRICE SUBMISSION - FCMB ASSET MANAGEMENT LIMITED
[AFRIPRUD]>> Earning Forcast - <Q3-2025> ?-<AFRICA PRUDENTIAL PLC>
[VSPBONDETF]>> DAILY INDICATIVE PRICES
[XNSA]>> CIS TRAINING ON "RETIREMENT PLANNING AND WEALTH CREATION & MANAGEMENT
[XNSA]>> CLOSING GONG CEREMONY
[XNSA]>> NGX FIXED INCOME INDICATIVE PRICE LIST FOR JUL 02, 2025
[SIAMLETF40]>> DAILY INDICATIVE PRICES
[AFRIPRUD]>>Notice of Meeting -<AFRICA PRUDENTIAL PLC>
[NAHCO]>>Notice of Meeting -<NIGERIAN AVIATION HANDLING COMPANY PLC>
[XNSA]>> NOTIFICATION OF PRICE ADJUSTMENT

MARKET PERFORMANCE REPORT & DAILY PRICE LIST
DAILY MARKET UPDATE FOR 1ST JULY 2025

Market Summary 01-07-2025
Get IDIA - the stock trading app for the modern investor
Solutions by Business
Product Suites
Company
Contacts
- 8th Floor,
- South Atlantic Petroleum Towers,
- 1 Adeola Odeku Street,
- Victoria Island,
- Lagos, Nigeria.
- Email: solutions@infowarelimited.com
Follow Us
 |
 |
 |
 |