


InfoWARE AI Analyst Daily Market Report: 02-Jul-2025 | InfoWARE Finance
Get IDIA - the stock trading app for the modern investor


InfoWARE AI Analyst Daily Market Report: 02-Jul-2025
(Source: InfoWARE Terminal, Date: 02-Jul-2025)
Dear Investor,
NGX Daily Market Summary – Wednesday, July 2, 2025
Market Overview
The Nigerian equities market rebounded modestly today, with the All Share Index (NGX ASI) climbing +0.50% to close at 119,741.23. Year-to-date, the ASI is up 16.63%. Trading activity was robust, with total volume surging to 1.02B shares—nearly double the prior session—though turnover dipped marginally by -0.41% to ₦11.23B. Market breadth was firmly positive (3.26x), powered by 62 advancers versus 19 decliners, as 89 stocks saw upticks in volumes. The day’s top performer was VSPBONDETF, soaring +41.94%, while CILEASING suffered a -10.00% loss. Unusual volume and sector rotation signals point to active repositioning by institutions, especially in select ETFs and agricultural stocks.
Key Trends in Market Breadth
- Advancers: 62 stocks (including several with double-digit gains, showing strong bullish participation)
- Decliners: Just 19, revealing a broad-based rally.
- Volume Trends: Volume surged in 89 companies (notably VSPBONDETF, ELALAHKES, ROYALEX), confirming broad market participation.
- Market sentiment benefited from a 0.25% appreciation of the Naira against the Dollar, ending at 1,533/$.
Top Gainers and Losers – Today
| Gainers | Symbol | % Change | Sector | RSI |
|---|---|---|---|---|
| VETIVA S & P NIGERIA SOV BOND ETF | VSPBONDETF | +41.94% | ETF | 50.6 |
| C&I LEASING | CILEASING | +10.00% | Support/Logistics | 51.7 |
| CUTIX | CUTIX | +10.00% | Electrical | 74.8 |
| ELLAH LAKES | ELLAHLAKES | +10.00% | Crop Production | 87.5 |
| INT’L ENERGY INSURANCE | INTENEGINS | +10.00% | Insurance | 60.0 |
| Losers | Symbol | % Change | Sector | RSI |
|---|---|---|---|---|
| GREENWICH ASSET ETF | GREENWETF | -10.00% | ETF | 23.9 |
| DEAP CAPITAL | DEAPCAP | -9.09% | Other Financials | 66.2 |
| JOHN HOLT | JOHNHOLT | -5.41% | Diversified | 64.3 |
| DANGOTE SUGAR | DANGSUGAR | -5.32% | Food Products | 67.6 |
| UNIVERSAL INSURANCE | UNIVINSURE | -4.76% | Insurance | 67.1 |
Most Noteworthy Gainer/Losses Insights
- ELLAHLAKES (+10%, RSI: 87.5) not only topped the advancers list, but also shows severe overbought conditions – both a positive momentum signal and a caution flag.
- VSPBONDETF (+41.94%) had an exceptional move with massive volume (over 2x its 90-day average), indicating possible institutional repositioning into bond ETFs.
- GREENWETF (-10%, Unusual Volume) featuring both in top losers and highest unusual volume. Its very low RSI (23.9) and huge volume may point to a capitulation low, potentially yielding a contrarian buy signal for risk-tolerant investors.
- CILEASING (+10%, new bullish momentum) entered the bullish momentum table — consider as a short-term breakout play.
Short-Term Opportunities and Risks – Based on Momentum & RSI
- ELLAHLAKES, NEIMETH, CAVERTON, FTNCOCOA– These four are YTD top gainers with RSI above 70, showing strong momentum but also overbought risks. Suitable for momentum traders but not ideal for fresh long-term entries.
- CILEASING and CHAMS: Experienced a close above the 15DMA with moderate-to-high RSI, suggesting an uptrend confirmed by buying pressure.
- GREENWETF: RSI below 30 (23.9), sizable volume, and a sharp one-day drop (-10%). This ETF is deeply oversold; aggressive traders may consider bounce trades.
- GTCO, STANBIC, NEWGOLD: Each signaled bearish momentum, having closed below 15DMA. GTCO in particular has seen a steady drop in recent days and merits caution.
Contrarian Signals
- GREENWETF: Extreme RSI low (23.9) and -53.4% YTD, coupled with a volume spike. Contrarians could see buying exhaustion and anticipate a technical rebound.
- CUTIX: RSI at 74.8 (overbought), but MACD is only marginally positive, suggesting that momentum could fade soon.
- TRANSPOWER: Closed above 15DMA, but lingering negative YTD (-11%) and MACD readings suggest the move may be a "dead cat bounce” rather than sustainable reversal.
Sector Heatmap
| Sector | Top Performer | Worse Performer | Color | Key Trend |
|---|---|---|---|---|
| ETF | VSPBONDETF (+41.94%) | GREENWETF (-10%) | Green | High volatility, major rotation; Bond ETF outperformed as equity ETF fell sharply. |
| Crop Production | ELLAHLAKES (+10%) | - | Yellow | Continued strength, extreme momentum (RSI 87+). |
| Banking | ZENITHBANK (+1.69%) | GTCO (-0.31%) | Red | Mixed, some profit-taking after Q2 rally; GTCO momentum fades below 15DMA. |
| Support/Logistics | CILEASING (+10%) | - | Blue | Breakout on bullish signals, watch for follow-through; CAVERTON also strong on YTD table. |
| Insurance | INTENEGINS/EllahLakes (also "Assurance” strong) | UNIVINSURE (-4.76%) | Purple | Bifurcated — speculative buying but high turnover in laggards. |
Dividend-Beta Matrix (Defensive Stocks)
| Symbol | Name | Div. Yield | Beta | Sector | Commentary |
|---|---|---|---|---|---|
| AFRIPRUD | Africa Prudential | 1.27% | 0.64 | Other Financial | High yield, low beta; attractive for risk-averse/income portfolios; respect positive 15DMA crossover. |
| LAFARGE WAPCO | WAPCO | 2.70% | ~0.72 | Building Materials | Strong DMA cross and low beta; consider as quality cyclical defensive with income. |
| UCAP | United Capital | 5.03% | 0.74 | Other Financials | High yield, positive price breakout; possible safe haven amid volatility. |
Institutional Clustering Alerts
- ZENITHBANK: 7.51% of institutional trade value and 16.3M shares, nearly half of all institutional volumes in the sector. This clustering can lead to sustained momentum on further buy pressure; a top asset for "follow the flows” strategies.
- ELLAHLAKES: Uncharacteristically high institutional trade value (N584M on 83.5M shares). The exceptional surge (+10%, RSI 87.5) also saw heavy retail interest. Such dual interest could magnify volatility.
- ACCESSCORP, OANDO, JAPAULGOLD: Also within top-5 clusters, warranting attention as these often precede sector-wide moves.
Top 5 YTD Gainers and Losers (YTD Return)
| Top 5 YTD Gainers | YTD %Chg | Sector | RSI |
|---|---|---|---|
| THE INITIATES PLC (TIP) | +288.00% | Growth | 87.0 |
| NEIMETH | +214.34% | Pharmaceuticals | 92.7 |
| ELLAHLAKES | +206.98% | Crop Production | 87.5 |
| CAVERTON | +172.16% | Support/Logistics | 84.7 |
| FTN COCOA | +135.11% | Crop Production | 74.3 |
| Top 5 YTD Losers | YTD %Chg | Sector | RSI |
|---|---|---|---|
| GREENWETF | -53.44% | ETF | 23.9 |
| JBERGER | -27.86% | Infra/Construction | 29.0 |
| OANDO | -20.44% | Oil & Gas | 47.1 |
| DEAPCAP | -16.67% | Other Financials | 66.2 |
| UPL | +43.90% | Printing/Publishing | 43.7 |
Market Activity Summary: Retail vs Institutional Flow
- Institutional investors accounted for 40.2% of trade count, but controlled 71.9% of volumes and 82.2% of value—implying targeted, large-ticket block trades (notably in ETFs and select agri/logistics stocks).
- Retail activity was more fragmented, comprising nearly 60% of total trades but only 28.1% of volumes and 17.9% of value. This suggests retail investors focused on smaller-cap stocks and speculative targets.
- Top 5 Institutional Trades: ELLAHLAKES, ACCESSCORP, ZENITHBANK, OANDO, JAPAULGOLD. Heavy focus on agri/logistics, banks, and energy stocks hints at sector rotation and portfolio rebalancing.
- Top 5 Retail Trades: ELLAHLAKES (again, highly speculative), OANDO, ACCESSCORP, GTCO, MTNN. Overlap with institutional names confirms that ELLAHLAKES is a striking "conviction trade” across both classes, usually driving outsized volatility next session.
- Pattern Note: ELLAHLAKES presence in both top institutional and retail traded lists—plus its RSI 87.5 and 10% price surge—signals high probability of near-term volatility.
Stocks With Unusual Volume (Potential Turning Points)
- ROYAL EXCHANGE (ROYALEX): Volume was 31x its 90-day average, rallying +9.65%. High volume on a gain often signals sustainable accumulation.
- THOMASWY: Volume up 19x, also on the top YTD loser list. Rose 10% today; watch for reversal plays.
- GREENWETF & VETBANK ETFs: Both saw over 20x their usual volumes, underscoring unusual institutional rotation.
Traders’ Playbook: Opportunities & Cautions
- Momentum trades: Focus on top gainers with high RSI but watch for reversals (ELLAHLAKES, NEIMETH now technically overbought).
- Rebound Play: Contrarian traders consider GREENWETF and THOMASWY after huge volume washout and deeply oversold RSI.
- Bearish Developments: GTCO and STANBIC, both financial heavyweights, have confirmed momentum breakdowns (below 15DMA). Beware further weakness in banking sector.
- Defensive Buys: Income-seekers should watch UCAP and AFRIPRUD for high dividend, low beta defensive attributes.
- Extreme Momentum Trap: ELLAHLAKES is "crowded” by retail/institutional interest; only suitable for tactical, not strategic, positions until volatility cools.
Summary Table – 15DMA/50DMA Cross: Bullish & Bearish Momentum
| Bullish | %Chg1Dy | RSI | MACD/Signal | 15DMA | 50DMA | Sparkline |
|---|---|---|---|---|---|---|
| VSPBONDETF | +41.94% | 50.6 | 4.85/7.70 | 324.1 | 295.9 | 📈 |
| ELLAHLAKES | +10.00% | 87.5 | 1.11/0.79 | 6.13 | 4.10 | 📈 |
| CILEASING | +10.00% | 51.7 | 0.16/0.16 | 4.66 | 4.23 | 📈 |
| UCAP | +6.25% | 52.7 | 0.14/0.24 | 19.38 | 18.64 | 📈 |
| AFRIPRUD | +6.41% | 43.2 | -0.1137/-0.1503 | 16.04 | 16.10 | 📈 |
| Bearish | %Chg1Dy | RSI | MACD/Signal | 15DMA | 50DMA | Sparkline |
|---|---|---|---|---|---|---|
| GTCO | -0.31% | 40.4 | 3.64/3.66 | 80.3 | 71.1 | 📉 |
| STANBIC | -2.35% | 43.1 | 4.70/4.83 | 84.4 | 71.5 | 📉 |
| NEWGOLD | -1.79% | 89.0 | 717.0/710.9 | 55,573 | 54,327 | 📉 |
Hidden Insights & Actionable Takeaways
- ETF Volatility: Extreme moves and outsized volumes in several ETFs (VSPBONDETF up, GREENWETF down—both with 20x normal volume) indicate major institutional rotation. A sign asset allocation strategies are being rebalanced at mid-year.
- Market breadth is solidly bullish: even as some heavyweight banks fade, overall net advancers and volume upswings point to still-healthy secondary participation.
- RSI Warnings: Multiple top names (ELLAHLAKES, NEIMETH) are statistically overbought. Tread carefully and use trailing stops if chasing extended plays.
- Unusual volume breakouts: When accompanied by trend signals (15DMA cross, positive MACD) like CILEASING, these can signal durable moves.
- Defensive Stocks: High-yield, low-beta names with recent 15DMA crossovers (AFRIPRUD, UCAP) should form the core of any risk-managed, income-focused portfolio.
- Sector rotation: Crop production/agro stocks and select ETFs are clear institutional favorites this session.
- Turnover drop (-0.41%): Despite strong price action and rising volumes, the dip in traded value may suggest more speculative trading and possibly a reluctance by big money to chase at elevated valuations—an early caution for sentiment.
Final Suggestions for Traders
- Momentum Chasers: Prioritize positions where price, volume and momentum align—example: VSPBONDETF, CILEASING, and ELLAHLAKES (with prudent stops!).
- Contrarians/Reversal Seekers: Watch oversold ETFs like GREENWETF and high-volume YTD losers (THOMASWY) for technical bounces.
- Banks: Exercise caution in GTCO and STANBIC (bearish signals and DMA breakdowns, lighter institutional flows). Wait for reversal confirmations if re-entering.
- Income Investors: Accumulate high-yield, low-beta stocks with bullish technicals (AFRIPRUD, UCAP).
- Be mindful of crowded trades (ELLAHLAKES), as they can be magnets for profit-taking or "rug pull” reversals after such steep, rapid gains.
Data-driven market intelligence by your InfoWARE analyst | July 2, 2025
|
Top ASI Gainers Over Last 5 Trading Days
|
Top ASI Losers Over Last 5 Trading Days
|
For more detailed analysis, on InfoWARE Market Data Terminal <NSEPERF> <GO>
On InfoWARE Finance Mobile App (Android, iPhone & iPad, Windows Phone and Windows 8/10), "Top Gainers & Losers"
VETIVA S & P NIGERIA SOVEREIGN BOND ETF (VSPBONDETF) topped the advancers list closing at N440.00 with a gain of 41.94% followed by C & I LEASING PLC. (CILEASING) which closed at N5.06 with a gain of 10.00%.
On the flip side GREENWICH ASSET ETF (GREENWETF) and DEAP CAPITAL MANAGEMENT & TRUST PLC (DEAPCAP) topped the decliners log with a loss of -10.00% at a close of N248.58, and -9.09% to close the day at N1.00 respectively.
| Symbol | LClose | %Chg |
|---|---|---|
| VSPBONDETF | 440.00 | 41.94 |
| CILEASING | 5.06 | 10.00 |
| CUTIX | 3.96 | 10.00 |
| ELLAHLAKES | 9.24 | 10.00 |
| INTENEGINS | 1.98 | 10.00 |
| Symbol | LClose | %Chg |
|---|---|---|
| GREENWETF | 248.58 | -10.00 |
| DEAPCAP | 1.00 | -9.09 |
| JOHNHOLT | 7.00 | -5.41 |
| DANGSUGAR | 44.50 | -5.32 |
| UNIVINSURE | 0.60 | -4.76 |
For more detailed analysis,
- On InfoWARE Market Data Terminal <TOPG> <GO>
- On InfoWARE Finance Mobile App ( Android, iPhone & iPad and Windows 10) , "Top Gainers & Losers"
Currency Market
In the currency market, the Naira appreciated 0.30%(4.70) against the Dollar to settle at 1 to 1NSE: Bull Signal - Price crossed above 15 Day MA
This signal implies these stocks are under buying pressure and the price might continue to rise and therefore positions should be monitored closely. Further suggested analysis include looking at the overall market (ASI) to see if the uptrend is market wide, sector wide or specific to the stock. Portfolio managers tend to use this as a signal to do more research to add to their positions or lock in some profits. Typically further analysis should be done using commands like PC and RV on the InfoWARE Market Data Terminal. Another command is ALERTS to set price triggers for possible exit or entry as necessary
For more detailed analysis,
- On InfoWARE Market Data Terminal <NSEPERF> <GO>
- On InfoWARE Finance Mobile App ( Android , iPhone & iPad and Windows 10) , "Top Gainers & Losers"
| Symbol | Price | %Chg | 15DMA | PE | EPS | DivY | MktCap | Vol | Trades | Value | LstTradeTime |
|---|---|---|---|---|---|---|---|---|---|---|---|
| VSPBONDETF | 440.00 | 29.55 | 324.10 | 0.00 | 0.00 | 64.00 | 1.00 | 28.16K | 02-Jul-2025 14:31:42.927 | ||
| CILEASING | 5.06 | 9.09 | 4.66 | 6.50 | 0.64 | 1.20 | 3.96B | 3.52M | 108.00 | 17.60M | 02-Jul-2025 14:30:47.680 |
| ABCTRANS | 2.69 | 8.92 | 2.61 | 6.68 | 0.17 | 2.19 | 6.44B | 244.47K | 13.00 | 657.26K | 02-Jul-2025 14:30:46.767 |
| LASACO | 3.20 | 6.88 | 3.05 | 21.56 | 0.11 | 4.05 | 5.87B | 5.06M | 138.00 | 16.09M | 02-Jul-2025 14:30:49.487 |
| AFRIPRUD | 16.60 | 6.02 | 16.04 | 19.57 | 0.61 | 1.27 | 33.20B | 2.30M | 194.00 | 36.71M | 02-Jul-2025 14:30:46.953 |
| CHAMS | 2.34 | 5.98 | 2.21 | 27.02 | 0.07 | 1.56 | 10.99B | 37.58M | 357.00 | 87.14M | 02-Jul-2025 14:31:41.647 |
| UCAP | 20.40 | 5.88 | 19.38 | 19.15 | 0.93 | 5.03 | 122.40B | 6.07M | 278.00 | 121.45M | 02-Jul-2025 14:30:54.047 |
| WAPCO | 90.15 | 2.94 | 88.36 | 24.60 | 2.87 | 2.70 | 1,452.12B | 996.01K | 185.00 | 88.59M | 02-Jul-2025 14:31:59.183 |
| PZ | 36.00 | 2.78 | 35.55 | 44.17 | 0.50 | 4.59 | 142.94B | 2.88M | 180.00 | 103.99M | 02-Jul-2025 14:30:52.677 |
| NGXINDUSTR | 3,597.41 | 0.51 | 3,586.54 | 39.90 | 18.97 | 0.00 | 0.00 | 20.29M | 1,726.00 | 470.33M | 02-Jul-2025 14:31:11.310 |
| NGXSOVBND | 653.51 | 0.00 | 653.29 | 0.00 | 0.00 | 0.00 | 0.00 | 80.00 | 1.00 | 95.99K | 02-Jul-2025 14:31:11.513 |
| TRANSPOWER | 320.00 | 0.00 | 319.51 | 0.00 | 0.00 | 0.42 | 0.00 | 19.06K | 47.00 | 5.49M | 02-Jul-2025 14:30:53.847 |
NSE: BEAR Signal - Price crossed below 15 Day MA
This signal implies these stocks are under selling pressure and the price might continue to slide and therefore positions should be monitored closely. Further suggested analysis include looking at the overall market (ASI) to see if the downtrend is market wide, sector wide or specific to the stock. If the overal market trend is upwards, then since these stocks are heading in the opposite direction, then further analysis should be done using commands like PC and RV on the InfoWARE Market Data Terminal. Another command is ALERTS to set price triggers for possible exit is necessar
For more detailed analysis,
- On InfoWARE Market Data Terminal <BEARM> <GO>
- On InfoWARE Finance Mobile App ( Android , iPhone & iPad and Windows 10)
| Symbol | Price | %Chg | 15DMA | PE | EPS | DivY | MktCap | Vol | Trades | Value | LstTradeTime |
|---|---|---|---|---|---|---|---|---|---|---|---|
| STERLINGNG | 5.60 | 2.32 | 5.61 | 15.75 | 0.30 | 3.19 | 161.23B | 5.78M | 258.00 | 32.23M | 02-Jul-2025 14:30:53.323 |
| GTCO | 80.00 | -0.31 | 80.30 | 7.49 | 7.10 | 1.88 | 2,354.49B | 8.39M | 828.00 | 673.87M | 02-Jul-2025 14:30:48.913 |
| NEWGOLD | 54,999.99 | -1.82 | 55,573.33 | 0.00 | 0.00 | 0.00 | 0.00 | 29.00 | 8.00 | 1.55M | 02-Jul-2025 14:31:42.700 |
| STANBIC | 83.00 | -2.41 | 84.41 | 6.87 | 8.23 | 3.54 | 1,075.43B | 919.06K | 135.00 | 76.17M | 02-Jul-2025 14:30:53.260 |
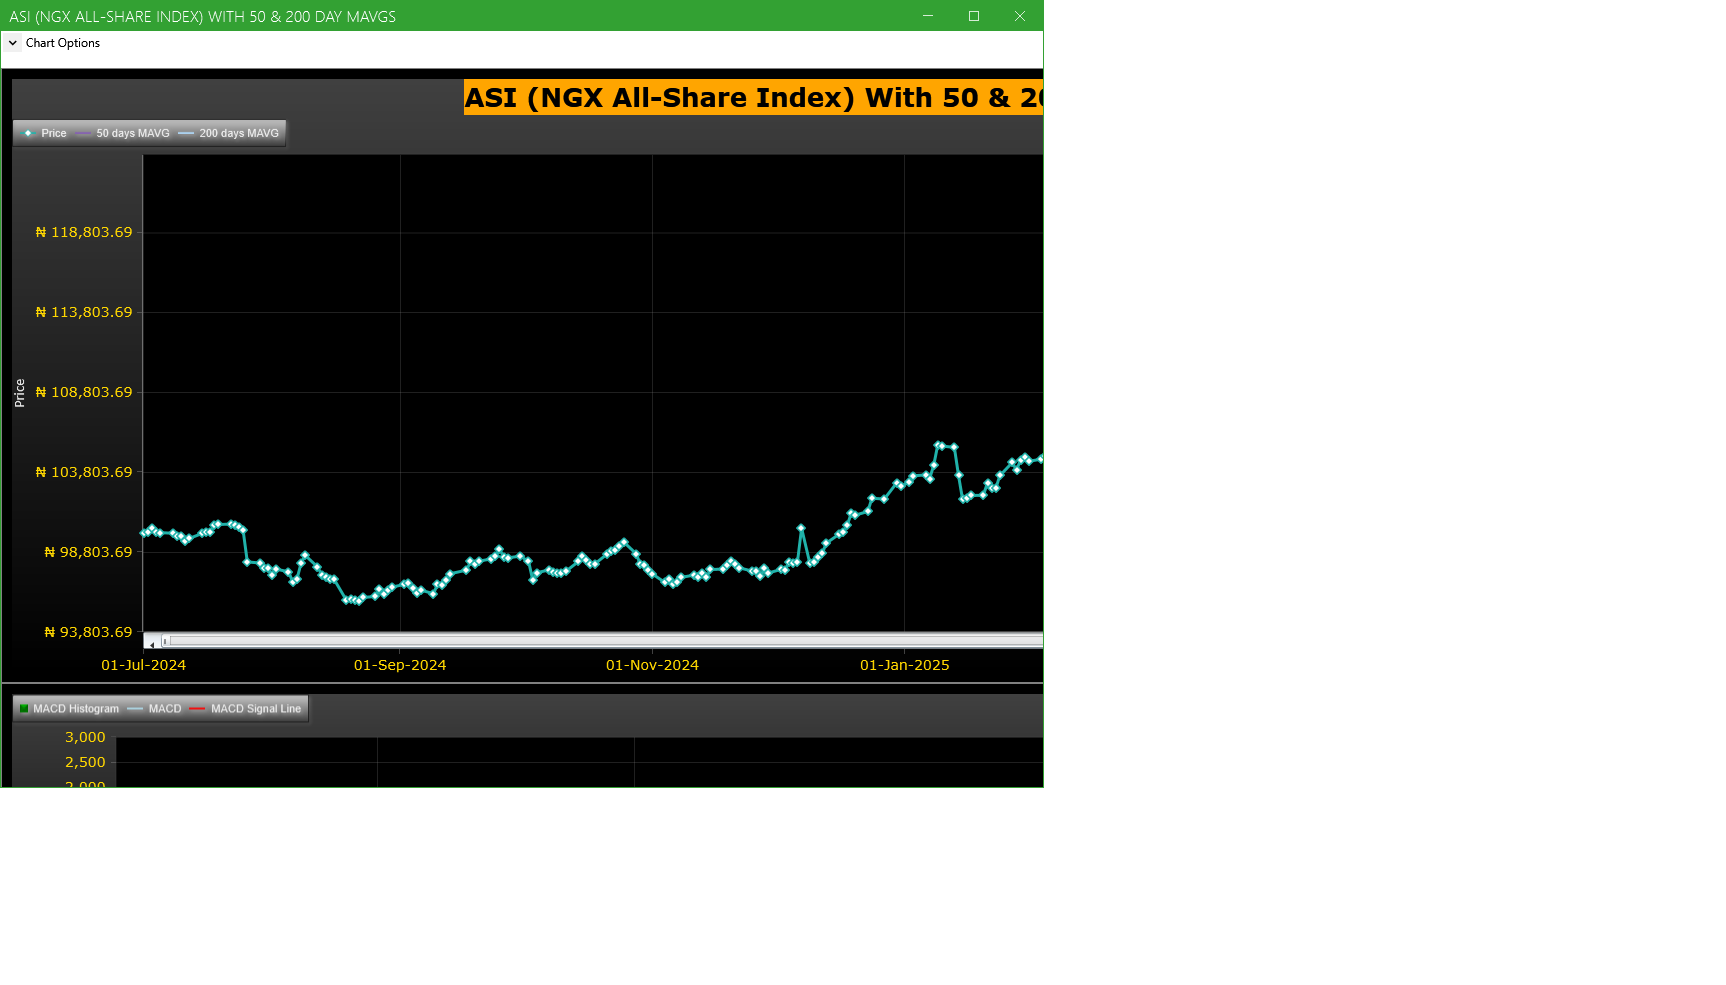
Market Trend - ASI (NGX All-Share-Index) With 50 & 200 Day MAvgs Chart
Technical traders typically use the 50 & 200 day moving averages to aid in choosing
where to enter or exit a position, which then causes these levels to act as strong
support or resistance. As a general guideline, if the price is above a moving average,
the trend is up. If the price is below a moving average, the trend is down.
It is important to note that critics of technical analysis say that moving averages act
as support and resistance because so many traders use these indicators to inform their
trading decisions. Also moving averages tend to work quite well in strong trending conditions
but poorly in choppy or ranging conditions.
Trading Strategies: Crossovers
Crossovers are one of the main moving average strategies. The first type is a price crossover,
which is when the price crosses above or below a moving average to signal a potential change
in trend. Another strategy is to apply two moving averages to a chart: one longer and one
shorter. When the shorter-term MA crosses above the longer-term MA, it is a buy signal, as
it indicates that the trend is shifting up. This is known as a golden cross. Meanwhile, when
the shorter-term MA crosses below the longer-term MA, it is a sell signal, as it indicates that
the trend is shifting down. This is known as a dead/death cross
For more detailed analysis,
- On InfoWARE Market Data Terminal <CI> <GO>
- On InfoWARE Finance Mobile App ( Android , iPhone & iPad and Windows 10) , "Research"
Unusual Volume: Volume traded is more than double the 90 day moving average (All exchanges; ASI & ASem). For more detailed analysis,
- On InfoWARE Market Data Terminal <UV> <GO>
- On InfoWARE Finance Mobile App ( Android , iPhone & iPad and Windows 10)
| Symbol | Name | Volume | 90DAvgVol | %VolChg | Price | LClose | %Chg | Trades | Value |
|---|---|---|---|---|---|---|---|---|---|
| ROYALEX | ROYAL EXCHANGE PLC. | 218.70M | 6.73M | 3,150.33 | 1.25 | 1.14 | 9.65 | 117 | 229.11M |
| JAPAULGOLD | JAPAUL GOLD & VENTURES PLC | 174.09M | 14.99M | 1,061.59 | 2.72 | 2.48 | 9.68 | 458 | 473.44M |
| ELLAHLAKES | ELLAH LAKES PLC. | 83.47M | 14.13M | 490.60 | 9.24 | 8.40 | 10.00 | 1,111 | 762.23M |
| WEMABANK | WEMA BANK PLC. | 71.13M | 5.76M | 1,134.38 | 15.45 | 15.00 | 3.00 | 270 | 1.07B |
| CHAMS | CHAMS PLC | 37.58M | 9.60M | 291.59 | 2.34 | 2.20 | 6.36 | 357 | 87.14M |
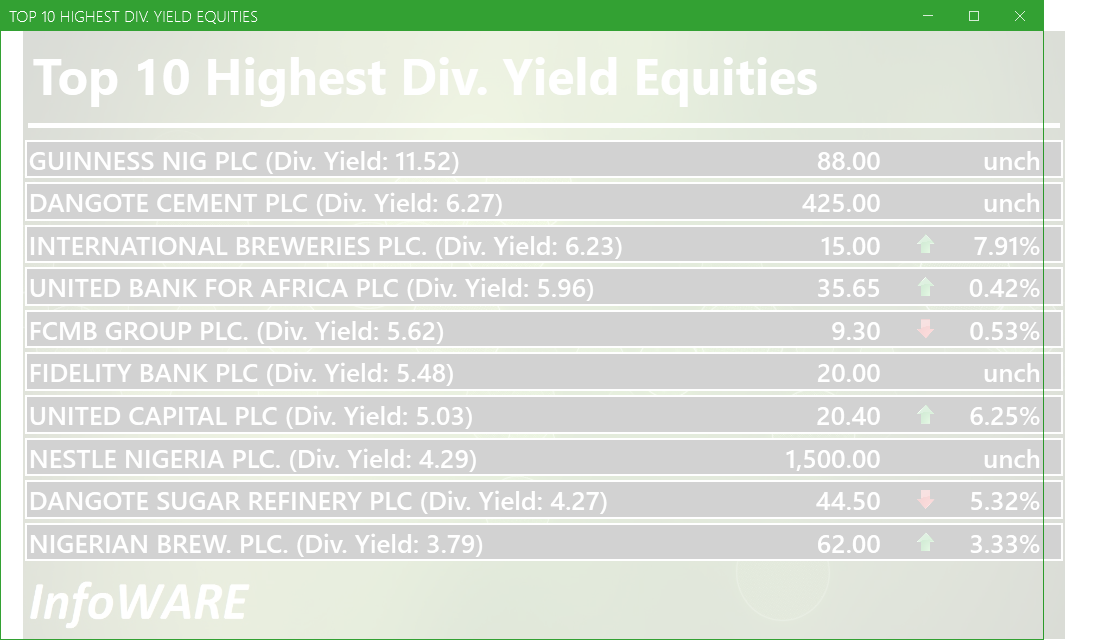
Investment Insights - High Div. Stocks
Dividend stocks distribute a portion of the company earnings to investors on a regular basis and they can a great choice for investors looking for regular income. As an investment or trading strategy, high dividend yield equities provide annual cash payments as against mostly capital gains in the price of a stock. The list in the table below represent the highest dividend paying stocks from the list of the most liquid stocks in the NSE top 30.
For more detailed analysis,
- On InfoWARE Market Data Terminal <HYIELD> <GO>
- On InfoWARE Finance Mobile App ( Android , iPhone & iPad and Windows 10) , "Research"
Investment Insights - Stocks outperforming the ASI but with approximately the same risk
These list of stocks represent equities that are less risky than the ASI but doing better than the ASI (All Shares Index) using the YTD (Year to Date) returns as the measure. The risk is measured by Beta. Beta is an assessment of a stock's tendency to undergo price changes, (its volatility), as well as its potential returns compared to the ASI. It is expressed as a ratio, where a score of 1 represents performance comparable to the ASI, and returns above or below the market may receive scores greater or lower than 1.
For a full list of both positively and negatively corelated stocks visit InfoWARE Market Data Terminal
- On InfoWARE Market Data Terminal <BANL> <GO>
- On InfoWARE Finance Mobile App ( Android , iPhone & iPad and Windows 10)
| Symbol | DivYield | PE | EPS | Beta | %ChgYTD | ASIYTDReturn | BetaDiff |
|---|---|---|---|---|---|---|---|
| HONYFLOUR | 1.40 | 16.28 | 0.31 | 0.99 | 275.72 | 16.63 | 0.01 |
| CAVERTON | 5.52 | 1.15 | 1.57 | 0.98 | 172.16 | 16.63 | 0.02 |
| FIDELITYBK | 5.48 | 13.24 | 1.17 | 0.89 | 17.65 | 16.63 | 0.11 |
| FTNCOCOA | 1.60 | 0.00 | 0.00 | 0.79 | 135.11 | 16.63 | 0.21 |
| NB | 3.79 | 16.95 | 1.60 | 0.79 | 93.75 | 16.63 | 0.21 |
| MAYBAKER | 3.75 | 58.94 | 0.14 | 0.78 | 97.34 | 16.63 | 0.22 |
| UNILEVER | 2.81 | 67.09 | 0.40 | 0.75 | 43.61 | 16.63 | 0.25 |
| VETGOODS | 0.00 | 0.71 | 52.33 | 16.63 | 0.29 | ||
| VETGRIF30 | 0.00 | 0.71 | 17.09 | 16.63 | 0.29 | ||
| CUTIX | 6.52 | 8.81 | 0.26 | 0.70 | 56.52 | 16.63 | 0.30 |
African Markets
| Name | LClose | Change | %Chg |
|---|---|---|---|
| BRVM Stock Exchange | 308.45 | -3.59 | -1.15 |
| Egyptian Exchange | 32,707.22 | -151.15 | -0.46 |
| Johannesburg Stock Exchange | 96,911.38 | 482.15 | 0.50 |
| Lusaka Stock Exchange | 20,204.37 | -10.11 | -0.05 |
| Casablanca Stock Exchange | 18,411.21 | 115.26 | 0.63 |
| Malawi Stock Exchange | 329,924.28 | 0.00 | 0.00 |
| Nigeria Stock Exchange | 119,741.23 | -251.99 | -0.21 |
| Nairobi Securities Exchange | 156.58 | 3.15 | 2.05 |
| Namibian Stock Exchange | 1,793.75 | 6.43 | 0.36 |
| Tunis Stock Exchange | 11,589.67 | 12.73 | 0.11 |
| Uganda Securities Exchange | 1,299.97 | 12.36 | 0.96 |
Nigeria Market Indexes
| Symbol | LClose | %Chg | WTD% | MTD% | QTD% | YTD% | MktCap | Trades |
|---|---|---|---|---|---|---|---|---|
| ASI | 120,339.90 | 0.50 | 0.30 | 0.50 | 0.50 | 16.63 | 20,521 | |
| NGX30 | 4,428.04 | 0.39 | 0.11 | -6.26 | -6.26 | 16.07 | 9,245 | |
| NGXAFRBVI | 2,964.02 | 0.41 | 0.21 | -16.35 | -16.35 | 19.48 | 3,527 | |
| NGXAFRHDYI | 19,872.27 | 1.75 | 1.96 | -4.98 | -4.98 | 16.71 | 4,163 | |
| NGXASEM | 1,597.18 | 0.13 | 0.13 | 0.13 | 0.13 | 0.85 | 16 | |
| NGXBNK | 1,281.21 | 0.19 | 0.06 | -15.20 | -15.20 | 17.82 | 4,012 | |
| NGXCG | 3,458.09 | 0.56 | 0.62 | 0.56 | 0.56 | 22.23 | 9,090 | |
| NGXCNSMRGDS | 2,695.32 | 1.78 | 2.26 | -22.30 | -22.30 | 55.41 | 2,691 | |
| NGXCOMMDTY | 1,047.37 | 0.02 | 0.02 | 0.01 | 0.01 | 4.73 | ||
| NGXGROWTH | 9,920.06 | 4.32 | 5.31 | 4.32 | 4.32 | 27.79 | 321 | |
| NGXINDUSTR | 3,597.41 | 0.52 | -1.12 | 2.12 | 2.12 | 0.72 | 1,726 | |
| NGXINS | 762.84 | 0.76 | 0.97 | 3.28 | 3.28 | -2.97 | 1,441 | |
| NGXLOTUSISLM | 9,278.38 | 0.95 | 0.53 | -3.09 | -3.09 | 33.16 | 2,882 | |
| NGXMAINBOARD | 5,931.30 | 0.55 | 0.72 | 0.55 | 0.55 | 18.53 | 16,093 | |
| NGXMERIGRW | 8,203.99 | 0.61 | 0.67 | -15.00 | -15.00 | 25.77 | 2,931 | |
| NGXMERIVAL | 11,386.56 | 0.65 | 2.12 | -4.70 | -4.70 | 9.17 | 4,775 | |
| NGXOILGAS | 2,427.19 | -0.45 | -0.42 | 1.47 | 1.47 | -10.47 | 365 | |
| NGXPENBRD | 2,181.18 | 0.31 | 0.06 | -5.14 | -5.14 | 19.08 | 15,383 | |
| NGXPENSION | 5,815.83 | 0.38 | 0.30 | -8.48 | -8.48 | 28.27 | 10,791 | |
| NGXPREMIUM | 11,514.51 | 0.39 | -0.54 | 0.39 | 0.39 | 18.30 | 4,107 | |
| NGXSOVBND | 653.51 | 0.00 | 0.08 | 0.00 | 0.00 | 8.64 | 1 |
For more detailed analysis,
- On InfoWARE Market Data Terminal <MKTINS> <GO>
- On InfoWARE Finance Mobile App ( Android, iPhone & iPad and Windows 10) , "Market Indexes"
Find the topic interesting? Will like to comment? Contact Us at solutions@infowarelimited.com
Top News

Chart Of The Day - ASI Chart Vs ASI Advance Decline Line (YTD) (02-Jul-2025 15:07:10.584)
InfoWARE AI Analyst Daily Market Report: 02-Jul-2025

[MORISON]>>Notice of Meeting -<MORISON INDUSTRIES PLC.>
[UBA]>>Notice of Meeting -<UNITED BANK FOR AFRICA PLC>
[RONCHESS]>>Corporate Disclosures-<RONCHESS GLOBAL RESOURCES PLC>
[XNSA]>> DAILY FUND PRICE SUBMISSION - FCMB ASSET MANAGEMENT LIMITED
[AFRIPRUD]>> Earning Forcast - <Q3-2025> ?-<AFRICA PRUDENTIAL PLC>
[VSPBONDETF]>> DAILY INDICATIVE PRICES
[XNSA]>> CIS TRAINING ON "RETIREMENT PLANNING AND WEALTH CREATION & MANAGEMENT
[XNSA]>> CLOSING GONG CEREMONY
[XNSA]>> NGX FIXED INCOME INDICATIVE PRICE LIST FOR JUL 02, 2025
[SIAMLETF40]>> DAILY INDICATIVE PRICES
[AFRIPRUD]>>Notice of Meeting -<AFRICA PRUDENTIAL PLC>
[NAHCO]>>Notice of Meeting -<NIGERIAN AVIATION HANDLING COMPANY PLC>
[XNSA]>> NOTIFICATION OF PRICE ADJUSTMENT

MARKET PERFORMANCE REPORT & DAILY PRICE LIST
DAILY MARKET UPDATE FOR 1ST JULY 2025

Market Summary 01-07-2025
[MERGROWTH]>> DAILY INDICATIVE PRICES
[XNSA]>> CLOSING GONG CEREMONY
[AIICO]>>Notice of Meeting -<AIICO INSURANCE PLC.>
[TRIPPLEG]>>Corporate Disclosures-<TRIPPLE GEE AND COMPANY PLC.>
[JBERGER]>>Corporate Disclosures-<JULIUS BERGER NIGERIA PLC>
[XNSA]>> CORDROS MILESTONE FUNDS' BID & OFFER PRICES
[XNSA]>> CIS TRAINING ON "RETIREMENT PLANNING AND WEALTH CREATION & MANAGEMENT
[VETBANK]>> DAILY INDICATIVE PRICES
[XNSA]>> NGX REVEALS RESULTS OF HALF-YEAR REVIEW OF MARKET INDICES
[XNSA]>> NGX FIXED INCOME INDICATIVE PRICE LIST FOR JUL 01, 2025
[AIRTELAFRI]>>Corporate Disclosures-<Airtel Africa Plc>
[IKEJAHOTEL]>>Notice of Meeting -<IKEJA HOTEL PLC>
Get IDIA - the stock trading app for the modern investor
Solutions by Business
Product Suites
Company
Contacts
- 8th Floor,
- South Atlantic Petroleum Towers,
- 1 Adeola Odeku Street,
- Victoria Island,
- Lagos, Nigeria.
- Email: solutions@infowarelimited.com
Follow Us
 |
 |
 |
 |