


InfoWARE AI Analyst Daily Market Report: 13-Aug-2025 | InfoWARE Finance
Get IDIA - the stock trading app for the modern investor


InfoWARE AI Analyst Daily Market Report: 13-Aug-2025
(Source: InfoWARE Terminal, Date: 13-Aug-2025)
Dear Investor,
NGX Daily Market Summary: Wednesday, August 13, 2025
The Nigerian equities market dipped modestly today as the NGX All Share Index (ASI) edged -0.13% lower to close at 146,055.89, though maintaining an impressive 41.37% YTD return. Trading activity moderated sharply, with total market turnover sliding by -84.04% to ₦3.61B and trading volume dropping to 366.37M shares, compared to the previous day’s 1.24B. Market breadth, however, remains robust (2.46x), signaling underlying optimism as advancers continue to outpace decliners. Unusually high volume spikes in select insurance and financial stocks hint at persistent sectoral momentum, while YTD top gainers reveal insurance companies as standout performers.
Key Takeaways
- Strong Market Breadth: Advancers (59) far outnumber decliners (24), yielding a positive 2.46x breadth ratio even as the main index posts a slight dip.
- Top Movers:
- Top Gainer: CAVERTON closed at ₦7.92, up +10.00%.
- Top Loser: FTNCOCOA slipped -10.00% to close at ₦6.93.
- Other notable gainers: PRESTIGE (+10.0%) with an exceptionally high RSI of 86.74 (potentially overbought), TRIPPLEG (+10%), and LEARNAFRCA (+10%).
- Biggest losers: THOMASWY (-10%) showing elevated RSI (70.4), UPDC (-7.94%) with an extremely overbought signal (RSI = 89.23), and BERGER (-6.16%)—which also features in the YTD losers table.
- Volume leaders (unusual activity): UNIVINSURE (+485.8% vol), LASACO (+511.5% vol), JAPAULGOLD (+217.4% vol).
- Turnover Implosion: Substantial drop in traded value hints at major institutional buy/sell programs appearing to wrap up or pause—a likely signal for consolidation or waning near-term momentum. Caution for large-volume entrants.
- Sectoral Rotation: Insurance and financial services dominate both YTD gainers and top unusual volume signals.
YTD Top 5 Gainers & Losers
| Gainer | Symbol | Price | YTD %Chg | RSI | Div Yield | PE |
|---|---|---|---|---|---|---|
| MUTUAL BENEFITS ASSURANCE PLC. | MBENEFIT | ₦3.53 | +536.07% | 95.86 | 3.28 | 5.43 |
| ELLAH LAKES PLC. | ELLAHLAKES | ₦16.06 | +486.71% | 78.17 | 0.00 | 0.00 |
| CORNERSTONE INS CO. PLC. | CORNERST | ₦7.75 | +115.15% | 83.55 | 5.28 | 8.62 |
| MANSARD INSURANCE PLC | MANSARD | ₦17.71 | +115.96% | 82.59 | 4.59 | 31.16 |
| VERITAS KAPITAL ASSURANCE PLC | VERITASKAP | ₦2.54 | +87.25% | 93.87 | 4.17 | 48.77 |
| Loser | Symbol | Price | YTD %Chg | RSI | Div Yield | PE |
|---|---|---|---|---|---|---|
| VFD GROUP PLC | VFDGROUP | ₦12.40 | -72.97% | 36.39 | 0.00 | 0.00 |
| GREENWICH ASSET ETF | GREENWETF | ₦400.00 | -26.03% | 65.66 | 0.00 | - |
| HALDANE MCCALL PLC | HMCALL | ₦4.37 | -11.70% | 46.33 | 0.00 | 0.00 |
| BERGER PAINTS PLC | BERGER | ₦34.10 | -6.16% | 51.61 | 1.15 | 14.18 |
| UNILEVER NIG PLC. | UNILEVER | ₦71.30 | -4.30% | 58.52 | 2.81 | 67.09 |
Unusual Volume (Top 5)
| Stock | Symbol | Volume | 90D Avg Vol | %VolChg |
|---|---|---|---|---|
| LASACO ASSURANCE | LASACO | 52.35M | 8.56M | +511.5% |
| UNIVERSAL INSURANCE | UNIVINSURE | 193.43M | 33.02M | +485.8% |
| VERITAS KAPITAL | VERITASKAP | 93.22M | 18.17M | +412.9% |
| STERLING FINANCIAL HOLDINGS | STERLINGNG | 68.20M | 20.12M | +238.95% |
| JAPAUL GOLD & VENTURES | JAPAULGOLD | 123.16M | 38.80M | +217.4% |
Bullish Momentum: 15DMA Crossovers
| Symbol | Name | Price | %Chg | 15DMA | RSI | Div Yield |
|---|---|---|---|---|---|---|
| RTBRISCOE | R T BRISCOE PLC. | ₦3.74 | +9.09% | 3.71 | 47.14 | 0.00 |
| UACN | U A C N PLC. | ₦78.45 | +8.86% | 76.75 | - | 1.00 |
| LIVESTOCK | LIVESTOCK FEEDS PLC. | ₦8.95 | +5.59% | 8.53 | - | 2.94 |
| AFRIPRUD | AFRICA PRUDENTIAL REGISTRARS PLC | ₦16.05 | +0.93% | 15.96 | - | 1.27 |
| VITAFOAM | VITAFOAM NIG PLC. | ₦81.90 | 0.00% | 81.78 | - | 7.03 |
Bearish Momentum: 15DMA Breakdown
| Symbol | Name | Price | %Chg | 15DMA | RSI | Div Yield |
|---|---|---|---|---|---|---|
| GTCO | GUARANTY TRUST HOLDING COMPANY PLC | ₦97.70 | -1.33% | 98.47 | 63.54 | 1.88 |
| UBA | UNITED BANK FOR AFRICA PLC | ₦48.05 | -1.35% | 48.18 | 65.39 | 5.96 |
| WAPCO | LAFARGE WAPCO PLC. | ₦137.00 | -2.19% | 140.59 | - | 2.70 |
Contrarian Signals
- CHAMPION: Despite a -9.8% YTD drop and moderate RSI (68.47), the stock exhibits a bullish MACD—potential early reversal.
- THOMASWY: Down -10% today but with an elevated RSI (70.4), signaling overbought levels despite weakness—a classic divergence that can precede a short-term bounce.
- BERGER: Notably featured as both a daily and YTD loser, yet its RSI is neutral and MACD histogram just turned less negative, suggesting potential bottoming.
- UPDC: Down -7.94% today but with an exceedingly high RSI (89.23), usually a sign of impending mean reversion or short-term exhaustion.
Sector Heatmap: Performance & Activity
| Sector | Gainers | Losers | YTD Performers | Unusual Vol | Technical |
|---|---|---|---|---|---|
| Insurance | MANSARD, CORNERST, MBENEFIT, PRESTIGE, UNIVINSURE, VERITASKAP | LASACO (from previous week) | Multiple top-5 | LASACO, UNIVINSURE, VERITASKAP | Bullish: PRESTIGE, CORNERSTONE Bearish: - |
| Banking | WEMABANK, STERLINGNG | GTCO, UBA, ZENITHBANK | WEMABANK (Bullish) | STERLINGNG, UBA | Bullish: WEMABANK Bearish: GTCO, UBA |
| Building Materials | --- | BERGER, WAPCO | BERGER (YTD loser) | --- | Bullish: - Bearish: WAPCO |
| Other Financials | AFRIPRUD, ACCESSCORP | --- | --- | --- | Bullish: AFRIPRUD Bearish: - |
| Household Durables | VITAFOAM | --- | --- | --- | Bullish: VITAFOAM |
Dividend-Yield / Beta Matrix – Defensive Stock Watchlist
| Stock | Dividend Yield | Beta | Category | Momentum/Bullish Signal? |
|---|---|---|---|---|
| VITAFOAM | 7.03 | 0.47 | High Yield/Low Beta (Defensive) | Bullish (15DMA cross) |
| AFRIPRUD | 1.27 | 0.64 | Mod. Yield/Low Beta | Bullish (15DMA cross) |
| UBA | 5.96 | 1.56 | High Yield/High Beta | Bearish (15DMA breakdown) |
| GTCO | 1.88 | 1.09 | Mod. Yield/High Beta | Bearish (15DMA breakdown) |
Implication: VITAFOAM and AFRIPRUD stand out for more defensive, lower-beta income holdings, both flashing bullish technical signals—a blend of growth and yield in today’s unsettled market.
Institutional Clustering Alerts
- ZENITHBANK: Institutional investors account for 20.17% of daily trade value, signaling ongoing smart-money accumulation despite near-term weakness.
- ACCESSCORP & STERLINGNG: Consistently feature in both institutional and retail top traded lists—watch for continued rotation, particularly in STERLINGNG given its +238.9% surge in volume.
Suggestions for Traders & Investors
- Momentum Watch: Insurance stocks remain dominant among YTD gainers (notably MBENEFIT, MANSARD, CORNERST, VERITASKAP, PRESTIGE). Persistent high RSI (>80) in many insurance names suggests staying invested with tight stop-losses and partial profit-taking for those already in positions.
- Caution: Turnover collapse points to possible short-term pause; avoid entering large trades in thinly traded stocks without clear volume confirmation.
- Contrarian Play: Stocks with high RSI but falling price (e.g., UPDC, THOMASWY) could attract short-term bargain hunting or pairs trade opportunities.
- Income/Defensive Play: Consider high-dividend, low-beta stocks like VITAFOAM and AFRIPRUD—particularly since both signal bullish reversals above their 15DMA.
- Institutional Flow: Top 5 institutional stocks (ZENITHBANK, ACCESSCORP, UBA, STERLINGNG, ARADEL) gauge sector focus. Persistent institutional activity is a bullish medium-term signal even in days of broad turnover drops.
- Unusual Volume Breakouts: UNIVINSURE, LASACO, and VERITASKAP (insurance) have spectacular volume spikes—usually a precursor to continued volatility in coming sessions.
Market Trades Activity Analytics
-
Retail vs Institutional: Institutional investors constitute 41.8% of total trade count but dominate volume (77.8%) and value (86.1%). Retail is still highly active by count (58.2%) but only 22% by volume, reflecting small-lot enthusiasm.
Retail Focus: UBA, ACCESSCORP, GTCO, ZENITHBANK, and MTNN top the retail trading list—note most overlap with institutional flows and are in heavily weighted index sectors (Banking, Telecoms). - Correlations: Stocks with heavy overlaps in both high retail and institutional flows—like UBA, ACCESSCORP, ZENITHBANK—tend to be barometers for overall market sentiment and liquidity shifts.
- Trading Opportunity: Liquidity and price discovery likely to be best in stocks such as UBA, ACCESSCORP, ZENITHBANK for both short-term traders and larger investors seeking to minimize slippage.
- Volatility Watch: Several high-volume insurance stocks (LASACO, VERITASKAP, UNIVINSURE) have technical momentum with strong retail activity, making them ripe for short-term speculation.
Hidden Insights & Competitive Edge
- Risk-On Yet Defensive: The strong insurance YTD run is now drawing both speculative and institutional capital, but sky-high RSIs indicate the next leg up may be more selective. Watch for early distribution in outliers with fading volume.
- Bullish Dividend Stocks: VITAFOAM and AFRIPRUD, showing simultaneous bullish crossovers and strong defensive traits, are rare finds in today’s market, offering both income and potential capital appreciation.
- Contrarian Volume Surge: LASACO's record volume and positive price action indicate institutional repositioning—an early sign of sector rotation rather than mere retail hype.
- Institutional Beta Shift: Banking sector (ACCESSCORP, ZENITHBANK, UBA) may be close to bottoming; monitor for a sentiment reversal as retail sellers exit and institutions quietly accumulate.
Stay nimble and pay attention to subtle volume and sector shifts; hidden institutional accumulation and technical divergences can foreshadow enduring trend reversals or continuations.
|
Top ASI Gainers Over Last 5 Trading Days
|
Top ASI Losers Over Last 5 Trading Days
|
For more detailed analysis, on InfoWARE Market Data Terminal <NSEPERF> <GO>
On InfoWARE Finance Mobile App (Android, iPhone & iPad, Windows Phone and Windows 8/10), "Top Gainers & Losers"
CAVERTON OFFSHORE SUPPORT GRP PLC (CAVERTON) topped the advancers list closing at N7.92 with a gain of 10.00% followed by FTN COCOA PROCESSORS PLC (FTNCOCOA) which closed at N6.93 with a gain of 10.00%.
On the flip side THOMAS WYATT NIG. PLC. (THOMASWY) and UPDC PLC (UPDC) topped the decliners log with a loss of -10.00% at a close of N3.42, and -7.94% to close the day at N8.00 respectively.
| Symbol | LClose | %Chg |
|---|---|---|
| CAVERTON | 7.92 | 10.00 |
| FTNCOCOA | 6.93 | 10.00 |
| LEARNAFRCA | 7.70 | 10.00 |
| LOTUSHAL15 | 79.20 | 10.00 |
| PRESTIGE | 2.42 | 10.00 |
For more detailed analysis,
- On InfoWARE Market Data Terminal <TOPG> <GO>
- On InfoWARE Finance Mobile App ( Android, iPhone & iPad and Windows 10) , "Top Gainers & Losers"
Currency Market
In the currency market, the Naira fell 0.19%(-2.88) against the Dollar to settle at 1 to 1NSE: Bull Signal - Price crossed above 15 Day MA
This signal implies these stocks are under buying pressure and the price might continue to rise and therefore positions should be monitored closely. Further suggested analysis include looking at the overall market (ASI) to see if the uptrend is market wide, sector wide or specific to the stock. Portfolio managers tend to use this as a signal to do more research to add to their positions or lock in some profits. Typically further analysis should be done using commands like PC and RV on the InfoWARE Market Data Terminal. Another command is ALERTS to set price triggers for possible exit or entry as necessary
For more detailed analysis,
- On InfoWARE Market Data Terminal <NSEPERF> <GO>
- On InfoWARE Finance Mobile App ( Android , iPhone & iPad and Windows 10) , "Top Gainers & Losers"
| Symbol | Price | %Chg | 15DMA | PE | EPS | DivY | MktCap | Vol | Trades | Value | LstTradeTime |
|---|---|---|---|---|---|---|---|---|---|---|---|
| FGS202669 | 110.00 | 12.45 | 97.22 | 0.00 | 0.00 | 11.00K | 2.00 | 12.10M | 13-Aug-2025 14:34:40.977 | ||
| RTBRISCOE | 3.74 | 9.09 | 3.71 | 0.00 | 0.00 | 4.35 | 4.40B | 3.02M | 60.00 | 11.06M | 13-Aug-2025 14:34:29.553 |
| ABBEYBDS | 6.85 | 9.05 | 6.55 | 0.00 | 0.00 | 1.43 | 69.55B | 624.74K | 47.00 | 4.24M | 13-Aug-2025 14:33:29.220 |
| UACN | 78.45 | 8.86 | 76.75 | 9.38 | 2.35 | 1.00 | 229.56B | 2.84M | 446.00 | 211.41M | 13-Aug-2025 14:34:30.930 |
| LIVESTOCK | 8.95 | 5.59 | 8.53 | 0.00 | 0.00 | 2.94 | 26.85B | 6.50M | 197.00 | 56.60M | 13-Aug-2025 14:34:24.937 |
| WEMABANK | 23.00 | 5.43 | 22.22 | 216.91 | 0.04 | 5.81 | 295.74B | 4.28M | 382.00 | 97.05M | 13-Aug-2025 14:34:31.930 |
| AFRIPRUD | 16.05 | 0.93 | 15.96 | 19.57 | 0.61 | 1.27 | 32.10B | 2.28M | 186.00 | 36.53M | 13-Aug-2025 14:33:36.920 |
| VITAFOAM | 81.90 | 0.00 | 81.78 | 8.66 | 2.56 | 7.03 | 102.44B | 601.75K | 121.00 | 45.85M | 13-Aug-2025 14:34:31.833 |
NSE: BEAR Signal - Price crossed below 15 Day MA
This signal implies these stocks are under selling pressure and the price might continue to slide and therefore positions should be monitored closely. Further suggested analysis include looking at the overall market (ASI) to see if the downtrend is market wide, sector wide or specific to the stock. If the overal market trend is upwards, then since these stocks are heading in the opposite direction, then further analysis should be done using commands like PC and RV on the InfoWARE Market Data Terminal. Another command is ALERTS to set price triggers for possible exit is necessar
For more detailed analysis,
- On InfoWARE Market Data Terminal <BEARM> <GO>
- On InfoWARE Finance Mobile App ( Android , iPhone & iPad and Windows 10)
| Symbol | Price | %Chg | 15DMA | PE | EPS | DivY | MktCap | Vol | Trades | Value | LstTradeTime |
|---|---|---|---|---|---|---|---|---|---|---|---|
| NGXMERIVAL | 14,102.53 | -0.59 | 14,203.58 | 12.13 | 38.38 | 0.00 | 0.00 | 17.22M | 1,963.00 | 889.54M | 13-Aug-2025 14:34:43.687 |
| NGXAFRBVI | 3,738.48 | -1.18 | 3,755.81 | 3.14 | 35.50 | 0.00 | 0.00 | 17.09M | 1,544.00 | 692.27M | 13-Aug-2025 14:34:43.190 |
| GTCO | 97.70 | -1.33 | 98.47 | 7.49 | 7.10 | 1.88 | 2,875.43B | 11.21M | 1,036.00 | 1.10B | 13-Aug-2025 14:36:42.393 |
| UBA | 48.05 | -1.35 | 48.18 | 8.29 | 4.05 | 5.96 | 1,643.28B | 22.31M | 1,440.00 | 1.08B | 13-Aug-2025 14:36:51.907 |
| WAPCO | 137.00 | -2.19 | 140.59 | 24.60 | 2.87 | 2.70 | 2,206.77B | 2.28M | 366.00 | 315.77M | 13-Aug-2025 14:36:44.727 |
| FGSUK2032S5 | 95.00 | -3.16 | 96.62 | 0.00 | 0.00 | 30.00K | 4.00 | 28.50M | 13-Aug-2025 14:36:55.177 | ||
| FGS202774 | 67.00 | -94.03 | 110.80 | 0.00 | 0.00 | 5.77K | 1.00 | 3.86M | 13-Aug-2025 14:34:41.783 |
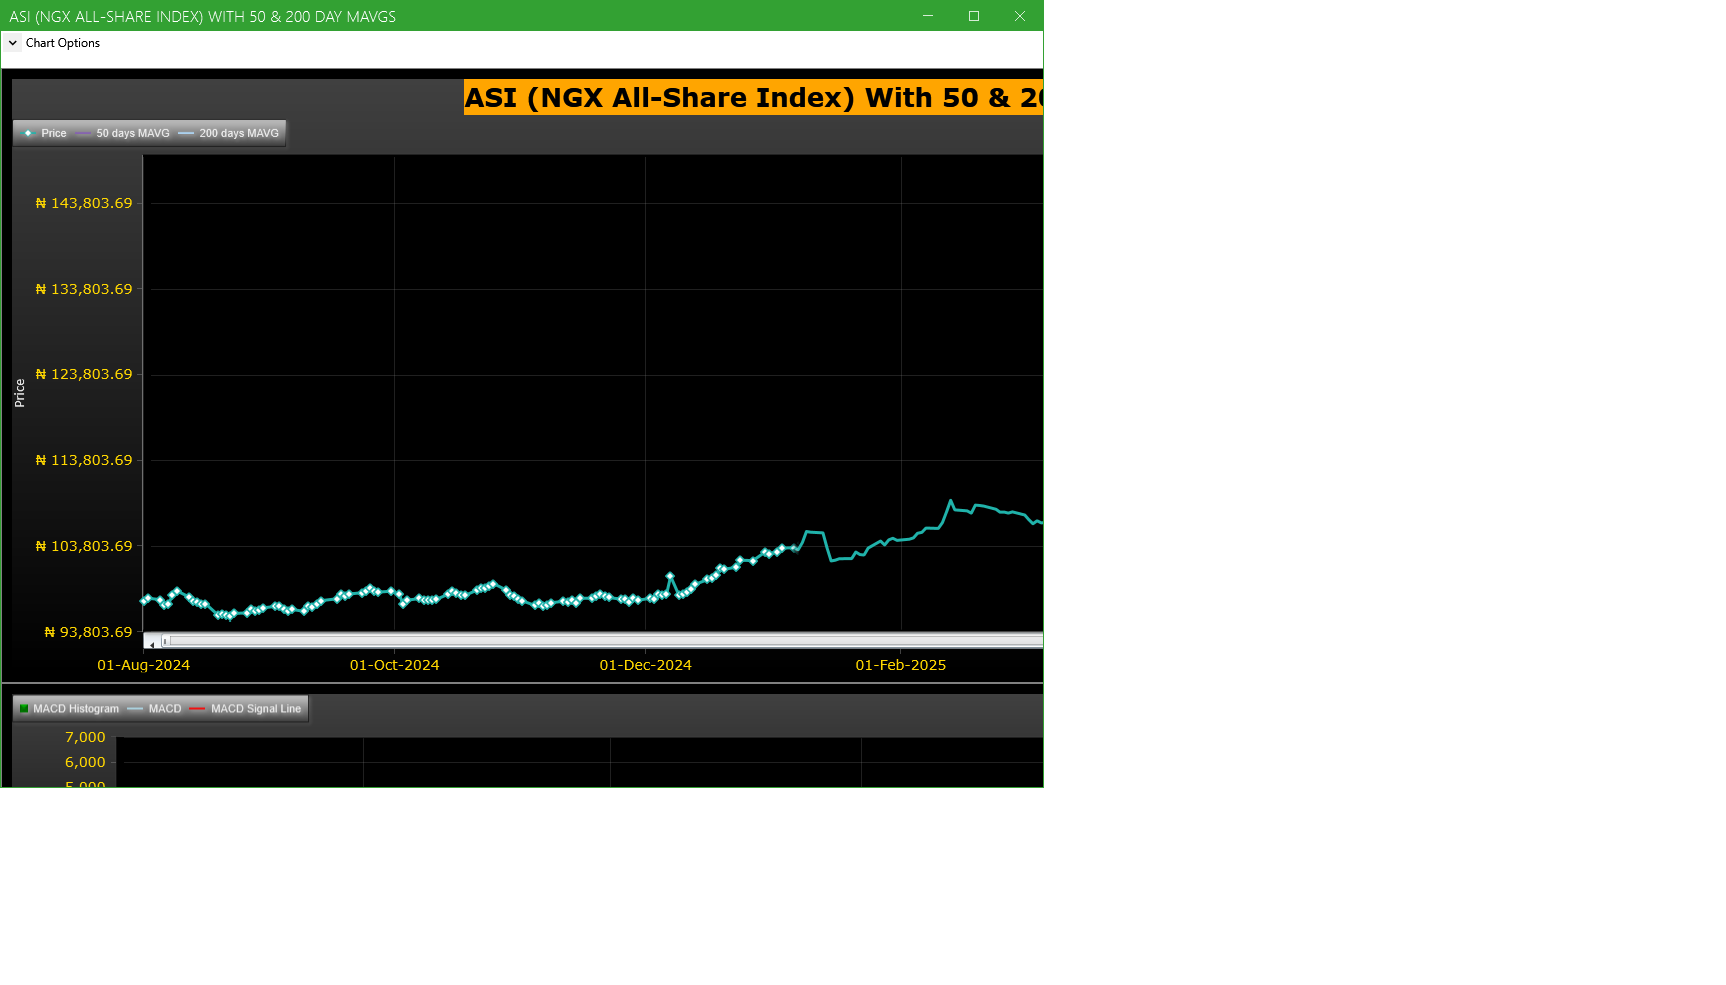
Market Trend - ASI (NGX All-Share-Index) With 50 & 200 Day MAvgs Chart
Technical traders typically use the 50 & 200 day moving averages to aid in choosing
where to enter or exit a position, which then causes these levels to act as strong
support or resistance. As a general guideline, if the price is above a moving average,
the trend is up. If the price is below a moving average, the trend is down.
It is important to note that critics of technical analysis say that moving averages act
as support and resistance because so many traders use these indicators to inform their
trading decisions. Also moving averages tend to work quite well in strong trending conditions
but poorly in choppy or ranging conditions.
Trading Strategies: Crossovers
Crossovers are one of the main moving average strategies. The first type is a price crossover,
which is when the price crosses above or below a moving average to signal a potential change
in trend. Another strategy is to apply two moving averages to a chart: one longer and one
shorter. When the shorter-term MA crosses above the longer-term MA, it is a buy signal, as
it indicates that the trend is shifting up. This is known as a golden cross. Meanwhile, when
the shorter-term MA crosses below the longer-term MA, it is a sell signal, as it indicates that
the trend is shifting down. This is known as a dead/death cross
For more detailed analysis,
- On InfoWARE Market Data Terminal <CI> <GO>
- On InfoWARE Finance Mobile App ( Android , iPhone & iPad and Windows 10) , "Research"
Unusual Volume: Volume traded is more than double the 90 day moving average (All exchanges; ASI & ASem). For more detailed analysis,
- On InfoWARE Market Data Terminal <UV> <GO>
- On InfoWARE Finance Mobile App ( Android , iPhone & iPad and Windows 10)
| Symbol | Name | Volume | 90DAvgVol | %VolChg | Price | LClose | %Chg | Trades | Value |
|---|---|---|---|---|---|---|---|---|---|
| UNIVINSURE | UNIVERSAL INSURANCE COMPANY PLC | 193.43M | 33.02M | 485.82 | 1.46 | 1.33 | 9.77 | 100 | 282.42M |
| JAPAULGOLD | JAPAUL GOLD & VENTURES PLC | 123.16M | 38.80M | 217.42 | 3.00 | 2.94 | 2.04 | 730 | 389.98M |
| VERITASKAP | VERITAS KAPITAL ASSURANCE PLC | 93.22M | 18.17M | 412.91 | 2.79 | 2.54 | 9.84 | 313 | 260.05M |
| STERLINGNG | STERLING FINANCIAL HOLDINGS COMPANY PLC | 68.20M | 20.12M | 238.95 | 8.09 | 8.09 | 0.00 | 696 | 552.62M |
| LASACO | LASACO ASSURANCE PLC. | 52.35M | 8.56M | 511.51 | 5.00 | 4.55 | 9.89 | 522 | 261.72M |
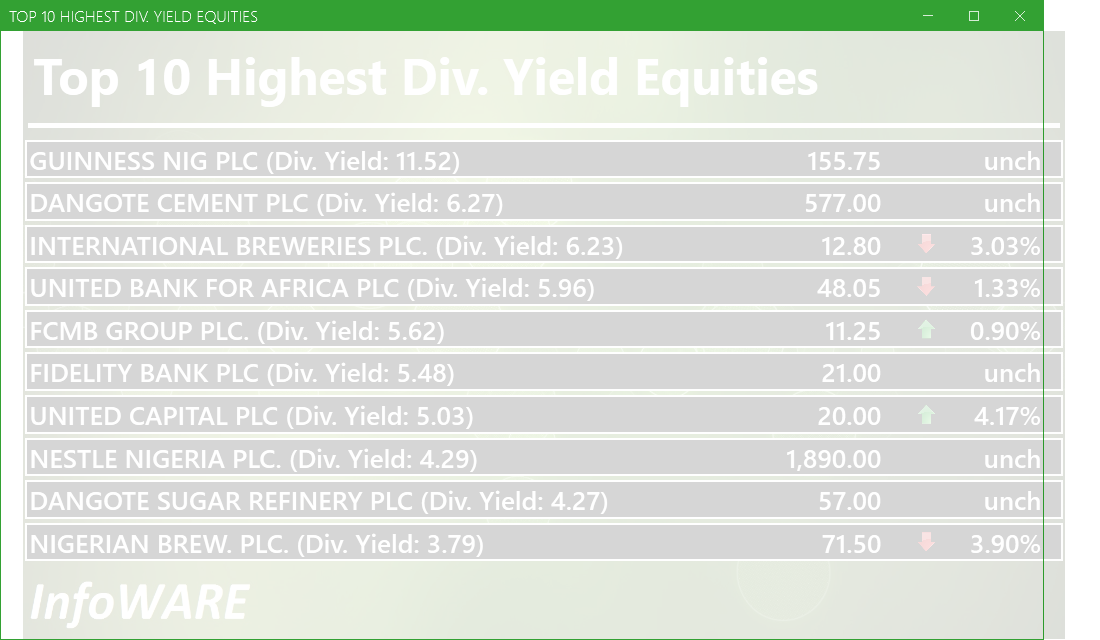
Investment Insights - High Div. Stocks
Dividend stocks distribute a portion of the company earnings to investors on a regular basis and they can a great choice for investors looking for regular income. As an investment or trading strategy, high dividend yield equities provide annual cash payments as against mostly capital gains in the price of a stock. The list in the table below represent the highest dividend paying stocks from the list of the most liquid stocks in the NSE top 30.
For more detailed analysis,
- On InfoWARE Market Data Terminal <HYIELD> <GO>
- On InfoWARE Finance Mobile App ( Android , iPhone & iPad and Windows 10) , "Research"
Investment Insights - Stocks outperforming the ASI but with approximately the same risk
These list of stocks represent equities that are less risky than the ASI but doing better than the ASI (All Shares Index) using the YTD (Year to Date) returns as the measure. The risk is measured by Beta. Beta is an assessment of a stock's tendency to undergo price changes, (its volatility), as well as its potential returns compared to the ASI. It is expressed as a ratio, where a score of 1 represents performance comparable to the ASI, and returns above or below the market may receive scores greater or lower than 1.
For a full list of both positively and negatively corelated stocks visit InfoWARE Market Data Terminal
- On InfoWARE Market Data Terminal <BANL> <GO>
- On InfoWARE Finance Mobile App ( Android , iPhone & iPad and Windows 10)
| Symbol | DivYield | PE | EPS | Beta | %ChgYTD | ASIYTDReturn | BetaDiff |
|---|---|---|---|---|---|---|---|
| HONYFLOUR | 1.40 | 16.28 | 0.31 | 0.99 | 246.10 | 41.37 | 0.01 |
| CAVERTON | 5.52 | 1.15 | 1.57 | 0.98 | 210.59 | 41.37 | 0.02 |
| CONHALLPLC | 2.08 | 69.63 | 0.03 | 0.96 | 48.55 | 41.37 | 0.04 |
| ROYALEX | 7.81 | 0.00 | 0.00 | 0.96 | 187.27 | 41.37 | 0.04 |
| CORNERST | 5.28 | 8.62 | 0.35 | 0.93 | 115.15 | 41.37 | 0.07 |
| VERITASKAP | 4.17 | 48.77 | 0.02 | 0.88 | 87.25 | 41.37 | 0.12 |
| UNIVINSURE | 0.00 | 0.00 | 0.00 | 0.83 | 102.78 | 41.37 | 0.17 |
| FTNCOCOA | 1.60 | 0.00 | 0.00 | 0.79 | 268.62 | 41.37 | 0.21 |
| NB | 3.79 | 16.95 | 1.60 | 0.79 | 123.44 | 41.37 | 0.21 |
| MAYBAKER | 3.75 | 58.94 | 0.14 | 0.78 | 91.49 | 41.37 | 0.22 |
African Markets
| Name | LClose | Change | %Chg |
|---|---|---|---|
| BRVM Stock Exchange | 312.40 | 0.62 | 0.20 |
| Botswana Stock Exchange | 10,543.66 | 15.79 | 0.15 |
| Egyptian Exchange | 36,003.65 | 93.37 | 0.26 |
| Ghana Stock Exchange | 7,411.94 | 0.00 | 0.00 |
| Johannesburg Stock Exchange | 101,271.16 | 644.01 | 0.64 |
| Lusaka Stock Exchange | 21,924.73 | 389.78 | 1.81 |
| Casablanca Stock Exchange | 19,883.67 | 39.69 | 0.20 |
| Malawi Stock Exchange | 447,122.31 | 14,953.06 | 3.46 |
| Nigeria Stock Exchange | 146,055.89 | 175.06 | 0.12 |
| Nairobi Securities Exchange | 162.22 | 0.03 | 0.02 |
| Namibian Stock Exchange | 1,786.50 | 18.21 | 1.03 |
| Rwanda Stock Exchange | 150.43 | 0.00 | 0.00 |
| Tunis Stock Exchange | 11,832.83 | -30.85 | -0.26 |
| Uganda Securities Exchange | 1,366.62 | 2.32 | 0.17 |
Nigeria Market Indexes
| Symbol | LClose | %Chg | WTD% | MTD% | QTD% | YTD% | MktCap | Trades |
|---|---|---|---|---|---|---|---|---|
| ASI | 145,864.78 | -0.13 | -0.06 | 3.26 | 21.82 | 41.37 | 9,895 | |
| NGX30 | 5,311.14 | -0.33 | -0.35 | 2.42 | 12.44 | 39.22 | 4,945 | |
| NGXAFRBVI | 3,738.48 | -1.17 | -1.27 | -1.98 | 5.50 | 50.70 | 1,544 | |
| NGXAFRHDYI | 23,586.52 | 0.12 | 1.78 | 1.56 | 12.78 | 38.52 | 2,099 | |
| NGXASEM | 1,400.53 | 0.00 | -9.84 | -3.17 | -12.20 | -11.57 | 11 | |
| NGXBNK | 1,601.89 | -0.53 | -0.74 | -1.05 | 6.03 | 47.31 | 2,302 | |
| NGXCG | 4,242.02 | -0.52 | -0.65 | -1.39 | 23.36 | 49.94 | 4,710 | |
| NGXCNSMRGDS | 3,209.14 | -0.91 | -1.39 | 7.81 | -7.48 | 85.03 | 1,217 | |
| NGXCOMMDTY | 1,070.03 | -0.03 | -0.03 | -2.36 | 2.18 | 7.00 | 470 | |
| NGXGROWTH | 11,451.21 | 6.29 | 13.37 | 3.46 | 20.42 | 47.51 | 129 | |
| NGXINDUSTR | 5,445.27 | -0.33 | 0.53 | 7.71 | 54.57 | 52.46 | 720 | |
| NGXINS | 1,616.47 | 7.94 | 17.78 | 82.25 | 118.86 | 105.61 | 941 | |
| NGXLOTUSISLM | 11,958.56 | -0.16 | 0.17 | 2.86 | 24.90 | 71.63 | 1,872 | |
| NGXMAINBOARD | 6,980.35 | -0.01 | -0.17 | 5.14 | 18.33 | 39.50 | 7,271 | |
| NGXMERIGRW | 10,363.45 | 1.02 | 0.60 | 0.52 | 7.37 | 58.87 | 1,180 | |
| NGXMERIVAL | 14,102.53 | -0.58 | -0.63 | -2.92 | 18.03 | 35.21 | 1,963 | |
| NGXOILGAS | 2,425.56 | 0.12 | -0.07 | -0.45 | 1.40 | -10.53 | 556 | |
| NGXPENBRD | 2,697.30 | -0.10 | 0.02 | 3.50 | 17.31 | 47.26 | 7,503 | |
| NGXPENSION | 6,880.94 | -0.41 | -0.29 | -0.48 | 8.28 | 51.76 | 5,411 | |
| NGXPREMIUM | 14,743.86 | -0.37 | 0.07 | -0.15 | 28.54 | 51.48 | 2,184 | |
| NGXSOVBND | 673.03 | 0.00 | 0.00 | 0.02 | 2.99 | 11.88 | 0 |
For more detailed analysis,
- On InfoWARE Market Data Terminal <MKTINS> <GO>
- On InfoWARE Finance Mobile App ( Android, iPhone & iPad and Windows 10) , "Market Indexes"
Find the topic interesting? Will like to comment? Contact Us at solutions@infowarelimited.com
Top News

Chart Of The Day - ASI Chart Vs ASI Advance Decline Line (YTD) (13-Aug-2025 15:11:35.049)
InfoWARE AI Analyst Daily Market Report: 13-Aug-2025

[MEYER]>>Corporate Disclosures-<MEYER PLC>
[SEPLAT]>>Corporate Disclosures-<SEPLAT ENERGY PLC>
[SEPLAT]>>Corporate Disclosures-<SEPLAT ENERGY PLC>
[XNSA]>> EMERGING AFRICA DAILY FUND PRICES
[XNSA]>> CIS ACADEMY TRAINING
[VETBANK]>> DAILY INDICATIVE PRICES
[XNSA]>> NGX NON-INTEREST FINANCE BOARD LAUNCH COMMUNIQUE
[XNSA]>> SAVE THE DATE: 29TH ANNUAL STOCKBROKERS CONFERENCE
[STANBICETF30]>> DAILY INDICATIVE PRICES
Chart Of The Day - ASI Chart Vs ASI Advance Decline Line (YTD) (12-Aug-2025 15:06:59.143)
InfoWARE AI Analyst Daily Market Report: 12-Aug-2025
[OANDO]>>Corporate Disclosures-<OANDO PLC>
[OANDO]>>Corporate Disclosures-<OANDO PLC>
[XNSA]>> CORDROS MILESTONE FUNDS' BID & OFFER PRICES
[VETINDETF]>> DAILY INDICATIVE PRICES
[XNSA]>> CIS ACADEMY TRAINING
[XNSA]>> DAILY FUND PRICE SUBMISSION - FCMB ASSET MANAGEMENT LIMITED
[XNSA]>> NGX NON-INTEREST FINANCE BOARD LAUNCH COMMUNIQUE
[XNSA]>> SAVE THE DATE: 29TH ANNUAL STOCKBROKERS CONFERENCE
[XNSA]>> CHAMS HOLDING COMPANY PLC: ACTIVATION OF CODE FOR TRADING IN RIGHTS
[XNSA]>> NOTIFICATION OF PRICE ADJUSTMENT
Chart Of The Day - ASI Chart Vs ASI Advance Decline Line (YTD) (11-Aug-2025 15:10:12.070)
InfoWARE AI Analyst Daily Market Report: 11-Aug-2025
[XNSA]>> CORDROS MILESTONE FUNDS' BID & OFFER PRICES
[VETBANK]>> DAILY INDICATIVE PRICES
[XNSA]>> CIS ACADEMY TRAINING
[XNSA]>> EMERGING AFRICA DAILY FUND PRICES
[XNSA]>> NGX NON-INTEREST FINANCE BOARD LAUNCH COMMUNIQUE
Get IDIA - the stock trading app for the modern investor
Solutions by Business
Product Suites
Company
Contacts
- 8th Floor,
- South Atlantic Petroleum Towers,
- 1 Adeola Odeku Street,
- Victoria Island,
- Lagos, Nigeria.
- Email: solutions@infowarelimited.com
Follow Us
 |
 |
 |
 |