


InfoWARE AI Analyst Daily Market Report: 22-Aug-2025 | InfoWARE Finance
Get IDIA - the stock trading app for the modern investor


InfoWARE AI Analyst Daily Market Report: 22-Aug-2025
(Source: InfoWARE Terminal, Date: 22-Aug-2025)
Dear Investor,
NGX Daily Market Report: August 22, 2025
Overview: The Nigerian equities market finished higher today, with the NGX All Share Index (ASI) up 0.48% at 140,332.44, bringing YTD returns to a robust 36.66%. Market dynamics tilted bullish, with turnover jumping by 65.24% (₦15.33B) and trading volume surging to 697.75M shares (+55% vs previous day). Advancers led decliners 3.17x (57 gainers to 18 losers), capping a week of broad-based strength even as several sectors flashed overbought signals. Notably, volume was up in 77 companies while 62 saw lower volume. Large trades and heavy retail/institutional clustering in top banks further shaped flows. The naira also marginally appreciated 0.03% vs. the USD (₦1,534).
1. Significant Market Breadth Trends
- Strong Advancer/Decliner Spread: Gainers dominated with 57 advancers versus 18 decliners (Breadth: 3.17x), signaling strong, if broad, upward momentum.
- Volume Surge: Market-wide traded volume increased by 55%, reinforcing the bullish breadth and showing heightened investor participation.
- 77 stocks saw volume increases, while 62 had drops—a positive tilt but less extreme than advancers/decliners, showing selective participation in the rally.
- Turnover up 65.24%: A noteworthy pickup in value with notable institutional participation in blue chip names — generally a strong institutional vote of confidence.
2. Top Gainers & Losers
| Top 5 Gainers | |||||
|---|---|---|---|---|---|
| Stock Name | Symbol | Close (₦) | Change (%) | RSI | MACD |
| BETA GLASS CO PLC. | BETAGLAS | 449.35 | 10.00% | 96.78 | 18.99 |
| FTN COCOA PROCESSORS PLC | FTNCOCOA | 6.60 | 10.00% | 48.31 | 0.25 |
| VERITAS KAPITAL ASSURANCE PLC | VERITASKAP | 1.98 | 10.00% | 49.98 | 0.24 |
| GREENWICH ASSET ETF | GREENWETF | 347.49 | 10.00% | 47.68 | 14.46 |
| UPDC PLC | UPDC | 6.93 | 10.00% | 50.99 | 0.57 |
| Top 5 Losers | |||||
| Stock Name | Symbol | Close (₦) | Change (%) | RSI | MACD |
| GEREGU Power PLC | GEREGU | 1,027.40 | -9.99% | 48.13 | -0.30 |
| MERISTEM GROWTH ETF | MERGROWTH | 804.00 | -9.97% | 59.34 | 130.78 |
| THOMAS WYATT NIG. PLC. | THOMASWY | 3.00 | -9.91% | 49.81 | 0.19 |
| MCNICHOLS PLC | MCNICHOLS | 3.20 | -7.51% | 50.41 | 0.09 |
| VETIVA INDUSTRIAL ETF | VETINDETF | 50.00 | -4.76% | 67.08 | 3.05 |
- BETA GLASS (BETAGLAS) soared 10% and holds an exceptionally high RSI of 96.78, signaling extreme overbought and potentially due for a pause or pullback.
- FTNCOCOA rebounded 10% (yet also closed as top loser on technicals previously—note erratic momentum).
- MERGROWTH ETF plummeted -9.97% but shows strong MACD; could be a snapback opportunity if volume normalizes.
- VETINDETF's high RSI (67.08) on a down day hints at near-term exhaustion.
3. Trends & Predictions
- Turnover implications: The 65.24% jump in turnover, combined with strong breadth, suggests strong conviction and likely institutional rotation into value and momentum names.
- Advancers vs Decliners: Persistent breadth above 3x signals ongoing appetite for risk and accumulation as investors chase laggards and momentum names.
-
Unusual Volume:
- FCMB, NB, WAPIC, STANBIC, and TRANSCORP POWER all traded at 2x–87x their 90-day average volumes. TRANSCORP POWER (8,700% of average!) signals high conviction or anomaly—watch for post-earnings/news volatility.
- FCMB rose 2.33% as volume nearly tripled — a clear sign of strong entry, potentially institutional driven.
-
YTD Top Gainers vs. Losers Trends:
- AUSTINLAZ, NCR, ENAMELWA, MULTIVERSE, BETAGLAS, MECURE headline the annual leaderboard with YTD gains >30%. Some (e.g., BETAGLAS) are now extremely overbought (RSI >90), while momentum in others is flattening.
- Year’s worst performers include MERGROWTH, ROYALEX, WAPIC, THOMASWY, MCNICHOLS, most of which are showing oversold technicals and persistently soft fundamentals; watch for possible bottom-fishing attempts.
- Overlapping Names: MERGROWTH, THOMASWY, and MCNICHOLS appear in both daily and YTD losers, reinforcing continued downward pressure.
-
Bullish Momentum—RSI & MA Signals:
- BETAGLAS: With a sky-high RSI of 96.78 and 15DMA > 50DMA crossover, this may be due for profit taking despite strong institutional flows.
- CAP: Crossed 15DMA bullishly with 8.7% surge; RSI remains under overbought; could see further upside.
- FTNCOCOA, CAVERTON: Both show price/MA crossovers — short-term upside but be wary of chasing extended moves.
-
Bearish Momentum—Signals:
- MERGROWTH closed below its 15DMA, compounding its YTD and daily losses; trend remains negative until strong reversal volume appears.
4. Contrarian Signals
- Bullish MACD, Softer RSI: MERGROWTH: Despite large losses and a breakdown below 15DMA, MACD remains strongly positive (130.8), perhaps due to lag — could spark a short-term snapback.
- FTNCOCOA: Both in top gainers and with bullish 15DMA breakout, but RSI only at neutral (48.3) — may invite profit taking or volatility.
- VETINDETF: Negative returns today (down 4.8%) despite high RSI and positive MACD — a potential false breakout or exhaustion phase.
5. Sector Heatmap
| Sector | Top Performer | Worst Performer | Momentum Signal | Institutional Activity |
|---|---|---|---|---|
| Banks | FCMB (+2.33%) | ACCESSCORP (-0.53%) | FCMB (High Volume Spike) | ZENITHBANK (20.2% of Inst. Trades) |
| Insurance | WAPIC (+8.45%) | SOVRENINS (YTD -17.1%) | REGALINS (15DMA Bullish) | - |
| Beverages | NB (+2.49%) | - | NB (183% Volume Spike) | - |
| Consumer | BETAGLAS (+10%) | VETINDETF (-4.76%) | BETAGLAS (RSI: 96.8) | - |
| ETF | GREENWETF (+10%) | MERGROWTH (-9.97%) | MERGROWTH (Bearish 15DMA cross) | - |
6. Dividend-Beta Matrix: Defensive Picks
| Stock | Div. Yield (%) | Beta | Momentum? | Commentary |
|---|---|---|---|---|
| CAP | 4.13 | 0.04 | Bullish (15DMA Breakout) | Low beta plus high yield; jump in price suggests strong defensive and upside play. |
| REGALINS | 6.52 | 0.47 | Bullish (15DMA Cross) | Attractively defensive with surge in volume and yield. |
| FIDSON | 4.14 | 0.25 | Bullish (15DMA Cross, modest move) | Potential value with sustained uptrend. |
| CAVERTON | 5.52 | 0.98 | Bullish (15DMA Cross) | Attractive for income-seeking investors looking for momentum laggards. |
| DANGSUGAR | 4.27 | 1.35 | Bullish (15DMA Cross) | Momentum plus dividend—a rare combo. |
7. Institutional Clustering Alerts
- ZENITHBANK: Accounted for 20.17% of institutional day’s trade value, signaling major funds moving in/out — traders should keep an eye on price stability, as large cross trades may continue.
- GTCO, MTNN, ACCESSCORP round up the rest of the institutional cluster — expect volatility as the large flows could drive price in either direction next week.
8. High Dividend Yields in Momentum Tables
- REGALINS and DANGSUGAR exhibit above-average dividend yields with bullish 15DMA crossovers, attractive for both income investors and momentum traders.
- CAVERTON: Sporting a high dividend and strong bullish signal, yet with moderate beta—ideal for cautious but opportunistic investors.
9. Trader Suggestions and Key Watch-List
- Monitor Overbought Names: Stocks like BETAGLAS with extreme RSI (>95) and large single-day spikes are susceptible to profit-taking; consider trailing stops or partial profit booking.
- Opportunistic Longs could focus on stocks with fresh 15DMA crossovers, sustained institutional activity, and supportive fundamentals (e.g., CAP, FIDSON, REGALINS, DANGSUGAR, CAVERTON).
- Caution for Bears: Avoid fresh shorts in heavily oversold YTD laggards until/con unless momentum reverses.
- Watch Unusual Volume Names: TRANSCORP POWER (TRASNPOWER), FCMB, and NB may see follow-through next week given massive liquidity influx—perfect for liquidity-driven traders.
10. YTD Top Gainers & Losers Table
| Name | YTD %Chg | 5-Day %Chg | RSI |
|---|---|---|---|
| AUSTINLAZ | 60.22 | 20.83 | 74.65 |
| NCR | 90.91 | 20.69 | 98.06 |
| ENAMELWA | 102.07 | 19.45 | 98.79 |
| BETAGLAS | 34.56 | 10.00 | 96.78 |
| MULTIVERSE | 35.40 | 11.22 | 68.12 |
| Name | YTD %Chg | 5-Day %Chg | RSI |
|---|---|---|---|
| MERGROWTH | 103.80 | -24.80 | 59.34 |
| ROYALEX | 104.55 | -19.64 | 50.31 |
| WAPIC | 29.96 | -19.55 | 47.81 |
| THOMASWY | 57.89 | -18.91 | 49.81 |
| MCNICHOLS | 98.76 | -15.34 | 50.41 |
11. Market Activity / Trades Summary: Retail vs Institutional Insights
| Investor Type | Trades (%) | Volume (%) | Trade Value (%) | Total Trades | Total Volume | Total Value (₦B) |
|---|---|---|---|---|---|---|
| Institutional | 41.20% | 69.82% | 92.12% | 1,853 | 536.85M | 24.08 |
| Retail | 58.80% | 30.18% | 7.88% | 24,135 | 232.00M | 2.06 |
- Institutional investors dominated actual money flows (92%+ of value, 70%+ of volume) but did so in far fewer trades (41%). Typical of block trades in large caps.
- Retail dominated by trade count, but concentrated in smaller values — signatures of speculative or activity-driven trading.
| Top 5 Most Traded by Institutional Investors | |||
|---|---|---|---|
| Symbol | Trade Count | Volume | Value (₦BQ) |
| GTCO | 142 | 15.04M | 1.40 |
| MTNN | 132 | 1.60M | 0.67 |
| ZENITHBANK | 131 | 8.80M | 0.61 |
| ACCESSCORP | 116 | 23.64M | 0.63 |
| ARADEL | 112 | 1.11M | 0.56 |
| Top 5 Most Traded by Retail Investors | |||
|---|---|---|---|
| Symbol | Trade Count | Volume | Value (₦BQ) |
| UBA | 1,021 | 2.41M | 0.12 |
| GTCO | 996 | 0.96M | 0.09 |
| MTNN | 994 | 0.19M | 0.08 |
| ZENITHBANK | 910 | 1.26M | 0.09 |
| ACCESSCORP | 844 | 2.96M | 0.08 |
- Banking names (GTCO, ZENITHBANK, ACCESSCORP) continue to attract both institutional and retail trading — signals confidence in sector leadership and liquidity.
- Overlap in retail/institutional activity with high volume spikes in FCMB, GTCO, MTNN, and ZENITHBANK: May suggest coordinated or herding behavior, leading to short-term momentum swings.
- TRANSCORP POWER: Off-chart volume (8,700% of average); keep on watch for post-event volatility and potential reversion.
12. Hidden/Advanced Insights & Potential Opportunities
- Momentum Diversification: Opportunities exist in stocks crossing above 15DMA with defensive characteristics (low beta, high yield). CAP, REGALINS, DANGSUGAR, CAVERTON fit this template.
- Contrarian Play on MERGROWTH: Despite severe drops, remaining positive MACD and high historical volatility may attract rebound traders.
- Beware Exhaustion in High RSI Gainers: BETAGLAS, NCR, ENAMELWA are deeply overbought — trailing stops or profit taking is prudent; monitor order book liquidity for shakeouts.
- Event-Driven Volatility: Unusual volume spikes, especially with off-index names like TRANSCORP POWER, often precede large directional moves post-news or results — monitor closely.
- Institutional Rotation: With value and turnover shifting back into banks and select consumer names, expect continued leadership unless macro catalysts disrupt flows.
- Retail Herding in Banks suggests possible short-term reversals if news disappoints, but overall liquidity remains very supportive in large caps.
For further quantitative and technical drill-downs, consult RSI/MACD cross-tab signals and sectoral flows using InfoWARE's analytical terminal. Next week will be pivotal as markets either consolidate gains or see profit-booking volatility.
|
Top ASI Gainers Over Last 5 Trading Days
|
Top ASI Losers Over Last 5 Trading Days
|
For more detailed analysis, on InfoWARE Market Data Terminal <NSEPERF> <GO>
On InfoWARE Finance Mobile App (Android, iPhone & iPad, Windows Phone and Windows 8/10), "Top Gainers & Losers"
BETA GLASS CO PLC. (BETAGLAS) topped the advancers list closing at N449.35 with a gain of 10.00% followed by FTN COCOA PROCESSORS PLC (FTNCOCOA) which closed at N6.60 with a gain of 10.00%.
On the flip side LOTUS HALAL EQUITY ETF (LOTUSHAL15) and GEREGU Power PLC (GEREGU) topped the decliners log with a loss of -10.00% at a close of N106.20, and -10.00% to close the day at N1,027.40 respectively.
| Symbol | LClose | %Chg |
|---|---|---|
| BETAGLAS | 449.35 | 10.00 |
| FTNCOCOA | 6.60 | 10.00 |
| GREENWETF | 347.49 | 10.00 |
| UPDC | 6.93 | 10.00 |
| VERITASKAP | 1.98 | 10.00 |
| Symbol | LClose | %Chg |
|---|---|---|
| LOTUSHAL15 | 106.20 | -10.00 |
| GEREGU | 1,027.40 | -10.00 |
| MERGROWTH | 804.00 | -9.97 |
| THOMASWY | 3.00 | -9.91 |
| MCNICHOLS | 3.20 | -7.51 |
For more detailed analysis,
- On InfoWARE Market Data Terminal <TOPG> <GO>
- On InfoWARE Finance Mobile App ( Android, iPhone & iPad and Windows 10) , "Top Gainers & Losers"
Currency Market
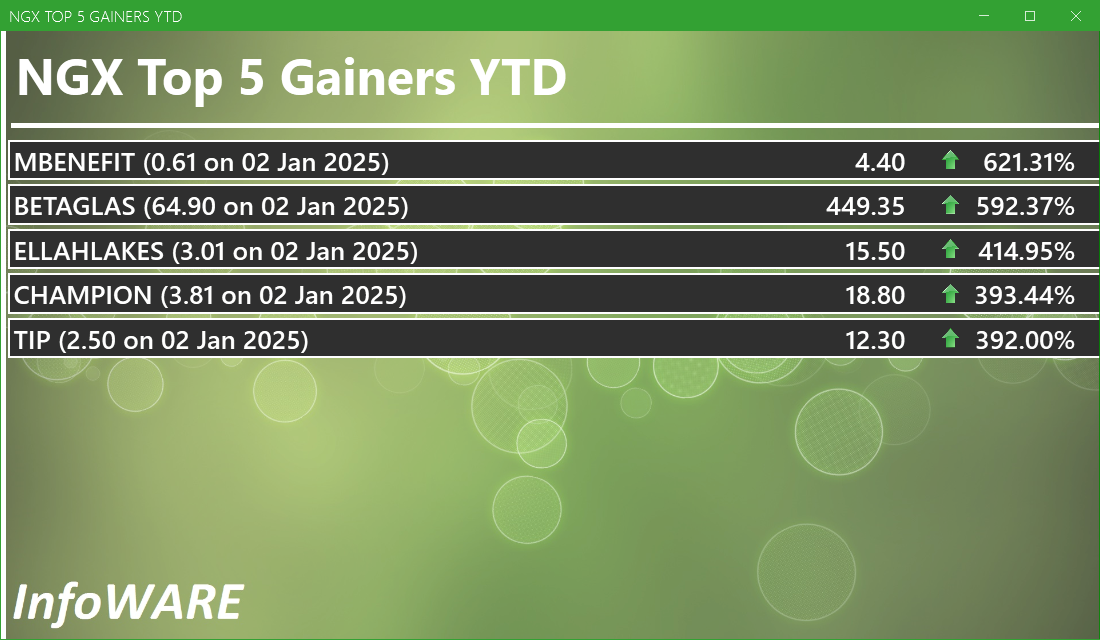
In the currency market, the Naira appreciated 0.03%(0.49) against the Dollar to settle at 1 to 1Investment Insights - Top 5 Gainers YTD
These stocks are the best performers whose price has risen faster than the market as a whole with the best returns year to date. Momentum investors believe that stocks that have outperformed the market will often continue to do so because the factors that caused them to outperform will not suddenly disappear. In addition, other investors seeking to benefit from the stock’s outperformance will often purchase the stock, further bidding its price higher and pushing the stock higher still
For more detailed analysis,
- On InfoWARE Market Data Terminal <T5YTD2> <GO>
- On InfoWARE Finance Mobile App ( Android , iPhone & iPad and Windows 10) , "Research"
NSE: Bull Signal - Price crossed above 15 Day MA
This signal implies these stocks are under buying pressure and the price might continue to rise and therefore positions should be monitored closely. Further suggested analysis include looking at the overall market (ASI) to see if the uptrend is market wide, sector wide or specific to the stock. Portfolio managers tend to use this as a signal to do more research to add to their positions or lock in some profits. Typically further analysis should be done using commands like PC and RV on the InfoWARE Market Data Terminal. Another command is ALERTS to set price triggers for possible exit or entry as necessary
For more detailed analysis,
- On InfoWARE Market Data Terminal <NSEPERF> <GO>
- On InfoWARE Finance Mobile App ( Android , iPhone & iPad and Windows 10) , "Top Gainers & Losers"
| Symbol | Price | %Chg | 15DMA | PE | EPS | DivY | MktCap | Vol | Trades | Value | LstTradeTime |
|---|---|---|---|---|---|---|---|---|---|---|---|
| FTNCOCOA | 6.60 | 9.09 | 6.36 | 0.00 | 0.00 | 1.60 | 25.74B | 2.67M | 202.00 | 17.36M | 22-Aug-2025 14:30:07.500 |
| VETGRIF30 | 55.00 | 9.09 | 52.20 | 0.00 | 0.00 | 277.00 | 4.00 | 14.48K | 22-Aug-2025 14:30:21.037 | ||
| UNIVINSURE | 1.22 | 9.02 | 1.15 | 0.00 | 0.00 | 0.00 | 19.52B | 20.94M | 192.00 | 25.30M | 22-Aug-2025 14:30:10.533 |
| REGALINS | 1.34 | 8.96 | 1.31 | 4.35 | 0.11 | 6.52 | 8.94B | 8.24M | 92.00 | 10.97M | 22-Aug-2025 14:30:09.660 |
| CAP | 70.20 | 8.69 | 69.50 | 12.92 | 2.90 | 4.13 | 57.20B | 405.17K | 26.00 | 27.94M | 22-Aug-2025 14:30:07.140 |
| NGXINS | 1,296.83 | 6.60 | 1,287.46 | 10.41 | 2.09 | 0.00 | 0.00 | 239.82M | 3,801.00 | 813.80M | 22-Aug-2025 14:30:12.530 |
| TANTALIZER | 2.65 | 5.66 | 2.64 | 0.00 | 0.00 | 1.50 | 8.51B | 2.23M | 79.00 | 5.96M | 22-Aug-2025 14:30:09.780 |
| CAVERTON | 7.30 | 4.11 | 7.04 | 1.15 | 1.57 | 5.52 | 24.46B | 1.17M | 118.00 | 8.14M | 22-Aug-2025 14:30:07.153 |
| FIDSON | 43.00 | 2.79 | 42.44 | 22.54 | 0.64 | 4.14 | 98.68B | 1.10M | 247.00 | 44.52M | 22-Aug-2025 14:30:07.477 |
| CUSTODIAN | 40.75 | 2.09 | 40.10 | 3.80 | 3.29 | 1.20 | 239.69B | 398.97K | 85.00 | 16.09M | 22-Aug-2025 14:30:07.260 |
| DANGSUGAR | 60.00 | 1.67 | 59.24 | 11.48 | 3.06 | 4.27 | 728.81B | 1.22M | 487.00 | 73.30M | 22-Aug-2025 14:30:07.320 |
| NEWGOLD | 55,514.00 | 1.11 | 55,086.80 | 0.00 | 0.00 | 0.00 | 0.00 | 2.00 | 2.00 | 111.03K | 22-Aug-2025 14:30:20.983 |
NSE: BEAR Signal - Price crossed below 15 Day MA
This signal implies these stocks are under selling pressure and the price might continue to slide and therefore positions should be monitored closely. Further suggested analysis include looking at the overall market (ASI) to see if the downtrend is market wide, sector wide or specific to the stock. If the overal market trend is upwards, then since these stocks are heading in the opposite direction, then further analysis should be done using commands like PC and RV on the InfoWARE Market Data Terminal. Another command is ALERTS to set price triggers for possible exit is necessar
For more detailed analysis,
- On InfoWARE Market Data Terminal <BEARM> <GO>
- On InfoWARE Finance Mobile App ( Android , iPhone & iPad and Windows 10)
| Symbol | Price | %Chg | 15DMA | PE | EPS | DivY | MktCap | Vol | Trades | Value | LstTradeTime |
|---|---|---|---|---|---|---|---|---|---|---|---|
| MERGROWTH | 804.00 | -11.07 | 889.26 | 0.00 | 0.00 | 33.00 | 7.00 | 26.99K | 22-Aug-2025 14:30:20.963 |
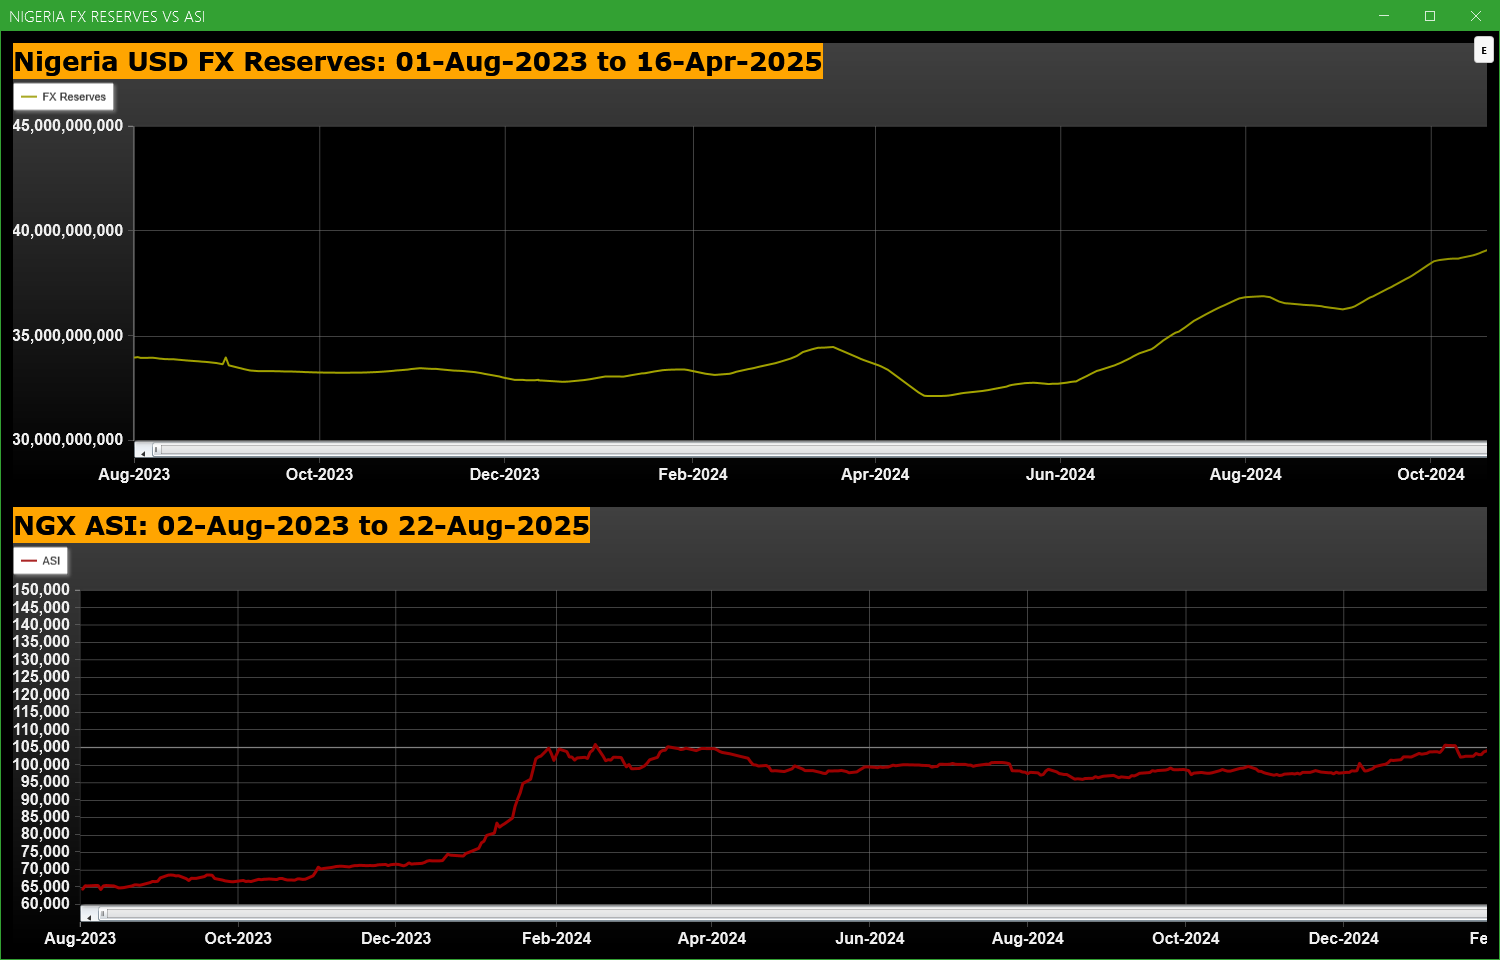
Economic Indicators - Nigeria FX Reserves Vs ASI Chart
Nigeria FX Reserves are assets held on reserve by CBN in foreign currencies. These reserves are used to back liabilities and influence monetary policy. Given the nature of the Nigeria economy, FX Reserves can appear to have an outsize influence on the economy and hence on the capital market. The chart below allows comparison of FX Reserves against the ASI to make investment decisions
For more detailed analysis,
- On InfoWARE Market Data Terminal <CI> <GO>
- On InfoWARE Finance Mobile App ( Android , iPhone & iPad and Windows 10) , "Research"
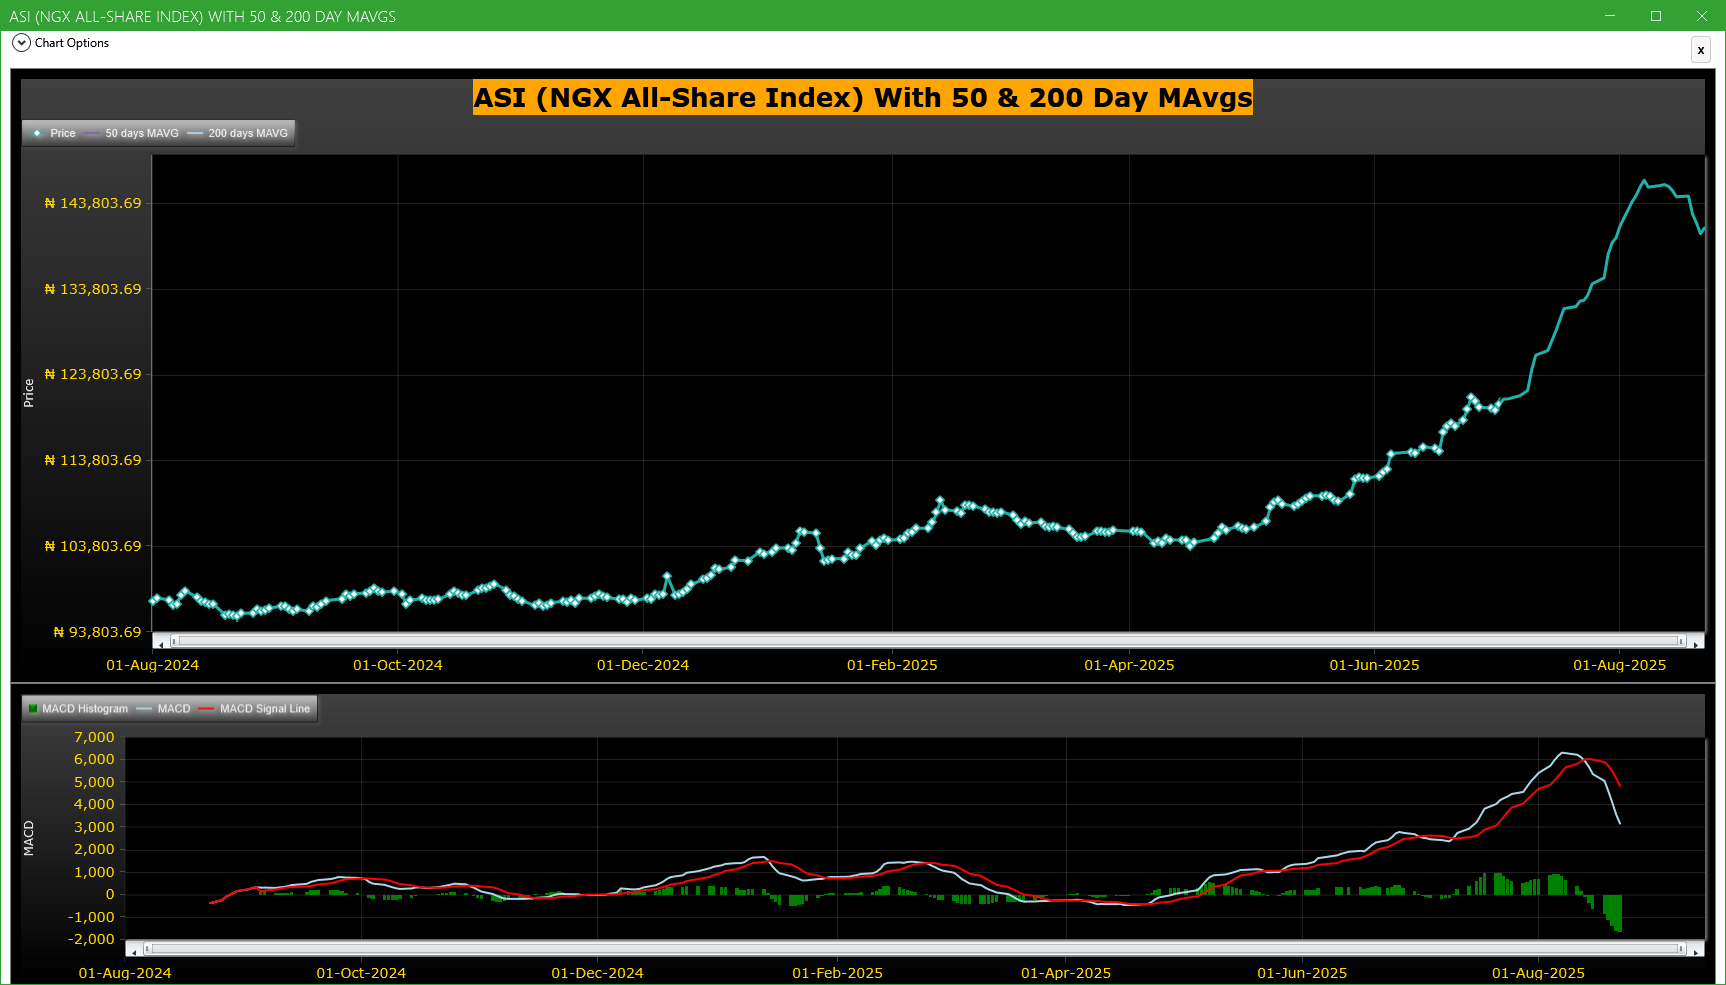
Market Trend - ASI (NGX All-Share-Index) With 50 & 200 Day MAvgs Chart
Technical traders typically use the 50 & 200 day moving averages to aid in choosing
where to enter or exit a position, which then causes these levels to act as strong
support or resistance. As a general guideline, if the price is above a moving average,
the trend is up. If the price is below a moving average, the trend is down.
It is important to note that critics of technical analysis say that moving averages act
as support and resistance because so many traders use these indicators to inform their
trading decisions. Also moving averages tend to work quite well in strong trending conditions
but poorly in choppy or ranging conditions.
Trading Strategies: Crossovers
Crossovers are one of the main moving average strategies. The first type is a price crossover,
which is when the price crosses above or below a moving average to signal a potential change
in trend. Another strategy is to apply two moving averages to a chart: one longer and one
shorter. When the shorter-term MA crosses above the longer-term MA, it is a buy signal, as
it indicates that the trend is shifting up. This is known as a golden cross. Meanwhile, when
the shorter-term MA crosses below the longer-term MA, it is a sell signal, as it indicates that
the trend is shifting down. This is known as a dead/death cross
For more detailed analysis,
- On InfoWARE Market Data Terminal <CI> <GO>
- On InfoWARE Finance Mobile App ( Android , iPhone & iPad and Windows 10) , "Research"
Unusual Volume: Volume traded is more than double the 90 day moving average (All exchanges; ASI & ASem). For more detailed analysis,
- On InfoWARE Market Data Terminal <UV> <GO>
- On InfoWARE Finance Mobile App ( Android , iPhone & iPad and Windows 10)
| Symbol | Name | Volume | 90DAvgVol | %VolChg | Price | LClose | %Chg | Trades | Value |
|---|---|---|---|---|---|---|---|---|---|
| FCMB | FCMB GROUP PLC. | 135.96M | 46.57M | 191.95 | 11.00 | 10.75 | 2.33 | 448 | 1.46B |
| NB | NIGERIAN BREW. PLC. | 43.26M | 15.26M | 183.50 | 70.00 | 68.30 | 2.49 | 237 | 3.03B |
| WAPIC | WAPIC INSURANCE PLC | 33.33M | 11.78M | 183.01 | 3.21 | 2.96 | 8.45 | 260 | 103.56M |
| TRANSPOWER | TRANSCORP POWER PLC | 29.76M | 338.13K | 8,702.51 | 286.50 | 286.50 | 0.00 | 162 | 8.52B |
| STANBIC | STANBIC IBTC HOLDINGS PLC | 13.33M | 2.79M | 377.47 | 94.00 | 94.50 | -0.53 | 199 | 1.25B |
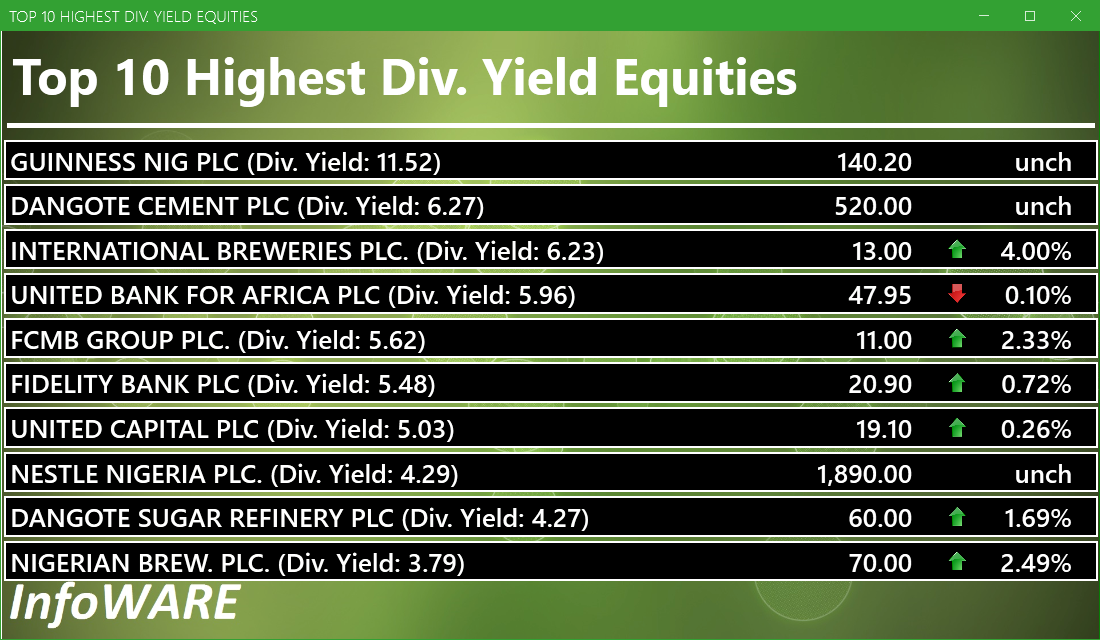
Investment Insights - High Div. Stocks
Dividend stocks distribute a portion of the company earnings to investors on a regular basis and they can a great choice for investors looking for regular income. As an investment or trading strategy, high dividend yield equities provide annual cash payments as against mostly capital gains in the price of a stock. The list in the table below represent the highest dividend paying stocks from the list of the most liquid stocks in the NSE top 30.
For more detailed analysis,
- On InfoWARE Market Data Terminal <HYIELD> <GO>
- On InfoWARE Finance Mobile App ( Android , iPhone & iPad and Windows 10) , "Research"
Investment Insights - Stocks outperforming the ASI but with approximately the same risk
These list of stocks represent equities that are less risky than the ASI but doing better than the ASI (All Shares Index) using the YTD (Year to Date) returns as the measure. The risk is measured by Beta. Beta is an assessment of a stock's tendency to undergo price changes, (its volatility), as well as its potential returns compared to the ASI. It is expressed as a ratio, where a score of 1 represents performance comparable to the ASI, and returns above or below the market may receive scores greater or lower than 1.
For a full list of both positively and negatively corelated stocks visit InfoWARE Market Data Terminal
- On InfoWARE Market Data Terminal <BANL> <GO>
- On InfoWARE Finance Mobile App ( Android , iPhone & iPad and Windows 10)
| Symbol | DivYield | PE | EPS | Beta | %ChgYTD | ASIYTDReturn | BetaDiff |
|---|---|---|---|---|---|---|---|
| HONYFLOUR | 1.40 | 16.28 | 0.31 | 0.99 | 232.37 | 36.66 | 0.01 |
| CAVERTON | 5.52 | 1.15 | 1.57 | 0.98 | 186.27 | 36.66 | 0.02 |
| ROYALEX | 7.81 | 0.00 | 0.00 | 0.96 | 104.55 | 36.66 | 0.04 |
| CORNERST | 5.28 | 8.62 | 0.35 | 0.93 | 79.29 | 36.66 | 0.07 |
| DEAPCAP | 13.76 | 188.84 | 0.01 | 0.89 | 50.00 | 36.66 | 0.11 |
| UNIVINSURE | 0.00 | 0.00 | 0.00 | 0.83 | 69.44 | 36.66 | 0.17 |
| FTNCOCOA | 1.60 | 0.00 | 0.00 | 0.79 | 251.06 | 36.66 | 0.21 |
| NB | 3.79 | 16.95 | 1.60 | 0.79 | 118.75 | 36.66 | 0.21 |
| MAYBAKER | 3.75 | 58.94 | 0.14 | 0.78 | 92.02 | 36.66 | 0.22 |
| UNILEVER | 2.81 | 67.09 | 0.40 | 0.75 | 112.50 | 36.66 | 0.25 |
African Markets
| Name | LClose | Change | %Chg |
|---|---|---|---|
| BRVM Stock Exchange | 317.30 | -0.41 | -0.13 |
| Botswana Stock Exchange | 10,559.33 | 6.33 | 0.06 |
| Egyptian Exchange | 35,731.83 | -368.22 | -1.02 |
| Lusaka Stock Exchange | 22,742.55 | 56.71 | 0.25 |
| Malawi Stock Exchange | 465,363.88 | 1,854.04 | 0.40 |
| Nigeria Stock Exchange | 141,566.30 | -1,041.03 | -0.73 |
| Nairobi Securities Exchange | 167.75 | 1.56 | 0.94 |
| Rwanda Stock Exchange | 178.88 | -0.11 | -0.06 |
| Uganda Securities Exchange | 1,410.04 | 5.20 | 0.37 |
Nigeria Market Indexes
| Symbol | LClose | %Chg | WTD% | MTD% | QTD% | YTD% | MktCap | Trades |
|---|---|---|---|---|---|---|---|---|
| ASI | 141,004.14 | 0.48 | -2.57 | -0.18 | 17.76 | 36.66 | 24,333 | |
| NGX30 | 5,139.93 | 0.37 | -2.56 | -0.88 | 8.81 | 34.74 | 11,641 | |
| NGXAFRBVI | 3,599.03 | 1.06 | -2.54 | -5.64 | 1.57 | 45.08 | 4,466 | |
| NGXAFRHDYI | 22,534.86 | 0.69 | -3.89 | -2.97 | 7.75 | 32.34 | 5,210 | |
| NGXASEM | 1,538.10 | 0.00 | 0.00 | 6.34 | -3.57 | -2.88 | 5 | |
| NGXBNK | 1,547.31 | 0.83 | -1.99 | -4.42 | 2.42 | 42.29 | 5,163 | |
| NGXCG | 4,104.64 | 0.71 | -2.04 | -4.58 | 19.37 | 45.08 | 11,747 | |
| NGXCNSMRGDS | 3,219.06 | 1.08 | -0.32 | 8.15 | -7.20 | 85.61 | 2,574 | |
| NGXCOMMDTY | 1,070.07 | 0.00 | 0.00 | -2.36 | 2.18 | 7.00 | ||
| NGXGROWTH | 11,622.73 | 1.78 | 4.41 | 5.01 | 22.22 | 49.72 | 375 | |
| NGXINDUSTR | 4,992.51 | -0.08 | -8.31 | -1.25 | 41.72 | 39.78 | 2,017 | |
| NGXINS | 1,296.83 | 7.06 | -8.97 | 46.21 | 75.58 | 64.95 | 3,801 | |
| NGXLOTUSISLM | 11,560.93 | 0.01 | -2.72 | -0.56 | 20.75 | 65.92 | 4,418 | |
| NGXMAINBOARD | 6,824.54 | 0.67 | -1.72 | 2.79 | 15.69 | 36.38 | 18,781 | |
| NGXMERIGRW | 10,033.33 | 0.85 | -1.48 | -2.68 | 3.95 | 53.81 | 3,517 | |
| NGXMERIVAL | 13,886.97 | 0.61 | -1.45 | -4.40 | 16.23 | 33.14 | 5,458 | |
| NGXOILGAS | 2,385.80 | 0.07 | -0.56 | -2.09 | -0.26 | -12.00 | 349 | |
| NGXPENBRD | 2,611.63 | 0.65 | -2.45 | 0.21 | 13.58 | 42.59 | 19,700 | |
| NGXPENSION | 6,709.74 | 0.65 | -1.86 | -2.96 | 5.59 | 47.99 | 13,071 | |
| NGXPREMIUM | 13,984.84 | 0.10 | -4.13 | -5.29 | 21.93 | 43.69 | 5,177 | |
| NGXSOVBND | 659.52 | 0.00 | -1.78 | -1.98 | 0.92 | 9.64 | 0 |
For more detailed analysis,
- On InfoWARE Market Data Terminal <MKTINS> <GO>
- On InfoWARE Finance Mobile App ( Android, iPhone & iPad and Windows 10) , "Market Indexes"
Find the topic interesting? Will like to comment? Contact Us at solutions@infowarelimited.com
Top News

InfoWARE AI Analyst Weekly Market Report: 22-Aug-2025
Chart Of The Day - ASI Chart Vs ASI Advance Decline Line (YTD) (22-Aug-2025 15:06:53.357)
InfoWARE AI Analyst Daily Market Report: 22-Aug-2025

[XNSA]>> NORRENBERGER MUTUAL FUNDS WEEKLY UPDATE
[XNSA]>> OFF MARKET TRADE
[XNSA]>> CORDROS MILESTONE FUNDS' BID & OFFER PRICES
[XNSA]>> APPOINTMENT OF A DIRECTOR
[XNSA]>> OFF MARKET TRADE
[PRESCO]>>Corporate Disclosures-<PRESCO PLC>
[XNSA]>> DAILY FUND PRICE SUBMISSION - FCMB ASSET MANAGEMENT LIMITED
[XNSA]>> RECLASSIFICATION OF STERLING FINANCIAL HOLDINGS COMPANY PLC
[XNSA]>> RECLASSIFICATION OF ABBEY MORTGAGE BANK PLC
[VETGOODS]>> DAILY INDICATIVE PRICES
[XNSA]>> REGISTRATION FOR BATCH TWO- 2025 DEALING CLERKSHIP CERTIFICATION PROGRA
[XNSA]>> NGX NON-INTEREST FINANCE BOARD LAUNCH COMMUNIQUE
[XNSA]>> UPDATED- SAVE THE DATE: 29TH ANNUAL STOCKBROKERS CONFERENCE
[SIAMLETF40]>> DAILY INDICATIVE PRICES
[XNSA]>> NOTIFICATION OF PRICE ADJUSTMENT
Chart Of The Day - ASI Chart Vs ASI Advance Decline Line (YTD) (21-Aug-2025 15:11:30.581)
InfoWARE AI Analyst Daily Market Report: 21-Aug-2025
[XNSA]>> APPOINTMENT OF A DIRECTOR
[XNSA]>> DAILY FUND PRICE SUBMISSION - FCMB ASSET MANAGEMENT LIMITED
[XNSA]>> NGX FIXED INCOME INDICATIVE PRICE LIST FOR AUGUST 21, 2025
[VETBANK]>> DAILY INDICATIVE PRICES
[XNSA]>> CORDROS MILESTONE FUNDS' BID & OFFER PRICES
[XNSA]>> REGISTRATION FOR BATCH TWO- 2025 DEALING CLERKSHIP CERTIFICATION PROGRA
[XNSA]>> NGX NON-INTEREST FINANCE BOARD LAUNCH COMMUNIQUE
[XNSA]>> UPDATED- SAVE THE DATE: 29TH ANNUAL STOCKBROKERS CONFERENCE
[SIAMLETF40]>> DAILY INDICATIVE PRICES
Chart Of The Day - ASI Chart Vs ASI Advance Decline Line (YTD) (20-Aug-2025 15:07:17.943)
Get IDIA - the stock trading app for the modern investor
Solutions by Business
Product Suites
Company
Contacts
- 8th Floor,
- South Atlantic Petroleum Towers,
- 1 Adeola Odeku Street,
- Victoria Island,
- Lagos, Nigeria.
- Email: solutions@infowarelimited.com
Follow Us
 |
 |
 |
 |