


InfoWARE AI Analyst Daily Market Report: 10-Sep-2025 | InfoWARE Finance
Get IDIA - the stock trading app for the modern investor


InfoWARE AI Analyst Daily Market Report: 10-Sep-2025
(Source: InfoWARE Terminal, Date: 10-Sep-2025)
Dear Investor,
NGX Daily Market Summary – Wednesday, September 10, 2025
Another Power-Packed Session: Market Caps Soar on Heavy Institutional Activity
The NGX All Share Index (ASI) inched up by 0.41% to close at 139,796.11, building on its robust YTD return of 36.04%. Trading action was especially vibrant today, as market turnover spiked to 17.17B Naira—a 62.26% surge from yesterday—supported by significant institutional flows. Trade volume also expanded notably to 705.49M shares (vs. 602.45M prior), underpinning bullish sentiment across key sectors.
Market Breadth & Key Trends
- Breadth Favors Bulls: The advance/decline ratio closed at 1.44x with 39 advancers vs. 27 decliners, reflecting widespread buying across mid and large caps.
- Volume Leadership: 71 companies posted higher day-on-day volume, hinting at broadening participation and possible sectoral rotation. Both activity and value were propelled primarily by institutional players (more below).
Top Gainers & Losers
- Biggest Gainer: CHELLARAM rose 10.00% (₦12.10), notching a YTD of 227.03%. Volume exploded (+1075% vs. average)—classic momentum breakout.
- Top Loser: FTNCOCOA fell 10.00% (₦5.94), reversing recent gains; other large losers were MAYBAKER (-9.97%), UNIONDICON (-9.72%), and CILEASING (-7.69%).
-
Notable YTD Momentum:
- CHELLARAM (+227.03%, RSI: 53.6) – Now leading both on the day and YTD, with strong technical backing.
- AIICO (+167.52%, RSI: 53.99) – Stable RSI and strong YTD suggest continuation potential.
- MAYBAKER appears as a top daily & YTD loser (-9.97% today, -3.85% YTD)—flagging persistent selling.
Significant Trends & Momentum Insights
- Turnover Surge: 62.3% spike in traded value signals strong conviction buyers (especially institutions) and opens door for potential follow-through moves.
- Advancers/Decliners: Broad market up-move; leading stocks crossed above technical resistance (15DMA) – notably SUNUASSUR, LIVESTOCK, ELLAHLAKES, WAPCO (all high momentum).
-
Unusual Volumes:
- ARADEL (+3.68%, Volume: 1963% above average)
- CHELLARAM (+10%, Volume: 1075% above average)
- THOMASWY (-7.04%, Volume: 484% above average), but price action negative
-
Bullish Momentum Names (15DMA Cross):
- SUNUASSUR & LIVESTOCK (RSI ~51, both >50, MACD neutral), signaling steady accumulation, not yet overbought.
- WAPCO (RSI: 49.98, New Highs, Positive YTD: +83.51%)
- ELLAHLAKES, FCMB, NB – All showing volume + price momentum, worth monitoring for trend continuations.
- No RSI above 70 → No extreme overbought signals currently among top crossers.
-
Bearish Momentum/Breakdown:
- DEAPCAP (-6.98% today, RSI <55, 15DMA cross below, YTD: 13.76%, high PE: 188.8x) – under pressure, potential technical unwinding.
- NPFMCRFBK, UNIVINSURE – Both with negative price momentum, 15DMA cross below, modest yields, risk of further declines.
Contrarian Signals
- DEAPCAP: Despite a massive PE (188x) and a high dividend yield (13.76%), shares crossed below 15DMA with -6.98% on heavy volume. Contradictory: ostensibly attractive yield, but technical and volume pressure suggest caution.
- NB (Nigerian Breweries): Volume surges 265% over average, closing just above 15DMA, positive price move (+2.07%). However, RSI still moderate and sector facing margin pressure—momentum traders beware of whipsaws if sentiment flips.
- MAYBAKER: Despite a 3.75% dividend yield with an RSI >50, the stock is a top loser both for the day & YTD (bearish momentum overrides).
Sector Heatmap
| Sector | Momentum | Volume Surge | YTD Trend |
|---|---|---|---|
| Banking/Financials | Mixed/Bullish (ZENITHBANK stable, ACCESSCORP solid, FCMB high volume + price cross) | FCMB (+347%), ZENITHBANK (high institutional interest) | Robust, market leaders |
| Insurance | Mixed - SUNUASSUR up, UNIVINSURE down | GUINEAINS/CONHALLPLC under pressure | Lagging overall |
| Manufacturing | Strong (WAPCO, CHELLARAM breakout) | CHELLARAM (+1075%), WAPCO (record highs) | Leadership emerging |
| Oil & Gas/Energy | Very Bullish (ARADEL, OANDO active) | ARADEL (+1963% vol), OANDO | Sector seeing rotation |
| Consumer Goods/Beverages | Healthy (NB, CADBURY, INTBREW mixed) | NB (+265% vol), INTBREW negative | Positive drift |
| ETF Indexes | Mixed/ETF rotation | NEWGOLD up | Selective momentum |
Dividend-Beta Matrix: Defensive Stock Opportunities
| Stock | Dividend Yield | Beta | YTD | Momentum | Implication |
|---|---|---|---|---|---|
| NB | 3.79% | 0.79 | Positive | Bullish cross | Defensive + current upside (if macro risk increases, lower beta attractive) |
| AIICO | 4.13% | 1.33 | 167.5% | YTD Gainer | High yield with above-market beta/risk profile |
| DEAPCAP | 13.76% | 0.89 | Bearish | Bearish cross | High yield, but technicals warn contrarians |
| FCMB | 5.62% | 1.17 | Bullish Vol | Bullish cross | Worth watching for price follow-through |
Institutional Activity & Clustering Alerts
- Institutions dominated trade value (96% of total), with just 3,886 deals (vs. 22,970 for retail). Volume share: Institutions 80.4% vs. Retail 19.6%.
-
Top Institutional Trades:
- ARADEL (₦22.95B, 43.4M shares) – market-defining block trade; also reflected as an unusual volume gainer.
- ZENITHBANK (₦1.80B, 27.3M shares), ACCESSCORP (₦0.99B, 37.6M shares)
- ZENITHBANK Institutional Trade Value Share: 20.17% (₦1.8B of ₦9B institutional total) – indicative of institutional clustering and current market leadership on large banks.
-
Retail Leaders:
- MTNN, ACCESSCORP, ZENITHBANK, GTCO, UBA – More fragmented, focus on blue-chips and high-liquidity names.
- Retail trade value: ₦1.64B (4% of total market), showing dominance by institutions.
- Patterns: Institutions are driving bulk large-cap momentum (especially oil & banking); retail flows follow but contribute much higher trade counts but less value. Institutional focus on ARADEL and ZENITHBANK matches their outsized price and volume moves.
Trader Suggestions & Tactical Insights
- Bullish Opportunities: Seek exposure in stocks with high volume breakouts, positive momentum (CHELLARAM, WAPCO, ARADEL). Watch for potential pullbacks for entry.
- Take Caution On: Recent high-yield but technical breakdown names (DEAPCAP, MAYBAKER). Despite attractive yields, momentum suggests further downside or volatility.
- Monitor Defensive Names: NB and FCMB – both display positive price action, high yield, moderate beta, good for risk-off periods.
- Watch Institutional Flow: If institutions continue to cluster in ARADEL, ZENITHBANK, WAPCO, anticipate further price leadership; retail-driven stocks may lag.
- Top Contrarian Play: NB: Spike in volume and price above MA, yet sector faces pressure; buy on dips with tight stop-losses.
- Currency Tailwind: Naira's 0.98% appreciation may boost importers and consumer stocks in the near term.
Tuesday/Wednesday Feature: Top 5 YTD Gainers & Losers
| Gainers | Symbol | Price | YTD % | RSI | MACD | DivY |
| CHELLARAMS PLC. | CHELLARAM | ₦11.00 | 227.03% | 53.55 | -0.14 | 1.99% |
| AIICO INSURANCE | AIICO | ₦4.00 | 167.52% | 53.99 | 0.11 | 4.13% |
| MCNICHOLS PLC | MCNICHOLS | ₦3.80 | 136.02% | 53.45 | -0.03 | 5.88% |
| SOVEREIGN TRUST INS. | SOVRENINS | ₦2.95 | 137.40% | 53.99 | 0.13 | 3.75% |
| LAFARGE WAPCO PLC. | WAPCO | ₦119.95 | 83.51% | 49.98 | -6.27 | 2.70% |
| Losers | Symbol | Price | YTD % | RSI | MACD | DivY |
| MERGROWTH ETF | MERGROWTH | ₦414.90 | -96.28% | 42.12 | -72.82 | 0% |
| MAY & BAKER | MAYBAKER | ₦18.05 | -3.85% | 51.88 | -0.31 | 3.75% |
| UNION DICON | UNIONDICON | ₦10.80 | +33.56% | 51.31 | +0.11 | 6.25% |
| C & I LEASING | CILEASING | ₦6.50 | +30.43% | 50.02 | -0.28 | 1.20% |
| THOMAS WYATT | THOMASWY | ₦2.70 | +47.65% | 47.80 | -0.18 | 1.05% |
Key Analysis & Hidden Insights
- Breadth + Volume + Value All Expanding: Textbook bullish liquidity environment, with "smart money” signaling confidence.
- Institutional volume concentration drives trend leadership: Follow institutional block volumes for next potential breakouts.
- Divergence Watch: Names like DEAPCAP and MAYBAKER offer lessons—headline numbers (dividend, PE) matter less if technicals are breaking down.
- YTD/5-day Gainers overlap: CHELLARAM dominates all short and long-term leader boards, volume, and momentum—a potential basis for both trend and contrarian trades (watch for exhaustion).
- Bullish Momentum confirmed by multi-factor: RSI (~54-55) in top performers is healthy, avoiding overbought, but reinforces trend-following strategies.
- Banks and Oil & Gas: Institutional trades cluster here, suggesting continued market leadership.
Summary Table: Market Activity/Tape Read
| Investor Type | Trade Count | Volume | Gross Amount | % Trade Count | % Volume | % Trade Value |
|---|---|---|---|---|---|---|
| Institutional | 1,906 | 617.64M | ₦39.19B | 38.70% | 80.43% | 95.99% |
| Retail | 22,970 | 150.29M | ₦1.64B | 61.30% | 19.57% | 4.01% |
- Interpretation: Watch for follow-through in names with concentrated institutional buying. Retail activity is broad-based and risk-on but tends to lag major momentum swings.
Opportunities & Cautions
- Opportunities: Look for potential follow-through in volume/momentum breakouts (CHELLARAM, FCMB, ARADEL, WAPCO).
- Cautions: Stocks with high yield but poor technicals (e.g., DEAPCAP, MAYBAKER) may be yield traps—monitor for false rallies before scaling in.
- Sector Rotation Alert: Leadership is moving towards real assets, oil and banking block trades—seek tactical exposure.
Disclaimer: Market data referenced is as of September 10, 2025, and intended for informational use only. Investors should conduct their own due diligence.
|
Top ASI Gainers Over Last 5 Trading Days
|
Top ASI Losers Over Last 5 Trading Days
|
For more detailed analysis, on InfoWARE Market Data Terminal <NSEPERF> <GO>
On InfoWARE Finance Mobile App (Android, iPhone & iPad, Windows Phone and Windows 8/10), "Top Gainers & Losers"
CHELLARAMS PLC. (CHELLARAM) topped the advancers list closing at N12.10 with a gain of 10.00% followed by FTN COCOA PROCESSORS PLC (FTNCOCOA) which closed at N5.94 with a gain of 10.00%.
On the flip side MAY & BAKER NIGERIA PLC. (MAYBAKER) and UNION DICON SALT PLC. (UNIONDICON) topped the decliners log with a loss of -9.97% at a close of N16.25, and -9.72% to close the day at N9.75 respectively.
| Symbol | LClose | %Chg |
|---|---|---|
| CHELLARAM | 12.10 | 10.00 |
| FTNCOCOA | 5.94 | 10.00 |
| LOTUSHAL15 | 58.31 | 10.00 |
| BERGER | 39.00 | 9.86 |
| SUNUASSUR | 5.99 | 8.91 |
| Symbol | LClose | %Chg |
|---|---|---|
| MAYBAKER | 16.25 | -9.97 |
| UNIONDICON | 9.75 | -9.72 |
| CILEASING | 6.00 | -7.69 |
| THOMASWY | 2.51 | -7.04 |
| DEAPCAP | 1.72 | -6.52 |
For more detailed analysis,
- On InfoWARE Market Data Terminal <TOPG> <GO>
- On InfoWARE Finance Mobile App ( Android, iPhone & iPad and Windows 10) , "Top Gainers & Losers"
Currency Market
In the currency market, the Naira appreciated 0.98%(14.84) against the Dollar to settle at 1 to 1NSE: Bull Signal - Price crossed above 15 Day MA
This signal implies these stocks are under buying pressure and the price might continue to rise and therefore positions should be monitored closely. Further suggested analysis include looking at the overall market (ASI) to see if the uptrend is market wide, sector wide or specific to the stock. Portfolio managers tend to use this as a signal to do more research to add to their positions or lock in some profits. Typically further analysis should be done using commands like PC and RV on the InfoWARE Market Data Terminal. Another command is ALERTS to set price triggers for possible exit or entry as necessary
For more detailed analysis,
- On InfoWARE Market Data Terminal <NSEPERF> <GO>
- On InfoWARE Finance Mobile App ( Android , iPhone & iPad and Windows 10) , "Top Gainers & Losers"
| Symbol | Price | %Chg | 15DMA | PE | EPS | DivY | MktCap | Vol | Trades | Value | LstTradeTime |
|---|---|---|---|---|---|---|---|---|---|---|---|
| SUNUASSUR | 5.99 | 8.18 | 5.67 | 0.00 | 0.00 | 0.99 | 34.81B | 450.96K | 38.00 | 2.67M | 10-Sep-2025 14:30:35.397 |
| LIVESTOCK | 8.00 | 7.50 | 7.84 | 0.00 | 0.00 | 2.94 | 24.00B | 2.32M | 107.00 | 18.47M | 10-Sep-2025 14:30:11.943 |
| ELLAHLAKES | 14.00 | 7.00 | 13.99 | 0.00 | 0.00 | 0.00 | 28.00B | 7.71M | 407.00 | 106.24M | 10-Sep-2025 14:30:11.330 |
| WAPCO | 128.00 | 6.29 | 126.13 | 24.60 | 2.87 | 2.70 | 2,061.80B | 3.15M | 450.00 | 397.51M | 10-Sep-2025 14:30:37.600 |
| NEWGOLD | 54,000.00 | 5.37 | 53,587.68 | 0.00 | 0.00 | 0.00 | 0.00 | 1.00 | 1.00 | 54.00K | 10-Sep-2025 14:30:35.640 |
| CADBURY | 62.80 | 4.46 | 60.58 | 33.25 | 0.64 | 1.88 | 117.95B | 634.63K | 219.00 | 38.49M | 10-Sep-2025 14:30:10.900 |
| ARADEL | 530.00 | 3.55 | 513.92 | 0.00 | 0.00 | 1.72 | 2,302.77B | 43.43M | 545.00 | 23.01B | 10-Sep-2025 14:30:35.290 |
| HMCALL | 4.25 | 3.53 | 4.21 | 0.00 | 0.00 | 0.00 | 0.00 | 256.80K | 16.00 | 1.08M | 10-Sep-2025 14:30:11.647 |
| NB | 69.95 | 2.07 | 69.30 | 16.95 | 1.60 | 3.79 | 718.82B | 50.46M | 283.00 | 3.53B | 10-Sep-2025 14:30:12.323 |
| NGXINDUSTR | 4,993.74 | 1.61 | 4,963.13 | 39.90 | 18.97 | 0.00 | 0.00 | 11.59M | 2,270.00 | 1.20B | 10-Sep-2025 14:30:23.910 |
| UCAP | 19.20 | 1.56 | 18.92 | 19.15 | 0.93 | 5.03 | 115.20B | 5.77M | 267.00 | 110.34M | 10-Sep-2025 14:30:13.883 |
| NGXLOTUSISLM | 11,570.58 | 1.36 | 11,458.47 | 1,270.93 | 62.77 | 0.00 | 0.00 | 15.86M | 4,608.00 | 1.81B | 10-Sep-2025 14:30:23.947 |
| NGXOILGAS | 2,393.37 | 1.31 | 2,378.70 | 8.74 | 228.15 | 0.00 | 0.00 | 270.04K | 414.00 | 140.04M | 10-Sep-2025 14:30:23.980 |
| NGXPENBRD | 2,604.51 | 0.52 | 2,598.68 | 348.78 | 389.18 | 0.00 | 0.00 | 566.88M | 18,983.00 | 16.31B | 10-Sep-2025 14:30:23.990 |
| FCMB | 10.80 | 0.46 | 10.78 | 104.31 | 0.09 | 5.62 | 213.87B | 287.77M | 559.00 | 3.11B | 10-Sep-2025 14:30:11.460 |
| ASI | 140,365.36 | 0.41 | 140,226.77 | 11.84 | 457.69 | 0.00 | 0.00 | 705.49M | 23,386.00 | 17.17B | 10-Sep-2025 14:30:23.757 |
| NGX30 | 5,118.74 | 0.39 | 5,114.88 | 575.61 | 329.08 | 0.00 | 0.00 | 477.84M | 12,597.00 | 15.00B | 10-Sep-2025 14:30:23.763 |
| NGXMAINBOARD | 6,809.83 | 0.11 | 6,800.45 | 12.90 | 225.05 | 0.00 | 0.00 | 619.95M | 16,785.00 | 12.23B | 10-Sep-2025 14:30:23.957 |
| JOHNHOLT | 6.80 | 0.00 | 6.79 | 8.80 | 0.91 | 1.25 | 2.65B | 200.93K | 21.00 | 1.45M | 10-Sep-2025 14:30:11.790 |
NSE: BEAR Signal - Price crossed below 15 Day MA
This signal implies these stocks are under selling pressure and the price might continue to slide and therefore positions should be monitored closely. Further suggested analysis include looking at the overall market (ASI) to see if the downtrend is market wide, sector wide or specific to the stock. If the overal market trend is upwards, then since these stocks are heading in the opposite direction, then further analysis should be done using commands like PC and RV on the InfoWARE Market Data Terminal. Another command is ALERTS to set price triggers for possible exit is necessar
For more detailed analysis,
- On InfoWARE Market Data Terminal <BEARM> <GO>
- On InfoWARE Finance Mobile App ( Android , iPhone & iPad and Windows 10)
| Symbol | Price | %Chg | 15DMA | PE | EPS | DivY | MktCap | Vol | Trades | Value | LstTradeTime |
|---|---|---|---|---|---|---|---|---|---|---|---|
| SIAMLETF40 | 586.11 | 0.00 | 588.90 | 0.00 | 0.00 | 0.00 | 0.00 | 0.00 | 10-Sep-2025 14:30:35.647 | ||
| NAHCO | 103.45 | -1.50 | 103.57 | 92.98 | 0.41 | 6.66 | 201.63B | 1.08M | 136.00 | 112.06M | 10-Sep-2025 14:30:12.220 |
| STANBIC | 98.00 | -1.99 | 98.69 | 6.87 | 8.23 | 3.54 | 1,269.79B | 906.18K | 189.00 | 89.10M | 10-Sep-2025 14:30:13.670 |
| JAPAULGOLD | 2.70 | -2.96 | 2.71 | 0.19 | 12.01 | 0.90 | 16.91B | 25.28M | 230.00 | 67.26M | 10-Sep-2025 14:30:35.333 |
| INTBREW | 12.35 | -3.64 | 12.58 | 0.00 | 0.00 | 6.23 | 331.75B | 1.12M | 125.00 | 13.70M | 10-Sep-2025 14:30:11.740 |
| GUINEAINS | 1.57 | -4.46 | 1.58 | 66.79 | 0.01 | 1.96 | 9.64B | 1.98M | 107.00 | 3.13M | 10-Sep-2025 14:30:11.600 |
| CONHALLPLC | 4.21 | -4.51 | 4.27 | 69.63 | 0.03 | 2.08 | 45.07B | 2.34M | 96.00 | 10.10M | 10-Sep-2025 14:30:35.303 |
| UNIVINSURE | 1.18 | -5.93 | 1.23 | 0.00 | 0.00 | 0.00 | 18.88B | 15.50M | 214.00 | 18.99M | 10-Sep-2025 14:30:14.050 |
| NPFMCRFBK | 3.02 | -5.96 | 3.10 | 5.63 | 0.27 | 8.00 | 18.10B | 1.11M | 53.00 | 3.43M | 10-Sep-2025 14:30:12.793 |
| DEAPCAP | 1.72 | -6.98 | 1.75 | 188.84 | 0.01 | 13.76 | 2.58B | 1.92M | 65.00 | 3.34M | 10-Sep-2025 14:30:11.243 |
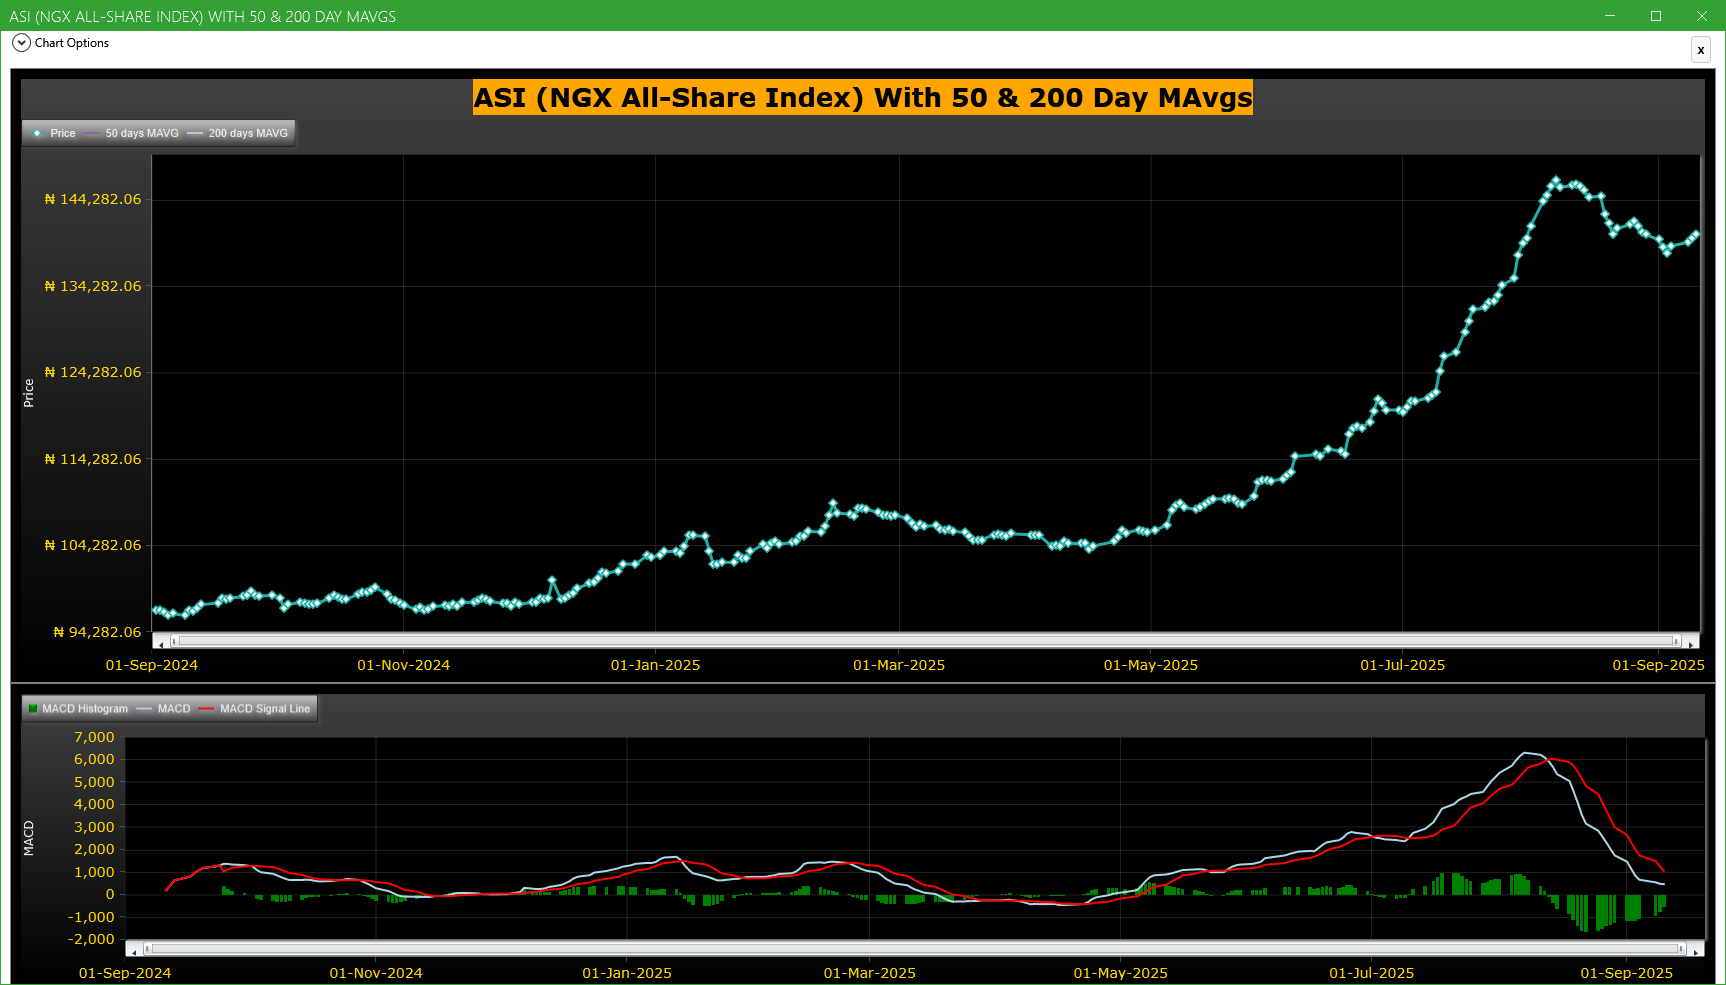
Market Trend - ASI (NGX All-Share-Index) With 50 & 200 Day MAvgs Chart
Technical traders typically use the 50 & 200 day moving averages to aid in choosing
where to enter or exit a position, which then causes these levels to act as strong
support or resistance. As a general guideline, if the price is above a moving average,
the trend is up. If the price is below a moving average, the trend is down.
It is important to note that critics of technical analysis say that moving averages act
as support and resistance because so many traders use these indicators to inform their
trading decisions. Also moving averages tend to work quite well in strong trending conditions
but poorly in choppy or ranging conditions.
Trading Strategies: Crossovers
Crossovers are one of the main moving average strategies. The first type is a price crossover,
which is when the price crosses above or below a moving average to signal a potential change
in trend. Another strategy is to apply two moving averages to a chart: one longer and one
shorter. When the shorter-term MA crosses above the longer-term MA, it is a buy signal, as
it indicates that the trend is shifting up. This is known as a golden cross. Meanwhile, when
the shorter-term MA crosses below the longer-term MA, it is a sell signal, as it indicates that
the trend is shifting down. This is known as a dead/death cross
For more detailed analysis,
- On InfoWARE Market Data Terminal <CI> <GO>
- On InfoWARE Finance Mobile App ( Android , iPhone & iPad and Windows 10) , "Research"
Unusual Volume: Volume traded is more than double the 90 day moving average (All exchanges; ASI & ASem). For more detailed analysis,
- On InfoWARE Market Data Terminal <UV> <GO>
- On InfoWARE Finance Mobile App ( Android , iPhone & iPad and Windows 10)
| Symbol | Name | Volume | 90DAvgVol | %VolChg | Price | LClose | %Chg | Trades | Value |
|---|---|---|---|---|---|---|---|---|---|
| FCMB | FCMB GROUP PLC. | 287.77M | 64.35M | 347.17 | 10.80 | 10.75 | 0.47 | 559 | 3.11B |
| NB | NIGERIAN BREW. PLC. | 50.46M | 13.79M | 265.87 | 69.95 | 68.50 | 2.12 | 283 | 3.53B |
| ARADEL | ARADEL HOLDINGS PLC | 43.43M | 2.11M | 1,963.11 | 530.00 | 511.20 | 3.68 | 545 | 23.01B |
| THOMASWY | THOMAS WYATT NIG. PLC. | 6.13M | 1.05M | 483.85 | 2.51 | 2.70 | -7.04 | 42 | 15.12M |
| CHELLARAM | CHELLARAMS PLC. | 837.35K | 71.24K | 1,075.37 | 12.10 | 11.00 | 10.00 | 65 | 9.75M |
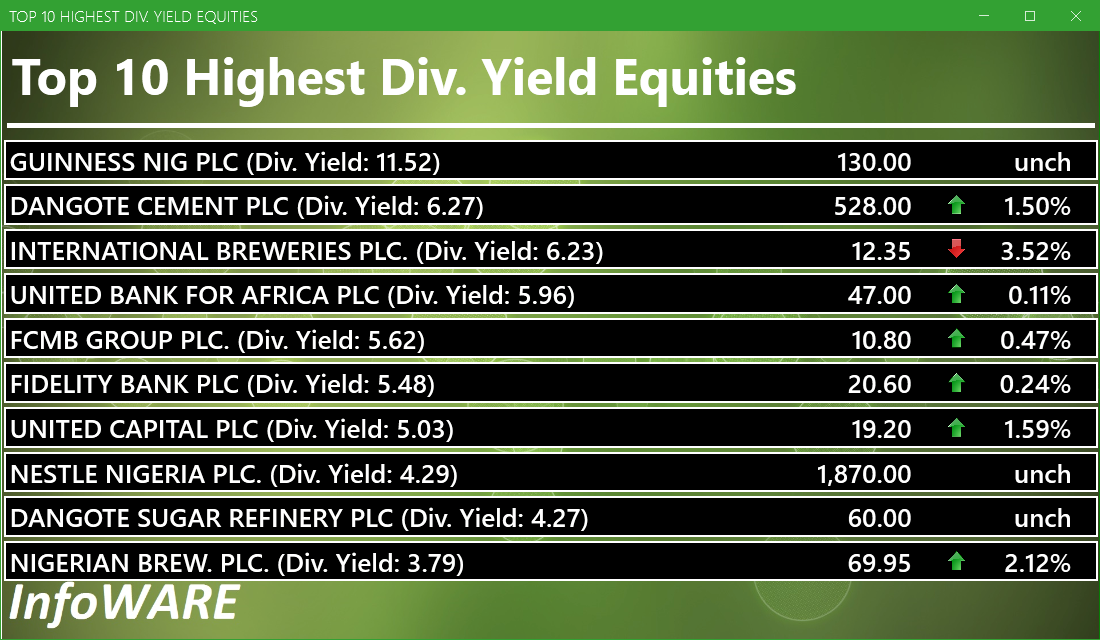
Investment Insights - High Div. Stocks
Dividend stocks distribute a portion of the company earnings to investors on a regular basis and they can a great choice for investors looking for regular income. As an investment or trading strategy, high dividend yield equities provide annual cash payments as against mostly capital gains in the price of a stock. The list in the table below represent the highest dividend paying stocks from the list of the most liquid stocks in the NSE top 30.
For more detailed analysis,
- On InfoWARE Market Data Terminal <HYIELD> <GO>
- On InfoWARE Finance Mobile App ( Android , iPhone & iPad and Windows 10) , "Research"
Investment Insights - Stocks outperforming the ASI but with approximately the same risk
These list of stocks represent equities that are less risky than the ASI but doing better than the ASI (All Shares Index) using the YTD (Year to Date) returns as the measure. The risk is measured by Beta. Beta is an assessment of a stock's tendency to undergo price changes, (its volatility), as well as its potential returns compared to the ASI. It is expressed as a ratio, where a score of 1 represents performance comparable to the ASI, and returns above or below the market may receive scores greater or lower than 1.
For a full list of both positively and negatively corelated stocks visit InfoWARE Market Data Terminal
- On InfoWARE Market Data Terminal <BANL> <GO>
- On InfoWARE Finance Mobile App ( Android , iPhone & iPad and Windows 10)
| Symbol | DivYield | PE | EPS | Beta | %ChgYTD | ASIYTDReturn | BetaDiff |
|---|---|---|---|---|---|---|---|
| HONYFLOUR | 1.40 | 16.28 | 0.31 | 0.99 | 219.36 | 36.04 | 0.01 |
| CAVERTON | 5.52 | 1.15 | 1.57 | 0.98 | 151.37 | 36.04 | 0.02 |
| ROYALEX | 7.81 | 0.00 | 0.00 | 0.96 | 105.45 | 36.04 | 0.04 |
| CORNERST | 5.28 | 8.62 | 0.35 | 0.93 | 78.79 | 36.04 | 0.07 |
| DEAPCAP | 13.76 | 188.84 | 0.01 | 0.89 | 43.33 | 36.04 | 0.11 |
| VERITASKAP | 4.17 | 48.77 | 0.02 | 0.88 | 47.65 | 36.04 | 0.12 |
| UNIVINSURE | 0.00 | 0.00 | 0.00 | 0.83 | 63.89 | 36.04 | 0.17 |
| FTNCOCOA | 1.60 | 0.00 | 0.00 | 0.79 | 215.96 | 36.04 | 0.21 |
| NB | 3.79 | 16.95 | 1.60 | 0.79 | 118.59 | 36.04 | 0.21 |
| MAYBAKER | 3.75 | 58.94 | 0.14 | 0.78 | 72.87 | 36.04 | 0.22 |
African Markets
| Name | LClose | Change | %Chg |
|---|---|---|---|
| BRVM Stock Exchange | 320.42 | -0.22 | -0.07 |
| Botswana Stock Exchange | 10,614.92 | 46.50 | 0.44 |
| Egyptian Exchange | 34,386.33 | -214.53 | -0.62 |
| Ghana Stock Exchange | 7,172.44 | 0.00 | 0.00 |
| Lusaka Stock Exchange | 24,581.00 | 9.83 | 0.04 |
| Casablanca Stock Exchange | 19,521.30 | -519.04 | -2.59 |
| Malawi Stock Exchange | 547,206.30 | 11,359.94 | 2.12 |
| Nigeria Stock Exchange | 139,796.11 | 404.24 | 0.29 |
| Nairobi Securities Exchange | 177.52 | 0.71 | 0.40 |
| Rwanda Stock Exchange | 178.91 | 0.04 | 0.02 |
| Uganda Securities Exchange | 1,430.46 | 7.12 | 0.50 |
Nigeria Market Indexes
| Symbol | LClose | %Chg | WTD% | MTD% | QTD% | YTD% | MktCap | Trades |
|---|---|---|---|---|---|---|---|---|
| ASI | 140,365.36 | 0.41 | 0.70 | 0.46 | 17.22 | 36.04 | 23,386 | |
| NGX30 | 5,118.74 | 0.39 | 0.72 | 0.43 | 8.36 | 34.18 | 12,597 | |
| NGXAFRBVI | 3,509.93 | 0.19 | 0.66 | 0.70 | -0.95 | 41.48 | 4,951 | |
| NGXAFRHDYI | 22,609.38 | 0.46 | 1.30 | 0.35 | 8.11 | 32.78 | 5,959 | |
| NGXASEM | 1,538.10 | 0.00 | 0.00 | 0.00 | -3.57 | -2.88 | 8 | |
| NGXBNK | 1,504.10 | 0.01 | 0.44 | -0.49 | -0.44 | 38.32 | 5,453 | |
| NGXCG | 4,030.18 | 0.44 | 0.80 | -0.11 | 17.20 | 42.45 | 12,045 | |
| NGXCNSMRGDS | 3,180.91 | 0.01 | 0.29 | -0.27 | -8.30 | 83.41 | 3,201 | |
| NGXCOMMDTY | 1,091.09 | 0.62 | 0.62 | 2.15 | 4.19 | 9.11 | ||
| NGXGROWTH | 12,071.41 | 0.58 | 7.62 | 7.78 | 26.94 | 55.50 | 248 | |
| NGXINDUSTR | 4,993.74 | 1.64 | 2.50 | 1.24 | 41.75 | 39.82 | 2,270 | |
| NGXINS | 1,333.80 | 0.11 | 1.09 | 3.96 | 80.58 | 69.65 | 2,070 | |
| NGXLOTUSISLM | 11,570.58 | 1.37 | 2.01 | 1.33 | 20.85 | 66.06 | 4,608 | |
| NGXMAINBOARD | 6,809.83 | 0.11 | 0.30 | 0.34 | 15.44 | 36.09 | 16,785 | |
| NGXMERIGRW | 9,965.09 | -0.15 | 0.55 | -0.49 | 3.24 | 52.76 | 3,268 | |
| NGXMERIVAL | 13,477.28 | 0.76 | 1.22 | 0.80 | 12.80 | 29.21 | 6,461 | |
| NGXOILGAS | 2,393.37 | 1.33 | 1.28 | 0.96 | 0.05 | -11.72 | 414 | |
| NGXPENBRD | 2,604.51 | 0.52 | 0.73 | 0.55 | 13.27 | 42.20 | 18,983 | |
| NGXPENSION | 6,634.04 | 0.49 | 0.77 | 0.21 | 4.40 | 46.32 | 14,163 | |
| NGXPREMIUM | 13,856.41 | 0.97 | 1.44 | 0.68 | 20.81 | 42.37 | 6,353 | |
| NGXSOVBND | 642.29 | -1.95 | -1.95 | -2.52 | -1.72 | 6.77 | 2 |
For more detailed analysis,
- On InfoWARE Market Data Terminal <MKTINS> <GO>
- On InfoWARE Finance Mobile App ( Android, iPhone & iPad and Windows 10) , "Market Indexes"
Find the topic interesting? Will like to comment? Contact Us at solutions@infowarelimited.com
Top News

Chart Of The Day - ASI Chart Vs ASI Advance Decline Line (YTD) (10-Sep-2025 15:11:27.842)
InfoWARE AI Analyst Daily Market Report: 10-Sep-2025

[XNSA]>> DAILY FUND PRICE SUBMISSION - FCMB ASSET MANAGEMENT LIMITED
[VETGOODS]>> DAILY INDICATIVE PRICES
[XNSA]>> NGX FIXED INCOME INDICATIVE PRICE LIST FOR SEP 10, 2025
[XNSA]>> CLOSING GONG CEREMONY AND FACTS BEHIND THE FIGURES BY DANGOTE CEMENT
[XNSA]>> REGISTRATION FOR BATCH TWO- 2025 DEALING CLERKSHIP CERTIFICATION PROGRA
[XNSA]>> UPDATED- SAVE THE DATE: 29TH ANNUAL STOCKBROKERS CONFERENCE
[XNSA]>> CLOSING GONG CEREMONY IN HONOUR OF ISSB DELEGATION
[STANBICETF30]>> DAILY INDICATIVE PRICES
Chart Of The Day - ASI Chart Vs ASI Advance Decline Line (YTD) (09-Sep-2025 15:07:15.662)
InfoWARE AI Analyst Daily Market Report: 09-Sep-2025
[XNSA]>> DAILY FUND PRICE SUBMISSION - FCMB ASSET MANAGEMENT LIMITED
[MERGROWTH]>> DAILY INDICATIVE PRICES
[XNSA]>> CORDROS MILESTONE FUNDS' BID & OFFER PRICES
[VSPBONDETF]>> DAILY INDICATIVE PRICES
[XNSA]>> NOTIFICATION OF LIFTING OF SUSPENSION
[XNSA]>> NGX FIXED INCOME INDICATIVE PRICE LIST FOR SEP 09, 2025
[XNSA]>> CLOSING GONG CEREMONY AND FACTS BEHIND THE FIGURES BY DANGOTE CEMENT
[XNSA]>> REGISTRATION FOR BATCH TWO- 2025 DEALING CLERKSHIP CERTIFICATION PROGRA
[SIAMLETF40]>> DAILY INDICATIVE PRICES
[XNSA]>> UPDATED- SAVE THE DATE: 29TH ANNUAL STOCKBROKERS CONFERENCE
[XNSA]>> CLOSING GONG CEREMONY IN HONOUR OF ISSB DELEGATION
Chart Of The Day - ASI Chart Vs ASI Advance Decline Line (YTD) (08-Sep-2025 15:08:59.751)
InfoWARE AI Analyst Daily Market Report: 08-Sep-2025
[MERVALUE]>> DAILY INDICATIVE PRICES
[XNSA]>> EMERGING AFRICA DAILY FUND PRICES
[VSPBONDETF]>> DAILY INDICATIVE PRICES
[XNSA]>> DAILY FUND PRICE SUBMISSION - FCMB ASSET MANAGEMENT LIMITED
[XNSA]>> EXTENSION IN TRADING OF UBA PLC'S RIGHTS ISSUE
Get IDIA - the stock trading app for the modern investor
Solutions by Business
Product Suites
Company
Contacts
- 8th Floor,
- South Atlantic Petroleum Towers,
- 1 Adeola Odeku Street,
- Victoria Island,
- Lagos, Nigeria.
- Email: solutions@infowarelimited.com
Follow Us
 |
 |
 |
 |