


InfoWARE AI Analyst Daily Market Report: 25-Sep-2025 | InfoWARE Finance
Get IDIA - the stock trading app for the modern investor


InfoWARE AI Analyst Daily Market Report: 25-Sep-2025
(Source: InfoWARE Terminal, Date: 25-Sep-2025)
Dear Investor,
NGX Daily Market Summary & Insights — Thursday, September 25, 2025
Market Overview
The NGX All Share Index (ASI) rose 0.31% today to close at 140,716.10, maintaining a positive trajectory with robust Year-To-Date (YTD) returns of 36.81%. Trading activity was energetic: daily volume expanded to 421.51M shares (up 10.52% from the prior day), and turnover rose to ₦16.85B (a 10.89% increase). Market breadth was healthy at 1.61x, with 37 advancers significantly outpacing 23 decliners. Retail/Institutional flows reveal that institutional players were notably dominant, accounting for over 83% of volume and 92% of trade value. Meanwhile, the Naira strengthened 0.37% to settle at 1,488/USD.
Key Breadth & Trend Insights
- Advancers vs. Decliners: The market’s risk-on sentiment persists: 37 stocks advanced, while only 23 declined.
- Broad Participation: Volumes rose in 73 stocks, exceeding the 64 that experienced declines—an encouraging sign of widespread momentum beyond index heavyweights.
- Trend Continuation: ASI’s close above 140k and uptick in volume/turnover signal continuation of Q3 bullish sentiment.
Top Gainers & Losers
| Rank | Stock | Close (₦) | % Change | RSI | Notes |
|---|---|---|---|---|---|
| 1 | LOTUS HALAL EQUITY ETF (LOTUSHAL15) | 83.45 | +9.99% | n/a | Strong ETF demand, possible sector/Islamic finance inflows. |
| 2 | MECURE INDUSTRIES PLC (MECURE) | 26.10 | +9.89% | 61.7 | Extending YTD surge; high RSI signals persistent bullish momentum (see below). |
| 3 | OANDO PLC (OANDO) | 49.00 | +9.50% | 46.7 | Momentum reversal after previous weakness; crossed above 15DMA (bullish crossover). |
| 4 | MCNICHOLS PLC (MCNICHOLS) | 3.64 | +9.31% | 48.1 | Small-cap, but showing robust buy activity and 15DMA bullish crossover. |
| 5 | CHAMS PLC (CHAMS) | 3.43 | +9.24% | 52.5 | Steady mid-level momentum; RSI climbing but not yet extreme. |
| 1 | MECURE INDUSTRIES PLC (MECURE) | 26.10 | -9.89% | 61.7 | Erroneously appears as both gainer/loser; possible data error or adjustment—watch for volatility. |
| 1 | ETERNA PLC. (ETERNA) | 27.90 | -10.00% | 46.4 | Bears continue to dominate; massive volume spike indicates institutional exit or stop-loss cascade. |
| 2 | SOVEREIGN TRUST INSURANCE (SOVRENINS) | 2.95 | -4.84% | 54.6 | Sharp sell pressure; 15DMA breakdown confirms momentum shift. |
| 3 | THE INITIATES PLC (TIP) | 12.02 | -3.84% | 52.5 | Broke below 15DMA; fresh bearish momentum developing. |
| 4 | CAVERTON OFFSHORE (CAVERTON) | 6.40 | -3.76% | 50.3 | Part of YTD loser list; sustained underlying weakness. |
| 5 | FIDSON HEALTHCARE (FIDSON) | 41.40 | -3.72% | 51.9 | Loss on moderate volume; approaching neutral RSI. |
Deep Dives: Technical, Volume & Thematic Highlights
- Turnover Up, Volume Up: The uptick in both value and traded volume—supported by 421.51M shares—suggests renewed institutional appetite. Historically, this often forecasts sustained price stability or appreciation, especially as the breadth ratio holds above 1.5x.
-
Momentum Focus:
- Bullish Momentum: OANDO and MCNICHOLS both closed above their 15-day moving averages, signaling likely buy-side continuation. MECURE remains notably strong with a high YTD return and robust RSI (currently 61.7).
- Bearish Momentum: TIP and SOVRENINS both crossed below their 15DMA today—these breakdowns, in contrast with ongoing ASI uptrend, warrant caution for momentum traders.
-
Unusual Volume Alerts:
- CONHALLPLC (Consolidated Hallmark Insurance) saw an astronomical 2,050% volume spike—unparalleled liquidity burst, likely driven by block trades or regulatory-driven accumulation. Yet, the stock remains a YTD underperformer (0.26% YTD), suggesting possible rotation or pre-corporate action activity.
- MTNN also posted massive volume expansion (494% over average), but price was steady. This may point to institutional redistribution rather than a clear directional bet.
- ETERNA PLC: Volume up 238%, price down -10%. Full-scale exit or forced selling pattern.
- YTD Leaders Are Today’s Momentum Stories:
- MECURE: Up 103% YTD and 20.8% in the last 5 days, with a strong positive MACD and RSI at 61.7. Momentum remains intact, but RSI approaching overbought — watch for profit-taking soon.
- CHELLARAMS: Up 339% YTD. While not a volume leader today, this name remains a clear "momentum stock” but RSI is now in the upper range (>68).
- OANDO: Negative YTD (-25.5%) but positive today — possible reversal in play, reinforced by bullish MACD crossover and 15DMA breakout.
- CAVERTON: On YTD losers and today's loser list — persistent negative beta pressure.
-
Retail vs Institutional Trading Patterns:
- Institutional dominance: Dominated volume (83%+) and value (92%+). Large blocks in MTNN, UBA, ZENITHBANK, ACCESSCORP point to portfolio rebalancing or pre-quarter-end window dressing.
- Retail Activity: Concentrated in UBA, MTNN, ZENITHBANK, ACCESSCORP, and GTCO. However, retail’s volume share remains small—typical for mature bull legs.
- Overlap with Unusual Volume: MTNN was extremely active in both retail and institutional trades, yet with nearly unchanged price — equilibrium established, watch for breakouts.
Contrarian Signals
- OANDO (OANDO): Reversal play. Despite bearish YTD (-25.5%), today it posted a strong +9.5% move, RSI climbed (now 46.7), bullish MACD crossover, and price cleared 15DMA — potential short squeeze or sentiment shift.
- TIP: Remains up on YTD (+2.2%) and 5D basis, but today’s close below 15DMA and negative MACD signal a near-term reversal risk.
- CHAMS: RSI sitting mid-range (52.5) with a bullish day, but not on volume leader board — momentum traders may want to see confirmation.
- CAVERTON: Appears on both YTD and daily loser tables; possible candidate for "falling knife” but RSI not deeply oversold (<51). Avoid contrarian long until capitulation or <30 RSI.
- MCNICHOLS: Bullish move (+9.3%) with positive MACD, but low beta and thin EPS. Volume confirmation is present.
Sector Heatmap
| Sector | Daily Perf | YTD Trend | Institutional Activity | Retail Activity | Momentum Signal |
|---|---|---|---|---|---|
| Banking | ▲ | ▲▲ | USTrong (ZENITHBANK, UBA) | Retail-heavy | EMA/SMA cross bullish |
| Insurance | ▼ | ▲ | Modest (CONHALL, SOVRENINS) | High retail churn | TIP, SOVRENINS: Bearish cross |
| Food Products | ▲ | ▲ | Low | Some retail inflows (MCNICHOLS) | MCNICHOLS: Bullish cross |
| Oil & Gas | ▲ | ▼ | Strong (OANDO, ETERNA) | Retail sluggish | OANDO bullish; ETERNA bearish |
| Telecom | = | ▲ | Ultra-strong (MTNN) | Retail active | MTNN range-bound with massive volume |
Dividend-Beta Matrix: Defensive Picks
| Stock | Dividend Yield | Beta | Implication |
|---|---|---|---|
| AFRIPRUD | 1.27% | 0.64 | Low beta; income-oriented, less risk in downturns. |
| MBENEFIT | 3.28% | 1.27 | Attractive yield, though beta is elevated—riskier for pure defensive play. |
| MANSARD | 4.59% | 0.62 | Top yield and low beta—ideal for conservative buy-and-hold investors. |
| SOVRENINS | 3.75% | 1.12 | Higher yield, higher risk. |
Defensive income seekers should focus on high-yield, low-beta names like AFRIPRUD and MANSARD—especially when market volatility rises.
Institutional Clustering Alerts
- ZENITHBANK: Institutional investors dominated trading with 20.2% of trade value share, supported by bullish PE expansion and RSI above 51 — strong "smart money” inflows.
- MTNN: Massive block trades, stable price—possible fund manager rebalancing.
- CONHALLPLC: Unprecedented volume; suggests underlying accumulation by larger hands, yet price languishing. If news breaks, expect outsized movement.
Dividend Yield in Momentum Names
- MBENEFIT: Present in bullish momentum, offers 3.28% yield but has a beta of 1.27—risk-tolerant income accounts might find this attractive, but volatility may spike.
- MANSARD: Featured in bearish momentum yet shows high yield (4.59%) and low beta. Contrarian yield chase possible if technical bottom forms soon.
Actionable Suggestions & Outlook
- MECURE and MCNICHOLS could see continued momentum but watch for RSI creep towards overbought zone.
- Avoid fresh longs in ETERNA and CAVERTON; both show technical and volume-based distribution.
- OANDO offers a potentially attractive mean-reversion trade, given today’s momentum reversal and bullish technical cross.
- Dividend hunters can start nibbling on MANSARD and AFRIPRUD if market volatility picks up.
- For risk-off investors, avoid stocks with persistent negative YTD and technical red flags, even if dividend yields look tempting (e.g., SOVRENINS).
- MTNN’s high volume with stagnant price—wait for direction confirmation before acting. Watch for news or regulatory events.
Market Activity: Retail vs Institutional Flows & Patterns
- Institutional investors: Drove over 83% of daily volume and 92% of value. ZENITHBANK, UBA, MTNN, and ACCESSCORP dominated block trading—implies strong conviction in core banking/telecom holdings.
- Retail investors: Most active in the same banking names, but their impact was limited (16.9% of volume). Retail-driven surges often precede volatility, so monitor if retail/volume spikes persist with no price breakout.
-
Patterns:
- Overlap: MTNN, ZENITHBANK, UBA, ACCESSCORP appeared on both institutional and retail most traded lists—these are "decision points” for short-term swing trades or investors seeking liquidity.
- Value-weighted institutional clusters: High institutional value in ZENITHBANK and MTNN lines up with low volatility in price, indicating accumulation, not speculative churn.
- Trading Tip: When block volumes coincide with stable prices, as in MTNN and ZENITHBANK today, breakout volatility often follows within a few sessions—be prepared.
15/50 Day Moving Avg Crossovers: Trend Snapshots
| Stock | 15DMA | 50DMA | Trend |
|---|---|---|---|
| MECURE | 21.78 | 18.08 | Bullish __/ |
| OANDO | 47.32 | 51.24 | Crossing up __/ |
| MCNICHOLS | 3.62 | 3.57 | Bullish __/ |
| TIP | 12.11 | 12.75 | Bearish \__ |
| CAVERTON | 6.69 | 6.88 | Bearish \__ |
Hidden Insights
- Attention to Mean Reversion: OANDO’s reversal can spark further short covering, especially if retail flows sustain tomorrow.
- Institutional Clustering in MTNN is not accompanied by price volatility—watch for imminent news or cross-sector ETF rebalancing.
- Momentum-Volume Disconnects: Some gainers (MCNICHOLS, CHAMS) had technical breakouts without matching volume surges, a sign that institutional momentum may not yet be convinced; micro-cap caution is advised.
- Defensive Rotation: Dividend, low-beta portfolios (AFRIPRUD, MANSARD) remain attractive if market breadth narrows.
|
Top ASI Gainers Over Last 5 Trading Days
|
Top ASI Losers Over Last 5 Trading Days
|
For more detailed analysis, on InfoWARE Market Data Terminal <NSEPERF> <GO>
On InfoWARE Finance Mobile App (Android, iPhone & iPad, Windows Phone and Windows 8/10), "Top Gainers & Losers"
LOTUS HALAL EQUITY ETF (LOTUSHAL15) topped the advancers list closing at N83.45 with a gain of 9.99% followed by MECURE INDUSTRIES PLC (MECURE) which closed at N26.10 with a gain of 9.89%.
On the flip side ETERNA PLC. (ETERNA) and SOVEREIGN TRUST INSURANCE PLC (SOVRENINS) topped the decliners log with a loss of -10.00% at a close of N27.90, and -4.84% to close the day at N2.95 respectively.
| Symbol | LClose | %Chg |
|---|---|---|
| LOTUSHAL15 | 83.45 | 9.99 |
| MECURE | 26.10 | 9.89 |
| OANDO | 49.00 | 9.50 |
| MCNICHOLS | 3.64 | 9.31 |
| CHAMS | 3.43 | 9.24 |
For more detailed analysis,
- On InfoWARE Market Data Terminal <TOPG> <GO>
- On InfoWARE Finance Mobile App ( Android, iPhone & iPad and Windows 10) , "Top Gainers & Losers"
Currency Market
In the currency market, the Naira appreciated 0.37%(5.60) against the Dollar to settle at 1 to 1NSE: Bull Signal - Price crossed above 15 Day MA
This signal implies these stocks are under buying pressure and the price might continue to rise and therefore positions should be monitored closely. Further suggested analysis include looking at the overall market (ASI) to see if the uptrend is market wide, sector wide or specific to the stock. Portfolio managers tend to use this as a signal to do more research to add to their positions or lock in some profits. Typically further analysis should be done using commands like PC and RV on the InfoWARE Market Data Terminal. Another command is ALERTS to set price triggers for possible exit or entry as necessary
For more detailed analysis,
- On InfoWARE Market Data Terminal <NSEPERF> <GO>
- On InfoWARE Finance Mobile App ( Android , iPhone & iPad and Windows 10) , "Top Gainers & Losers"
| Symbol | Price | %Chg | 15DMA | PE | EPS | DivY | MktCap | Vol | Trades | Value | LstTradeTime |
|---|---|---|---|---|---|---|---|---|---|---|---|
| FGSUK2027S3 | 88.00 | 14.77 | 79.87 | 0.00 | 0.00 | 5.00K | 1.00 | 4.40M | 25-Sep-2025 14:30:48.670 | ||
| OANDO | 49.00 | 8.67 | 47.32 | 24.10 | 2.53 | 1.15 | 609.14B | 2.62M | 475.00 | 119.01M | 25-Sep-2025 14:30:15.463 |
| MCNICHOLS | 3.64 | 8.52 | 3.62 | 26.80 | 0.05 | 5.88 | 2.62B | 2.11M | 67.00 | 7.23M | 25-Sep-2025 14:30:46.820 |
| NSLTECH | 0.88 | 7.95 | 0.85 | 0.00 | 0.00 | 15.87 | 4.96B | 6.26M | 173.00 | 5.42M | 25-Sep-2025 14:30:43.487 |
| NEIMETH | 6.45 | 6.98 | 6.14 | 125.52 | 0.02 | 3.38 | 27.56B | 2.15M | 125.00 | 13.54M | 25-Sep-2025 14:30:15.337 |
| FGSUK2033S6 | 102.00 | 5.78 | 97.21 | 0.00 | 0.00 | 30.95K | 1.00 | 31.57M | 25-Sep-2025 14:30:48.710 | ||
| MBENEFIT | 3.92 | 4.34 | 3.91 | 5.43 | 0.11 | 3.28 | 78.64B | 4.03M | 130.00 | 15.23M | 25-Sep-2025 14:30:15.147 |
| NGXAFRBVI | 3,515.38 | 1.47 | 3,510.38 | 3.14 | 35.50 | 0.00 | 0.00 | 100.14M | 4,355.00 | 5.48B | 25-Sep-2025 14:30:19.590 |
| VSPBONDETF | 213.00 | 0.94 | 210.41 | 0.00 | 0.00 | 1.13K | 3.00 | 239.64K | 25-Sep-2025 14:30:44.357 | ||
| NGX30 | 5,142.29 | 0.34 | 5,134.70 | 575.61 | 329.08 | 0.00 | 0.00 | 259.43M | 10,677.00 | 15.17B | 25-Sep-2025 14:30:19.580 |
| FG202031S1 | 103.07 | 0.00 | 103.07 | 0.00 | 0.00 | 0.00 | 0.00 | 0.00 | 25-Sep-2025 14:30:18.453 |
NSE: BEAR Signal - Price crossed below 15 Day MA
This signal implies these stocks are under selling pressure and the price might continue to slide and therefore positions should be monitored closely. Further suggested analysis include looking at the overall market (ASI) to see if the downtrend is market wide, sector wide or specific to the stock. If the overal market trend is upwards, then since these stocks are heading in the opposite direction, then further analysis should be done using commands like PC and RV on the InfoWARE Market Data Terminal. Another command is ALERTS to set price triggers for possible exit is necessar
For more detailed analysis,
- On InfoWARE Market Data Terminal <BEARM> <GO>
- On InfoWARE Finance Mobile App ( Android , iPhone & iPad and Windows 10)
| Symbol | Price | %Chg | 15DMA | PE | EPS | DivY | MktCap | Vol | Trades | Value | LstTradeTime |
|---|---|---|---|---|---|---|---|---|---|---|---|
| MANSARD | 16.00 | 0.00 | 16.09 | 31.16 | 0.24 | 4.59 | 144.00B | 723.80K | 87.00 | 10.80M | 25-Sep-2025 14:30:15.120 |
| NB | 70.00 | 0.00 | 70.24 | 16.95 | 1.60 | 3.79 | 719.33B | 581.69K | 183.00 | 41.59M | 25-Sep-2025 14:30:15.270 |
| JAPAULGOLD | 2.67 | -1.12 | 2.70 | 0.19 | 12.01 | 0.90 | 16.72B | 2.63M | 112.00 | 7.09M | 25-Sep-2025 14:30:43.390 |
| TIP | 12.02 | -3.99 | 12.11 | 0.00 | 10.70B | 1.25M | 89.00 | 15.15M | 25-Sep-2025 14:30:46.857 | ||
| SOVRENINS | 2.95 | -5.08 | 2.99 | 27.95 | 0.03 | 3.75 | 33.53B | 15.19M | 152.00 | 45.85M | 25-Sep-2025 14:30:15.760 |
| FGS202772 | 75.00 | -73.33 | 117.13 | 0.00 | 0.00 | 1.00K | 1.00 | 750.00K | 25-Sep-2025 14:30:19.030 |
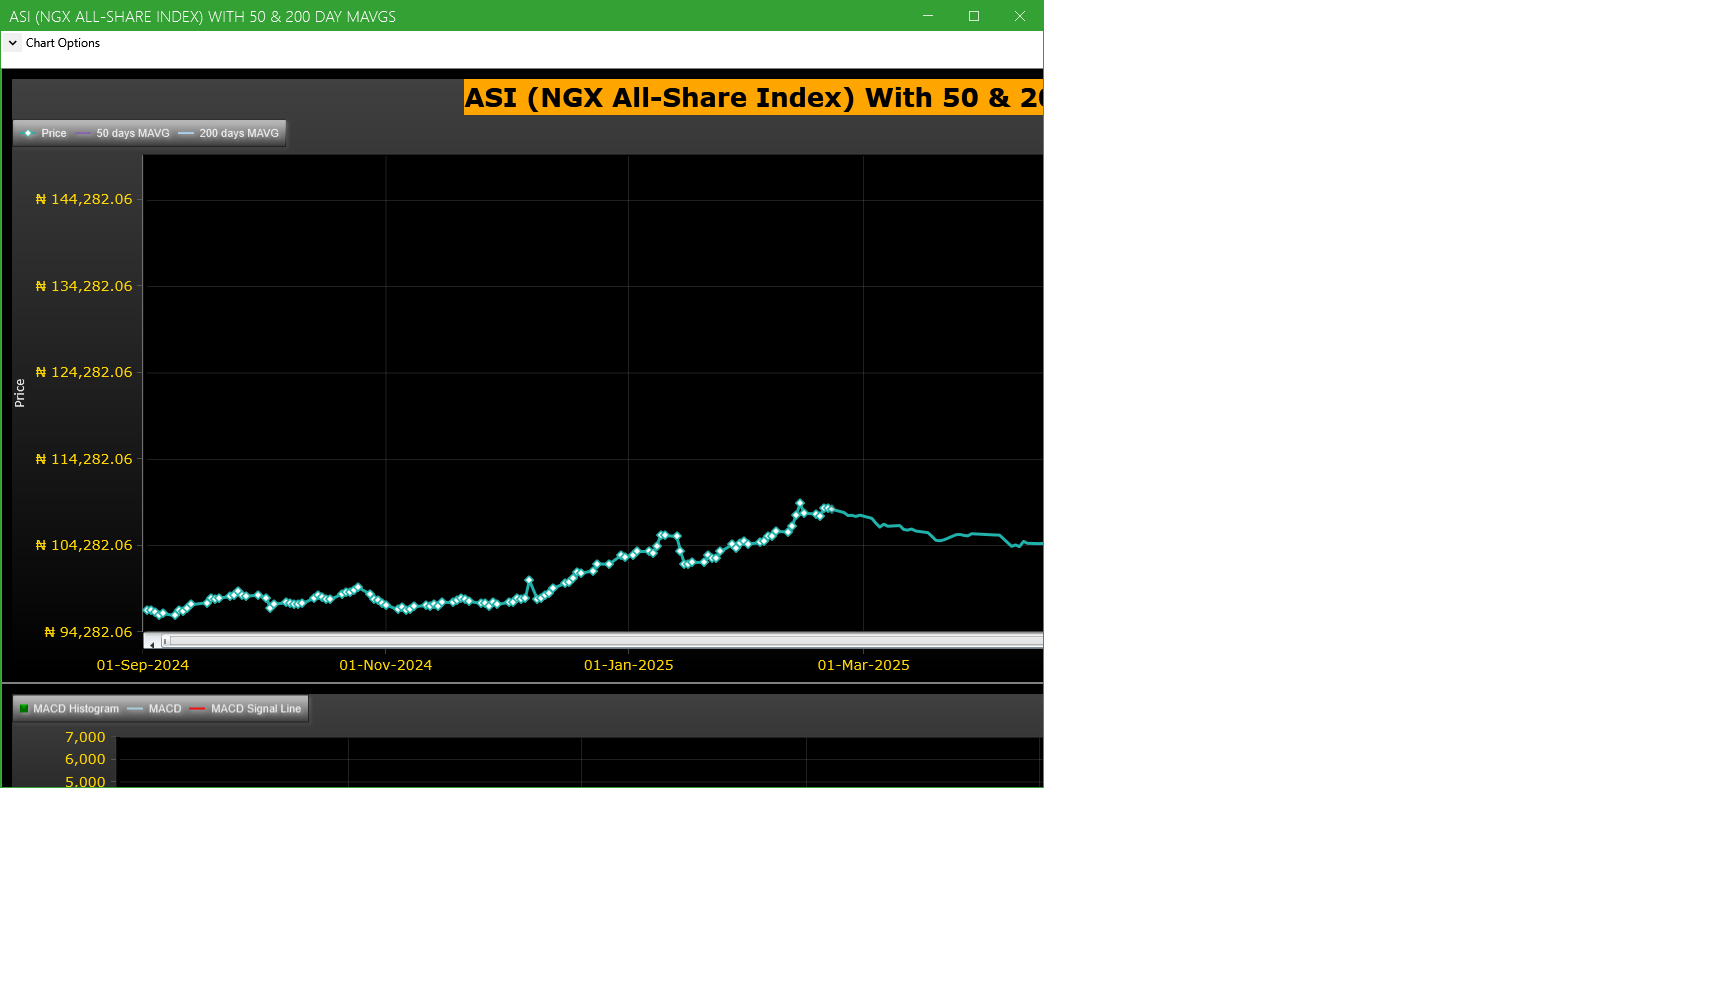
Market Trend - ASI (NGX All-Share-Index) With 50 & 200 Day MAvgs Chart
Technical traders typically use the 50 & 200 day moving averages to aid in choosing
where to enter or exit a position, which then causes these levels to act as strong
support or resistance. As a general guideline, if the price is above a moving average,
the trend is up. If the price is below a moving average, the trend is down.
It is important to note that critics of technical analysis say that moving averages act
as support and resistance because so many traders use these indicators to inform their
trading decisions. Also moving averages tend to work quite well in strong trending conditions
but poorly in choppy or ranging conditions.
Trading Strategies: Crossovers
Crossovers are one of the main moving average strategies. The first type is a price crossover,
which is when the price crosses above or below a moving average to signal a potential change
in trend. Another strategy is to apply two moving averages to a chart: one longer and one
shorter. When the shorter-term MA crosses above the longer-term MA, it is a buy signal, as
it indicates that the trend is shifting up. This is known as a golden cross. Meanwhile, when
the shorter-term MA crosses below the longer-term MA, it is a sell signal, as it indicates that
the trend is shifting down. This is known as a dead/death cross
For more detailed analysis,
- On InfoWARE Market Data Terminal <CI> <GO>
- On InfoWARE Finance Mobile App ( Android , iPhone & iPad and Windows 10) , "Research"
Unusual Volume: Volume traded is more than double the 90 day moving average (All exchanges; ASI & ASem). For more detailed analysis,
- On InfoWARE Market Data Terminal <UV> <GO>
- On InfoWARE Finance Mobile App ( Android , iPhone & iPad and Windows 10)
| Symbol | Name | Volume | 90DAvgVol | %VolChg | Price | LClose | %Chg | Trades | Value |
|---|---|---|---|---|---|---|---|---|---|
| CONHALLPLC | CONSOLIDATED HALLMARK INSURANCE PLC | 333.21M | 15.50M | 2,050.02 | 3.80 | 3.76 | 1.06 | 103 | 1.26B |
| STERLINGNG | STERLING FINANCIAL HOLDINGS COMPANY PLC | 104.91M | 25.10M | 317.93 | 7.30 | 7.45 | -2.01 | 513 | 771.83M |
| MTNN | MTN NIGERIA PLC | 12.08M | 2.03M | 494.09 | 415.00 | 414.10 | 0.22 | 1,106 | 5.01B |
| PRESCO | PRESCO PLC | 1.66M | 270.74K | 513.98 | 1,479.90 | 1,480.00 | -0.01 | 304 | 2.44B |
| ETERNA | ETERNA PLC. | 1.20M | 354.45K | 238.21 | 27.90 | 31.00 | -10.00 | 141 | 35.56M |
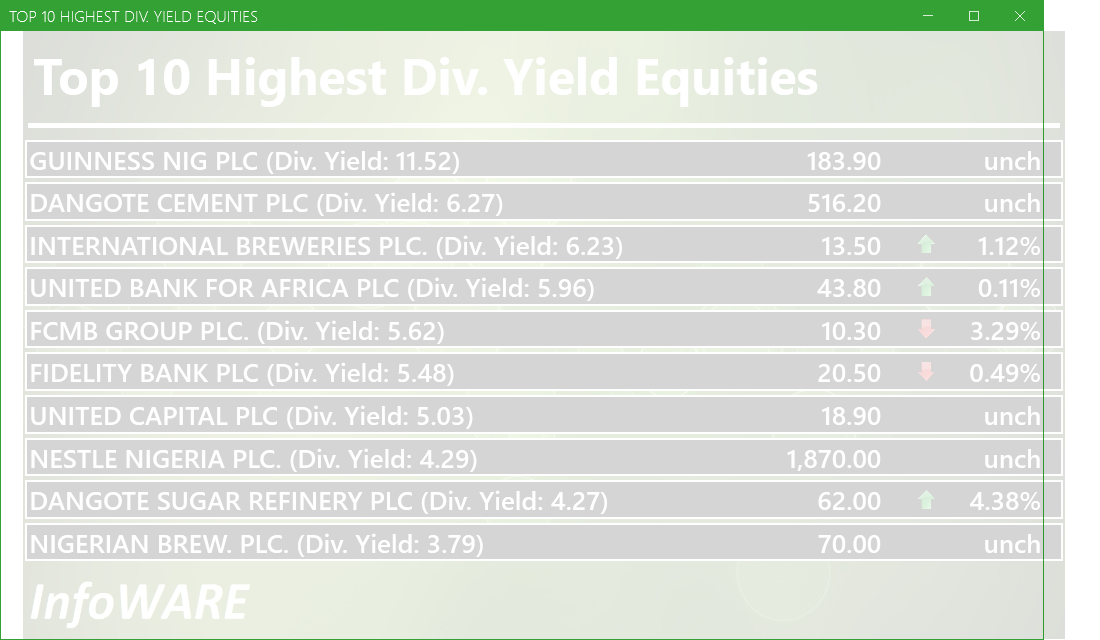
Investment Insights - High Div. Stocks
Dividend stocks distribute a portion of the company earnings to investors on a regular basis and they can a great choice for investors looking for regular income. As an investment or trading strategy, high dividend yield equities provide annual cash payments as against mostly capital gains in the price of a stock. The list in the table below represent the highest dividend paying stocks from the list of the most liquid stocks in the NSE top 30.
For more detailed analysis,
- On InfoWARE Market Data Terminal <HYIELD> <GO>
- On InfoWARE Finance Mobile App ( Android , iPhone & iPad and Windows 10) , "Research"
African Markets
| Name | LClose | Change | %Chg |
|---|---|---|---|
| BRVM Stock Exchange | 324.07 | 0.71 | 0.22 |
| Botswana Stock Exchange | 10,610.53 | 0.00 | 0.00 |
| Egyptian Exchange | 35,949.12 | 621.76 | 1.76 |
| Ghana Stock Exchange | 7,829.09 | 28.08 | 0.36 |
| Lusaka Stock Exchange | 25,067.18 | -17.56 | -0.07 |
| Casablanca Stock Exchange | 19,617.53 | -152.23 | -0.77 |
| Malawi Stock Exchange | 578,429.38 | -57.85 | -0.01 |
| Nigeria Stock Exchange | 140,716.10 | -211.39 | -0.15 |
| Nairobi Securities Exchange | 177.13 | 2.81 | 1.61 |
| Rwanda Stock Exchange | 179.31 | 0.00 | 0.00 |
| Tunis Stock Exchange | 12,411.19 | -8.69 | -0.07 |
| Uganda Securities Exchange | 1,441.47 | 12.15 | 0.85 |
Nigeria Market Indexes
| Symbol | LClose | %Chg | WTD% | MTD% | QTD% | YTD% | MktCap | Trades |
|---|---|---|---|---|---|---|---|---|
| ASI | 141,157.49 | 0.31 | -0.24 | 1.03 | 17.89 | 36.81 | 18,993 | |
| NGX30 | 5,142.29 | 0.34 | -0.26 | 0.89 | 8.86 | 34.80 | 10,677 | |
| NGXAFRBVI | 3,515.38 | 1.49 | 2.04 | 0.86 | -0.79 | 41.70 | 4,355 | |
| NGXAFRHDYI | 22,439.63 | 0.61 | 0.23 | -0.41 | 7.30 | 31.78 | 4,887 | |
| NGXASEM | 1,538.10 | 0.00 | 0.00 | 0.00 | -3.57 | -2.88 | 5 | |
| NGXBNK | 1,506.15 | 1.02 | 1.25 | -0.35 | -0.31 | 38.51 | 5,337 | |
| NGXCG | 4,012.18 | 0.73 | 0.10 | -0.56 | 16.68 | 41.81 | 10,386 | |
| NGXCNSMRGDS | 3,357.68 | 0.31 | 0.76 | 5.27 | -3.20 | 93.60 | 2,370 | |
| NGXCOMMDTY | 1,101.95 | 0.00 | -0.91 | 3.17 | 5.22 | 10.19 | ||
| NGXGROWTH | 14,261.77 | 6.40 | 14.46 | 27.34 | 49.98 | 83.72 | 208 | |
| NGXINDUSTR | 4,911.60 | 0.00 | -0.35 | -0.42 | 39.42 | 37.52 | 1,343 | |
| NGXINS | 1,230.03 | -0.41 | -1.45 | -4.12 | 66.54 | 56.45 | 1,491 | |
| NGXLOTUSISLM | 11,600.96 | 0.09 | -1.68 | 1.59 | 21.16 | 66.49 | 3,426 | |
| NGXMAINBOARD | 6,953.18 | 0.31 | 0.16 | 2.45 | 17.87 | 38.95 | 13,656 | |
| NGXMERIGRW | 9,789.08 | -0.12 | -1.02 | -2.25 | 1.42 | 50.06 | 2,944 | |
| NGXMERIVAL | 13,446.55 | 0.74 | 1.62 | 0.57 | 12.54 | 28.92 | 5,518 | |
| NGXOILGAS | 2,446.31 | 0.74 | -1.13 | 3.19 | 2.26 | -9.77 | 352 | |
| NGXPENBRD | 2,613.86 | 0.23 | -0.49 | 0.91 | 13.68 | 42.71 | 15,522 | |
| NGXPENSION | 6,640.83 | 0.37 | -0.27 | 0.32 | 4.50 | 46.47 | 11,788 | |
| NGXPREMIUM | 13,523.76 | 0.27 | -1.07 | -1.73 | 17.91 | 38.95 | 5,129 | |
| NGXSOVBND | 657.27 | 0.00 | 0.00 | -0.24 | 0.58 | 9.26 | 0 |
For more detailed analysis,
- On InfoWARE Market Data Terminal <MKTINS> <GO>
- On InfoWARE Finance Mobile App ( Android, iPhone & iPad and Windows 10) , "Market Indexes"
Find the topic interesting? Will like to comment? Contact Us at solutions@infowarelimited.com
Top News

InfoWARE AI Analyst Weekly Market Report: 26-Sep-2025
Chart Of The Day - ASI Chart Vs ASI Advance Decline Line (YTD) (26-Sep-2025 15:06:50.109)
InfoWARE AI Analyst Daily Market Report: 26-Sep-2025

[MERGROWTH]>> DAILY INDICATIVE PRICES
[VSPBONDETF]>> DAILY INDICATIVE PRICES
[XNSA]>> NGX FIXED INCOME INDICATIVE PRICE LIST FOR SEP 26, 2025
[XNSA]>> EXECUTIVE CAPACITY DEVELOPMENT COURSE ON NIGERIA CAPITAL MARKET
[XNSA]>> DAILY FUND PRICE SUBMISSION - FCMB ASSET MANAGEMENT LIMITED
[XNSA]>> REGISTRATION FOR BATCH TWO- 2025 DEALING CLERKSHIP CERTIFICATION PROGRA
[SIAMLETF40]>> DAILY INDICATIVE PRICES
[XNSA]>> DAILY INDICATIVE PRICES
[XNSA]>> UPDATED- SAVE THE DATE: 29TH ANNUAL STOCKBROKERS CONFERENCE
[XNSA]>> AELP CAPACITY BUILDING & ASSDA FORUM
Chart Of The Day - ASI Chart Vs ASI Advance Decline Line (YTD) (25-Sep-2025 15:09:51.734)
InfoWARE AI Analyst Daily Market Report: 25-Sep-2025
[XNSA]>> OFF MARKET TRADE
[MERGROWTH]>> DAILY INDICATIVE PRICES
[VSPBONDETF]>> DAILY INDICATIVE PRICES
[XNSA]>> CORDROS MILESTONE FUNDS' BID & OFFER PRICES
[XNSA]>> NGX FIXED INCOME INDICATIVE PRICE LIST FOR SEP 25, 2025
[LOTUSHAL15]>> DAILY INDICATIVE PRICES
[XNSA]>> APPOINTMENT OF DIRECTORS
[XNSA]>> OFF MARKET TRADE
[XNSA]>> REGISTRATION FOR BATCH TWO- 2025 DEALING CLERKSHIP CERTIFICATION PROGRA
[XNSA]>> UPDATED- SAVE THE DATE: 29TH ANNUAL STOCKBROKERS CONFERENCE
[SIAMLETF40]>> DAILY INDICATIVE PRICES
[XNSA]>> AELP CAPACITY BUILDING & ASSDA FORUM
Chart Of The Day - ASI Chart Vs ASI Advance Decline Line (YTD) (24-Sep-2025 15:06:41.102)
InfoWARE AI Analyst Daily Market Report: 24-Sep-2025
[XNSA]>> DAILY FUND PRICE SUBMISSION - FCMB ASSET MANAGEMENT LIMITED
Get IDIA - the stock trading app for the modern investor
Solutions by Business
Product Suites
Company
Contacts
- 8th Floor,
- South Atlantic Petroleum Towers,
- 1 Adeola Odeku Street,
- Victoria Island,
- Lagos, Nigeria.
- Email: solutions@infowarelimited.com
Follow Us
 |
 |
 |
 |