


InfoWARE AI Analyst Daily Market Report: 26-Sep-2025 | InfoWARE Finance
Get IDIA - the stock trading app for the modern investor


InfoWARE AI Analyst Daily Market Report: 26-Sep-2025
(Source: InfoWARE Terminal, Date: 26-Sep-2025)
Dear Investor,
Daily Market Summary – Friday, September 26, 2025
The NGX All Share Index (ASI) rebounded +0.69% today to close at 141,157.49, maintaining its robust +37.75% Year-to-Date performance. Market volume picked up to 479.74M shares (up +13.8% from yesterday), but turnover dipped slightly to ₦16.59B (-1.52%). Market breadth was strong at 1.67x, with 40 advancers outpacing 24 decliners. Standouts included THOMAS WYATT NIG. PLC (THOMASWY), which posted remarkable price and volume surges, and several key banking names showing institutional activity. Caution flags are up, however, on bearish momentum stocks (e.g., DAARCOMM), and turnover is showing some slowing signs despite robust trading interest.
Key Market Trends & Breadth
- Strong Advancer/Decliner Ratio: 40 advancers to 24 decliners (Breadth: 1.67x).
- Widespread Participation: Trading volume rose in 76 stocks but fell in 60, indicating a broad underlying interest.
- Bullish Momentum Confirmed: Several large-caps broke above 15DMA (e.g., NB, WAPCO, FCMB, DANGCEM), signaling sector-wide strength.
- Turnover Watch: Market value traded dipped slightly, suggesting some profit-taking or new caution at elevated levels.
Top Gainers & Losers – Today's Highlights
| Stock | Price (₦) | % Change | RSI | MACD | 15DMA/50DMA |
|---|---|---|---|---|---|
| THOMASWY | 3.30 | +10.00% | 53.5 | -0.06 | 2.69/3.10 |
| EUNISELL | 33.60 | +9.98% | 61.4 | +2.22 | 28.33/24.48 |
| TIP | 13.22 | +9.98% | 50.3 | +0.10 | 12.20/12.81 |
| FTNCOCOA | 5.96 | +9.96% | 46.7 | -0.10 | 5.85/6.23 |
| OMATEK | 1.14 | +8.57% | 44.8 | -0.07 | 1.19/1.31 |
| Stock | Price (₦) | % Change | RSI | MACD | 15DMA/50DMA |
|---|---|---|---|---|---|
| FIDELITYBK | 18.45 | -10.00% | 50.6 | +0.15 | 20.53/20.91 |
| CUSTODIAN | 44.00 | -8.90% | 60.1 | +2.81 | 43.65/39.51 |
| CUTIX | 3.20 | -8.31% | 50.1 | -0.00 | 3.51/3.69 |
| DAARCOMM | 1.06 | -7.02% | 54.9 | +0.04 | 1.08/1.02 |
| UNIONDICON | 9.00 | -5.26% | 47.8 | -0.18 | 9.81/10.24 |
- THOMASWY and EUNISELL not only led today's gainers but also maintain strong YTD and short-term momentum. THOMASWY’s monstrous +10% today (+29.4% over 5D, +94.1% QTD, +73.7% YTD) is also confirmed by a +1917% volume spike over its 90D average and a modestly rising RSI.
- FIDELITYBK plunged -10%, appearing in both today's and YTD loser tables, with a neutral RSI suggesting potential further weakness if selling pressure persists.
Momentum Insights: Bullish vs. Bearish
| Symbol | Price (₦) | % Chg | 15DMA | RSI | MACD | Div. Yield |
|---|---|---|---|---|---|---|
| TIP | 13.22 | +9.08% | 12.20 | 50.3 | +0.10 | 0.00 |
| FTNCOCOA | 5.96 | +9.06% | 5.85 | 46.7 | -0.10 | 0.00 |
| NB | 75.50 | +7.28% | 70.71 | — | — | 1.60 |
| FCMB | 10.90 | +5.50% | 10.71 | — | — | 5.62 |
| WAPCO | 130.00 | +6.08% | 124.48 | — | — | 2.70 |
| SOVRENINS | 3.04 | +2.96% | 3.00 | — | — | 3.75 |
| Symbol | Price (₦) | % Chg | 15DMA | RSI |
|---|---|---|---|---|
| DAARCOMM | 1.06 | -7.55% | 1.08 | 54.9 |
| MBENEFIT | 3.85 | -1.82% | 3.92 | — |
| CWG | 16.55 | -2.11% | 16.82 | — |
- Strong bullish momentum and buy signals in TIP, FTNCOCOA, NB, FCMB, and WAPCO—prices decisively broke above 15DMA, confirmed by positive price action and (in several, e.g. TIP) positive MACD histograms.
- Bearish momentum stocks (DAARCOMM, MBENEFIT, CWG) struggle despite broader market advances, possible short-term downside risk.
- NO stocks marked with RSI > 70 or < 30: No overbought (RSI>70) nor seriously oversold (RSI<30) conditions, suggesting stronger moves may still develop in trending names.
Contrarian Signals (Conflicting Indicators)
- DAARCOMM: Despite an RSI of 54.9 (neutral) and near-zero MACD, DAARCOMM saw a -7.02% decline and is in both today’s loser and bearish momentum tables, but volume remains relatively high. This mixed technical picture could make DAARCOMM interesting to contrarian traders, betting on a bounce if selling exhausts itself.
- CUSTODIAN: Despite an RSI of 60 and strong MACD (+2.81), CUSTODIAN fell -8.90%. This divergence could indicate that severe profit-taking is underway, but if RSI holds and MACD remains positive, a rebound may be swift.
- FIDELITYBK: Neutral RSI (50.6) but rapid price loss, and appears among both top daily and YTD losers. The technical atrophy with no oversold panic suggests further drop is possible unless support emerges.
- THOMASWY: RSI at 53.5 is "room to run” rather than overbought despite massive +1917% volume and price spike—a rare configuration for sustained breakouts.
Sector Heatmaps
| Sector | Leaders | Session Trend | Technical Action | Color |
|---|---|---|---|---|
| Banking | ZENITHBANK, GTCO, UBA, FCMB | Advancing | Strong institutional clustering, bullish crossovers | Green |
| Insurance | SOVRENINS, MBENEFIT, SUNUASSUR | Mixed | SOVRENINS strong; MBENEFIT weak | Yellow |
| Consumer/Agro | FTNCOCOA, OMATEK, HONYFLOUR | Bullish breakouts | Volume and price spikes (especially FTNCOCOA, OMATEK) | Blue |
| Media/Tech | DAARCOMM, CWG | Declining | Bearish below 15DMA, high volume | Red |
| Industrials | DANGCEM, WAPCO | Bullish | Broke above 15DMA | Green |
Dividend-Beta Matrix: Defensive Screens
| Symbol | Dividend Yield (%) | Beta | Technical Outlook | Remarks |
|---|---|---|---|---|
| FCMB | 5.62 | 1.17 | Bullish (above 15DMA) | Offers yield & momentum, but slightly above-average risk |
| GTCO | 1.88 | 1.09 | Bullish crossover | Medium yield, moderate risk, institutional attention |
| NB | 1.60 | 0.79 | Bullish momentum | Stable beta, strong brand, watch upside |
| SOVRENINS | 3.75 | 1.12 | Bullish crossover, low price | Good defensive small-cap |
| WAPCO | 2.70 | 1.17 | Strong momentum | Defensive cement play |
- Avoided very low-beta, high-yield (ultra-defensive) entries today;
- Yields above 5% (e.g., FCMB) with momentum signal attractive risk/reward, especially for value and income investors.
- Yield names in bullish column tend to have higher betas and thus respond more to market moves.
Institutional Clustering Alerts
- ZENITHBANK: 20.17% of institutional trade value; 7.25% of institutional volume (₦2.62B) – a clear favorite for "big money” flows. Sustained institutional bidding usually precedes price rallies.
- GTCO, MTNN: Also on radar for both retail and institutional turnover, reflecting strong (potentially trending) interest from all investor classes.
- STANBIC: Massive unusual volume, suggesting a re-rating or accumulation drive.
Noteworthy High Dividend Gainers/Bearish Alerts
- FCMB (5.62% yield) and SOVRENINS (3.75% yield) are on bullish momentum lists; yield-chasing funds may bid these higher if momentum persists.
- DAARCOMM: No dividend, but presence on both loser and bearish tables: ongoing technical weakness.
Trade & Volume Highlights – Unusual Activity
| Symbol | Volume (M) | % Above Avg | % Chg | Remarks |
|---|---|---|---|---|
| THOMASWY | 24.50 | +1917% | +10.0% | Breakout, technical confirmation + volume surge |
| LIVINGTRUST | 11.39 | +9495% | +7.97% | Small financial, possible block trade or accumulation |
| STANBIC | 38.95 | +1706% | +2.0% | Large-cap, possible institutional buying or M&A |
Trading Desk – Activity & Behavioral Analysis
- Trade Mix: Institutionals accounted for 38.3% of trade count, 71.94% of volume, and whopping 90.59% of turnover—confirming their dominance for today's big directional moves.
- Retail Investors made up 61.71% of trades but only 28.06% of volume (and a mere 9.41% of value)—signaling smaller lots and more tactical trading from individuals.
- Top 5 Institutional Traded Stocks (by value): ZENITHBANK, UBA, ARADEL, MTNN, GTCO. These are mostly large-cap banking/blue-chip names, affirming current institutional confidence in core financials.
- Top 5 Retail Traded Stocks (by count): MTNN, ZENITHBANK, ACCESSCORP, GTCO, UBA. Again, big blue chips dominate, reflecting alignment in retail/institutional focus.
- Insight: The present-day correlation between both institutional and retail activity targeting the same big-cap names (ZENITHBANK, GTCO, MTNN, UBA) indicates improved liquidity and possible sustained trending behavior in these stocks. Watch for follow-through or abrupt reversals—momentum can be self-reinforcing when all classes of buyers are aligned.
Trader Suggestions & Key Takeaways
- Bullish momentum names with rising volume (e.g., TIP, FCMB, NB, WAPCO, THOMASWY) remain attractive—monitor for follow-through but beware of extended intraday runs.
- Contrarian radar: DAARCOMM and CUSTODIAN show technical conflict or potential tradeable reversals. Fresh news can trigger bounce or deeper falls.
- Defensive strategies can consider value/yield names showing upward momentum, such as FCMB and SOVRENINS, to combine income with growth.
- Caution: FIDELITYBK, despite no oversold panic, looks weak across all timeframes; advisable to avoid until technicals or sentiment improve.
- Institutional favorites (ZENITHBANK, GTCO) are likely to guide short-term trend; spikes in both retail and institutional volume may precede further upside.
Additional Insights
- The Dollar/Naira slide (-0.12%, now 1,490) may keep foreign interest in domestic asset classes strong, especially for high-dividend and export-oriented names.
- No stocks with extreme RSI readings—suggesting possible buildup for further up- or down-moves in names that break out of their current technical range.
- Momentum and volume breakouts (THOMASWY, STANBIC, LIVINGTRUST) frequently precede further price gains in the short-term, but require monitoring for exhaustion.
- Strong market breadth (1.67x), overweight institutional activity, and sector-wide bullish crossovers suggest tactical follow-through is probable, but vigilance is warranted as turnover plateaus.
|
Top ASI Gainers Over Last 5 Trading Days
|
Top ASI Losers Over Last 5 Trading Days
|
For more detailed analysis, on InfoWARE Market Data Terminal <NSEPERF> <GO>
On InfoWARE Finance Mobile App (Android, iPhone & iPad, Windows Phone and Windows 8/10), "Top Gainers & Losers"
THOMAS WYATT NIG. PLC. (THOMASWY) topped the advancers list closing at N3.30 with a gain of 10.00% followed by EUNISELL INTERLINKED PLC (EUNISELL) which closed at N33.60 with a gain of 9.98%.
On the flip side FIDELITY BANK PLC (FIDELITYBK) and CUSTODIAN AND ALLIED PLC (CUSTODIAN) topped the decliners log with a loss of -10.00% at a close of N18.45, and -8.90% to close the day at N44.00 respectively.
| Symbol | LClose | %Chg |
|---|---|---|
| THOMASWY | 3.30 | 10.00 |
| EUNISELL | 33.60 | 9.98 |
| TIP | 13.22 | 9.98 |
| LOTUSHAL15 | 91.78 | 9.98 |
| FTNCOCOA | 5.96 | 9.96 |
| Symbol | LClose | %Chg |
|---|---|---|
| FIDELITYBK | 18.45 | -10.00 |
| CUSTODIAN | 44.00 | -8.90 |
| CUTIX | 3.20 | -8.31 |
| DAARCOMM | 1.06 | -7.02 |
| UNIONDICON | 9.00 | -5.26 |
For more detailed analysis,
- On InfoWARE Market Data Terminal <TOPG> <GO>
- On InfoWARE Finance Mobile App ( Android, iPhone & iPad and Windows 10) , "Top Gainers & Losers"
Currency Market
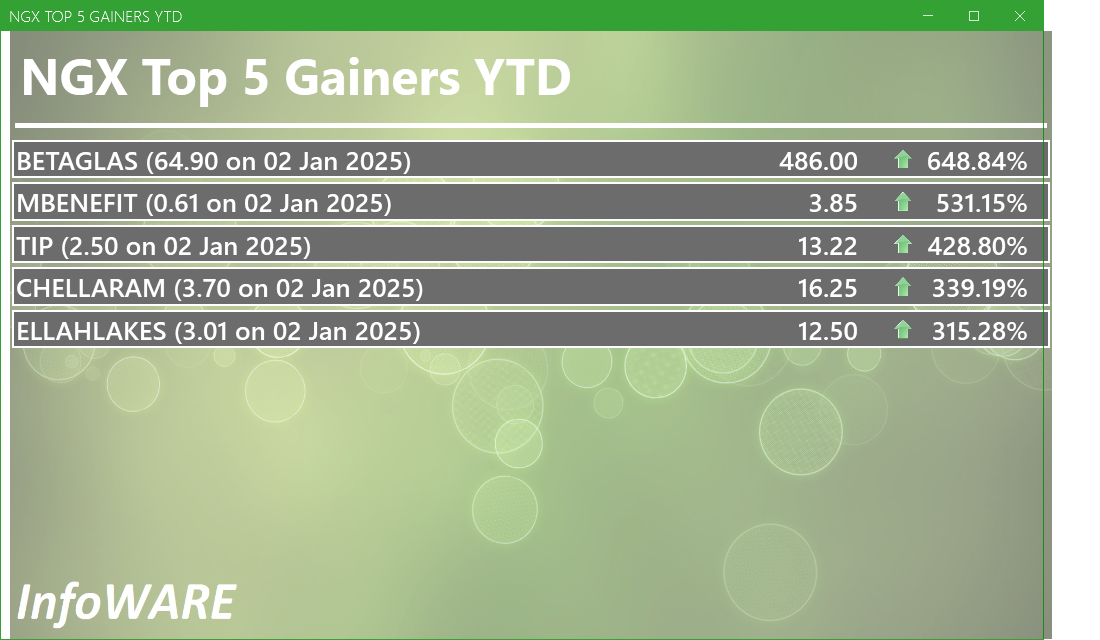
In the currency market, the Naira fell 0.12%(-1.77) against the Dollar to settle at 1 to 1Investment Insights - Top 5 Gainers YTD
These stocks are the best performers whose price has risen faster than the market as a whole with the best returns year to date. Momentum investors believe that stocks that have outperformed the market will often continue to do so because the factors that caused them to outperform will not suddenly disappear. In addition, other investors seeking to benefit from the stock’s outperformance will often purchase the stock, further bidding its price higher and pushing the stock higher still
For more detailed analysis,
- On InfoWARE Market Data Terminal <T5YTD2> <GO>
- On InfoWARE Finance Mobile App ( Android , iPhone & iPad and Windows 10) , "Research"
NSE: Bull Signal - Price crossed above 15 Day MA
This signal implies these stocks are under buying pressure and the price might continue to rise and therefore positions should be monitored closely. Further suggested analysis include looking at the overall market (ASI) to see if the uptrend is market wide, sector wide or specific to the stock. Portfolio managers tend to use this as a signal to do more research to add to their positions or lock in some profits. Typically further analysis should be done using commands like PC and RV on the InfoWARE Market Data Terminal. Another command is ALERTS to set price triggers for possible exit or entry as necessary
For more detailed analysis,
- On InfoWARE Market Data Terminal <NSEPERF> <GO>
- On InfoWARE Finance Mobile App ( Android , iPhone & iPad and Windows 10) , "Top Gainers & Losers"
| Symbol | Price | %Chg | 15DMA | PE | EPS | DivY | MktCap | Vol | Trades | Value | LstTradeTime |
|---|---|---|---|---|---|---|---|---|---|---|---|
| TIP | 13.22 | 9.08 | 12.20 | 0.00 | 11.77B | 2.29M | 133.00 | 29.11M | 26-Sep-2025 14:31:09.403 | ||
| FTNCOCOA | 5.96 | 9.06 | 5.85 | 0.00 | 0.00 | 1.60 | 23.24B | 965.97K | 159.00 | 5.59M | 26-Sep-2025 14:30:22.510 |
| FGSUK2032S5 | 100.00 | 8.45 | 94.04 | 0.00 | 0.00 | 2.00K | 3.00 | 1.98M | 26-Sep-2025 14:31:15.127 | ||
| NB | 75.50 | 7.28 | 70.71 | 16.95 | 1.60 | 3.79 | 775.85B | 2.49M | 225.00 | 185.46M | 26-Sep-2025 14:30:24.133 |
| SUNUASSUR | 5.79 | 7.25 | 5.65 | 0.00 | 0.00 | 0.99 | 33.64B | 910.80K | 57.00 | 5.13M | 26-Sep-2025 14:31:04.233 |
| WAPCO | 130.00 | 6.08 | 124.48 | 24.60 | 2.87 | 2.70 | 2,094.01B | 7.84M | 242.00 | 983.62M | 26-Sep-2025 14:31:04.853 |
| FCMB | 10.90 | 5.50 | 10.71 | 104.31 | 0.09 | 5.62 | 215.85B | 32.31M | 328.00 | 347.82M | 26-Sep-2025 14:30:22.330 |
| HONYFLOUR | 22.00 | 4.77 | 21.88 | 16.28 | 0.31 | 1.40 | 174.46B | 960.82K | 264.00 | 20.56M | 26-Sep-2025 14:30:22.687 |
| STERLINGNG | 7.55 | 3.31 | 7.48 | 15.75 | 0.30 | 3.19 | 217.37B | 5.22M | 672.00 | 39.02M | 26-Sep-2025 14:30:25.947 |
| SOVRENINS | 3.04 | 2.96 | 3.00 | 27.95 | 0.03 | 3.75 | 34.55B | 27.26M | 245.00 | 84.11M | 26-Sep-2025 14:31:04.203 |
| VETGRIF30 | 51.50 | 2.91 | 50.17 | 0.00 | 0.00 | 325.00 | 5.00 | 16.26K | 26-Sep-2025 14:31:04.620 | ||
| DANGCEM | 525.10 | 1.69 | 517.90 | 761.31 | 0.63 | 6.27 | 8,947.97B | 928.47K | 518.00 | 487.55M | 26-Sep-2025 14:31:04.693 |
| NGXINDUSTR | 4,994.70 | 1.66 | 4,932.44 | 39.90 | 18.97 | 0.00 | 0.00 | 15.36M | 1,724.00 | 1.58B | 26-Sep-2025 14:30:40.500 |
| NGXPREMIUM | 13,732.84 | 1.52 | 13,724.86 | 2,048.74 | 238.70 | 0.00 | 0.00 | 90.56M | 5,079.00 | 7.51B | 26-Sep-2025 14:30:40.920 |
| NGXLOTUSISLM | 11,731.06 | 1.11 | 11,643.46 | 1,270.93 | 62.77 | 0.00 | 0.00 | 18.73M | 3,702.00 | 4.20B | 26-Sep-2025 14:30:40.597 |
| NGXMERIVAL | 13,594.96 | 1.09 | 13,483.34 | 12.13 | 38.38 | 0.00 | 0.00 | 132.66M | 5,498.00 | 5.81B | 26-Sep-2025 14:30:40.727 |
| NGXPENBRD | 2,632.48 | 0.71 | 2,618.17 | 348.78 | 389.18 | 0.00 | 0.00 | 305.41M | 17,170.00 | 15.74B | 26-Sep-2025 14:31:09.073 |
| NGXPENSION | 6,677.28 | 0.55 | 6,662.59 | 429.80 | 359.59 | 0.00 | 0.00 | 208.86M | 12,834.00 | 14.95B | 26-Sep-2025 14:30:40.843 |
| GTCO | 93.00 | 0.22 | 92.95 | 7.49 | 7.10 | 1.88 | 2,737.10B | 7.96M | 992.00 | 745.32M | 26-Sep-2025 14:30:22.600 |
| NGXBNK | 1,509.04 | 0.19 | 1,507.46 | 6.10 | 34.65 | 0.00 | 0.00 | 110.80M | 5,460.00 | 4.58B | 26-Sep-2025 14:30:40.210 |
NSE: BEAR Signal - Price crossed below 15 Day MA
This signal implies these stocks are under selling pressure and the price might continue to slide and therefore positions should be monitored closely. Further suggested analysis include looking at the overall market (ASI) to see if the downtrend is market wide, sector wide or specific to the stock. If the overal market trend is upwards, then since these stocks are heading in the opposite direction, then further analysis should be done using commands like PC and RV on the InfoWARE Market Data Terminal. Another command is ALERTS to set price triggers for possible exit is necessar
For more detailed analysis,
- On InfoWARE Market Data Terminal <BEARM> <GO>
- On InfoWARE Finance Mobile App ( Android , iPhone & iPad and Windows 10)
| Symbol | Price | %Chg | 15DMA | PE | EPS | DivY | MktCap | Vol | Trades | Value | LstTradeTime |
|---|---|---|---|---|---|---|---|---|---|---|---|
| FGS202783 | 80.00 | 0.00 | 81.84 | 0.00 | 0.00 | 0.00 | 0.00 | 0.00 | 26-Sep-2025 14:30:39.537 | ||
| NASCON | 97.00 | 0.00 | 97.12 | 24.28 | 1.33 | 3.09 | 257.00B | 978.59K | 95.00 | 94.77M | 26-Sep-2025 14:30:24.097 |
| MBENEFIT | 3.85 | -1.82 | 3.92 | 5.43 | 0.11 | 3.28 | 77.24B | 5.08M | 123.00 | 19.22M | 26-Sep-2025 14:30:23.670 |
| CWG | 16.55 | -2.11 | 16.82 | 0.00 | 0.00 | 2.46 | 41.79B | 9.28M | 238.00 | 145.49M | 26-Sep-2025 14:31:04.130 |
| DAARCOMM | 1.06 | -7.55 | 1.08 | 0.00 | 0.00 | 0.00 | 12.72B | 2.58M | 72.00 | 2.94M | 26-Sep-2025 14:30:21.553 |
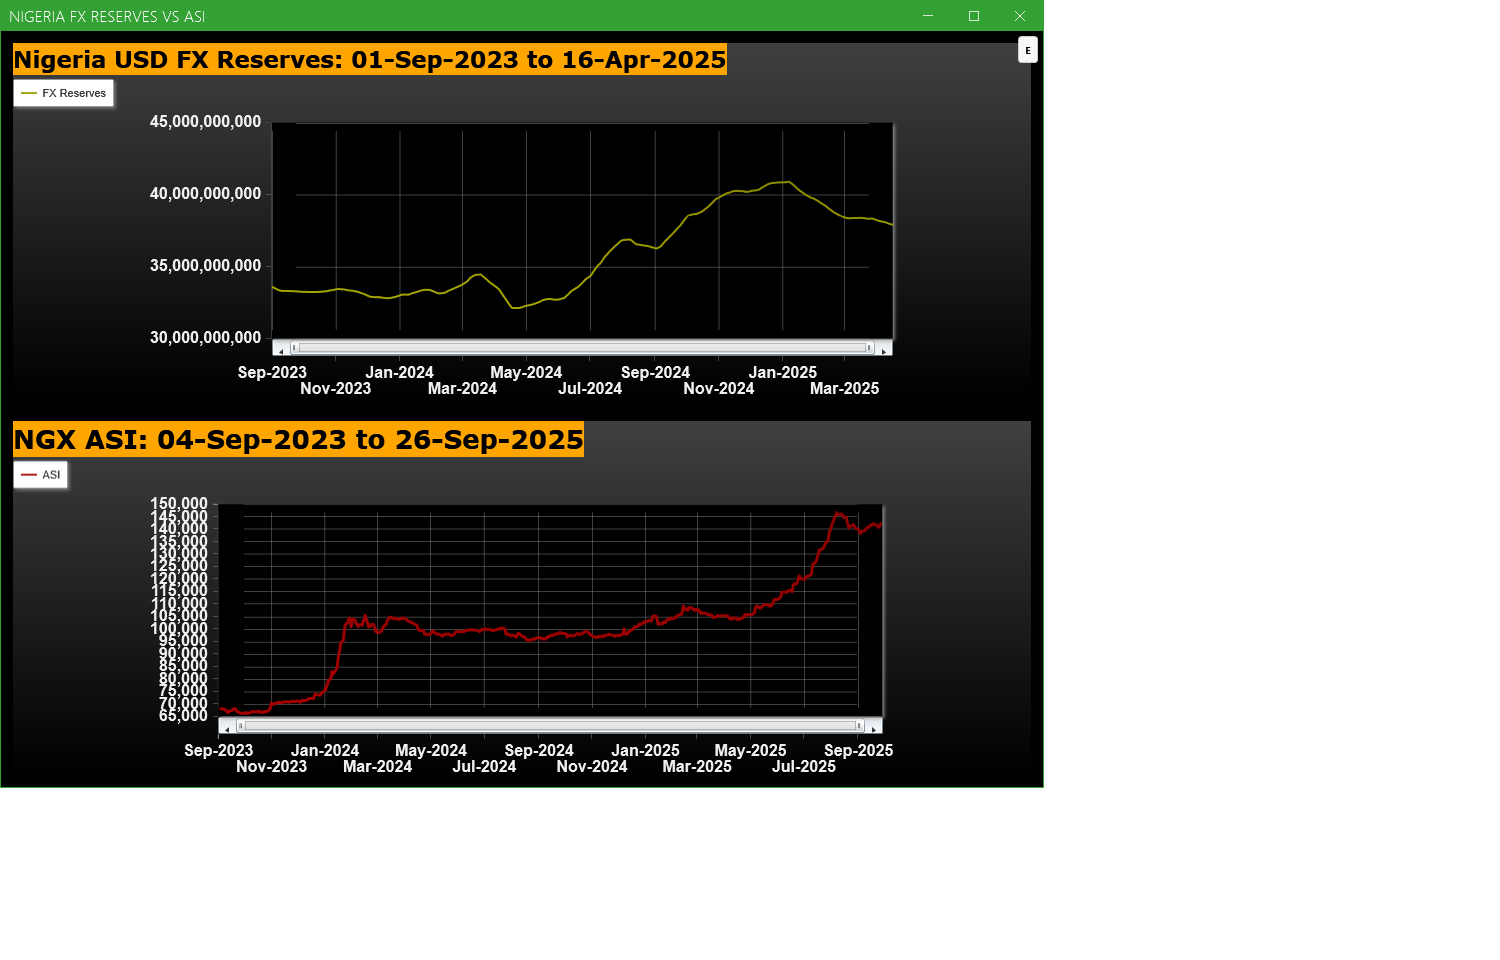
Economic Indicators - Nigeria FX Reserves Vs ASI Chart
Nigeria FX Reserves are assets held on reserve by CBN in foreign currencies. These reserves are used to back liabilities and influence monetary policy. Given the nature of the Nigeria economy, FX Reserves can appear to have an outsize influence on the economy and hence on the capital market. The chart below allows comparison of FX Reserves against the ASI to make investment decisions
For more detailed analysis,
- On InfoWARE Market Data Terminal <CI> <GO>
- On InfoWARE Finance Mobile App ( Android , iPhone & iPad and Windows 10) , "Research"
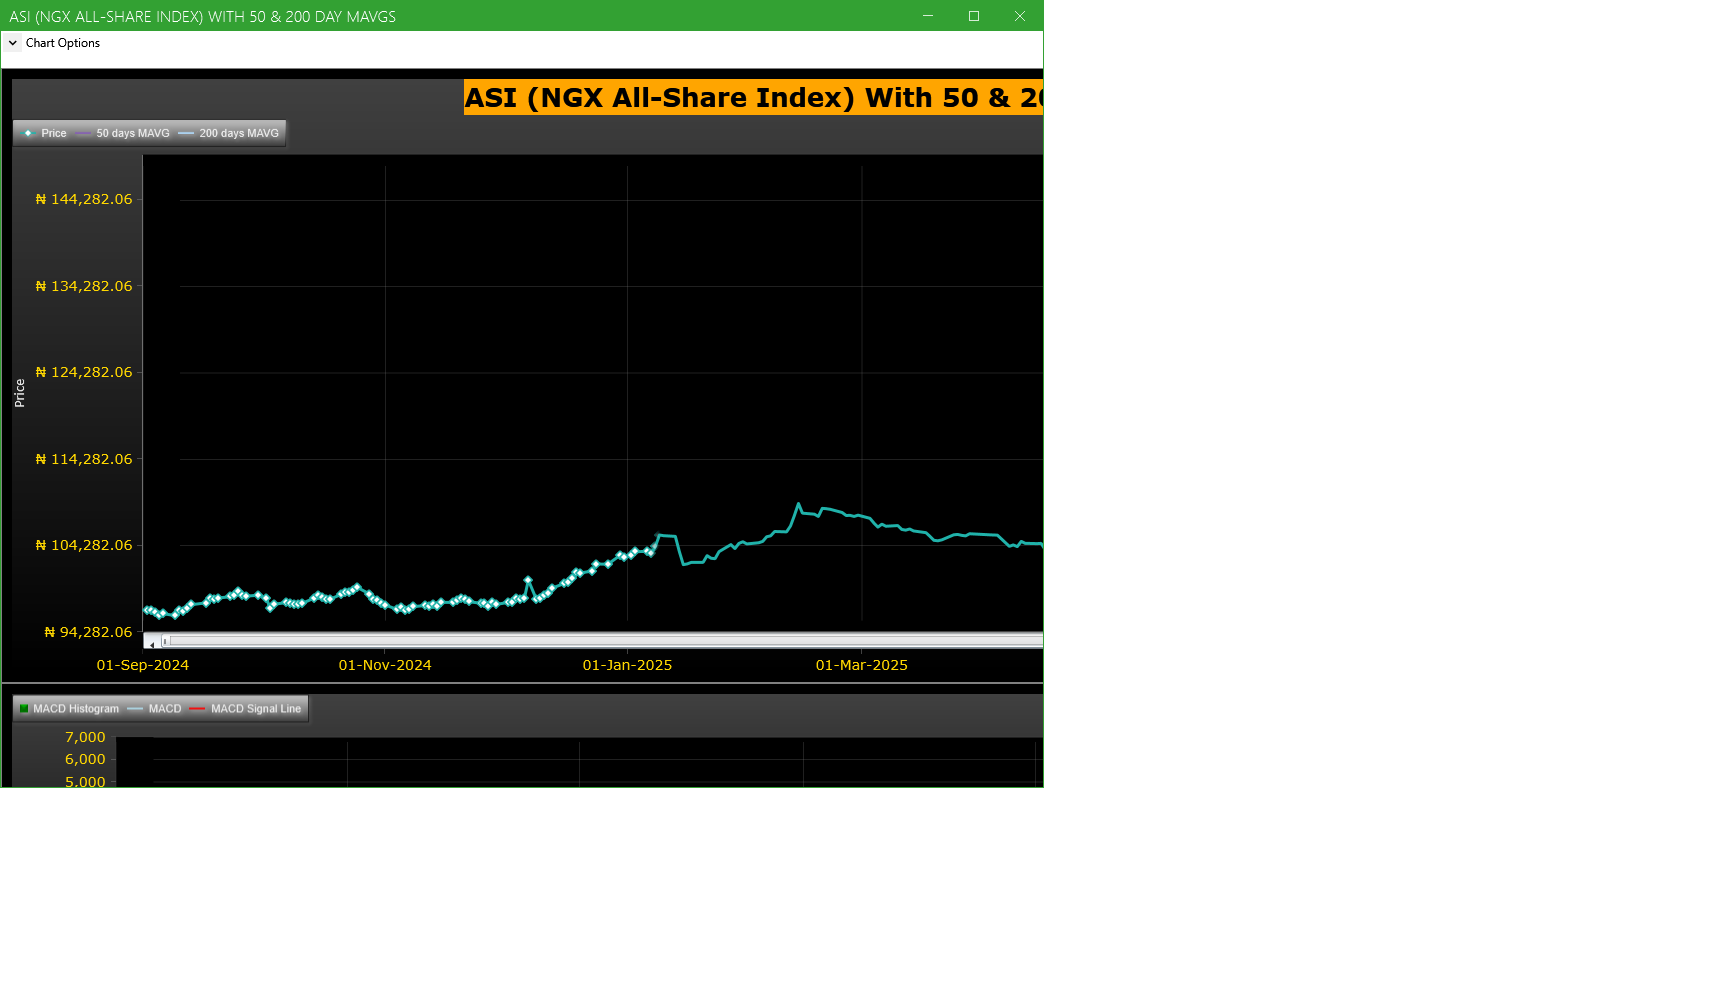
Market Trend - ASI (NGX All-Share-Index) With 50 & 200 Day MAvgs Chart
Technical traders typically use the 50 & 200 day moving averages to aid in choosing
where to enter or exit a position, which then causes these levels to act as strong
support or resistance. As a general guideline, if the price is above a moving average,
the trend is up. If the price is below a moving average, the trend is down.
It is important to note that critics of technical analysis say that moving averages act
as support and resistance because so many traders use these indicators to inform their
trading decisions. Also moving averages tend to work quite well in strong trending conditions
but poorly in choppy or ranging conditions.
Trading Strategies: Crossovers
Crossovers are one of the main moving average strategies. The first type is a price crossover,
which is when the price crosses above or below a moving average to signal a potential change
in trend. Another strategy is to apply two moving averages to a chart: one longer and one
shorter. When the shorter-term MA crosses above the longer-term MA, it is a buy signal, as
it indicates that the trend is shifting up. This is known as a golden cross. Meanwhile, when
the shorter-term MA crosses below the longer-term MA, it is a sell signal, as it indicates that
the trend is shifting down. This is known as a dead/death cross
For more detailed analysis,
- On InfoWARE Market Data Terminal <CI> <GO>
- On InfoWARE Finance Mobile App ( Android , iPhone & iPad and Windows 10) , "Research"
Unusual Volume: Volume traded is more than double the 90 day moving average (All exchanges; ASI & ASem). For more detailed analysis,
- On InfoWARE Market Data Terminal <UV> <GO>
- On InfoWARE Finance Mobile App ( Android , iPhone & iPad and Windows 10)
| Symbol | Name | Volume | 90DAvgVol | %VolChg | Price | LClose | %Chg | Trades | Value |
|---|---|---|---|---|---|---|---|---|---|
| ABBEYBDS | ABBEY BUILDING SOCIETY PLC | 50.03M | 6.73M | 643.05 | 6.80 | 6.80 | 0.00 | 32 | 340.19M |
| STANBIC | STANBIC IBTC HOLDINGS PLC | 38.95M | 2.16M | 1,706.24 | 107.10 | 105.00 | 2.00 | 379 | 4.17B |
| THOMASWY | THOMAS WYATT NIG. PLC. | 24.50M | 1.21M | 1,916.98 | 3.30 | 3.00 | 10.00 | 73 | 75.34M |
| LIVINGTRUST | LIVINGTRUST MORTGAGE BANK PLC | 11.39M | 118.73K | 9,494.93 | 5.15 | 4.77 | 7.97 | 48 | 49.65M |
| CWG | COMPUTER WAREHOUSE GROUP PLC | 9.28M | 3.62M | 156.01 | 16.55 | 16.90 | -2.07 | 238 | 145.49M |
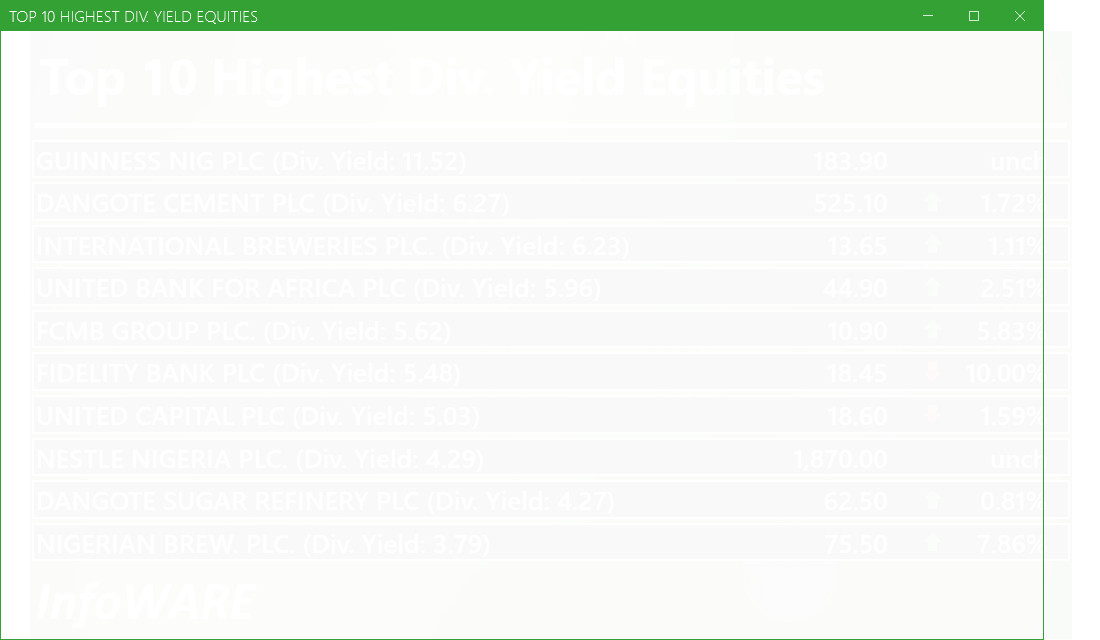
Investment Insights - High Div. Stocks
Dividend stocks distribute a portion of the company earnings to investors on a regular basis and they can a great choice for investors looking for regular income. As an investment or trading strategy, high dividend yield equities provide annual cash payments as against mostly capital gains in the price of a stock. The list in the table below represent the highest dividend paying stocks from the list of the most liquid stocks in the NSE top 30.
For more detailed analysis,
- On InfoWARE Market Data Terminal <HYIELD> <GO>
- On InfoWARE Finance Mobile App ( Android , iPhone & iPad and Windows 10) , "Research"
Investment Insights - Stocks outperforming the ASI but with approximately the same risk
These list of stocks represent equities that are less risky than the ASI but doing better than the ASI (All Shares Index) using the YTD (Year to Date) returns as the measure. The risk is measured by Beta. Beta is an assessment of a stock's tendency to undergo price changes, (its volatility), as well as its potential returns compared to the ASI. It is expressed as a ratio, where a score of 1 represents performance comparable to the ASI, and returns above or below the market may receive scores greater or lower than 1.
For a full list of both positively and negatively corelated stocks visit InfoWARE Market Data Terminal
- On InfoWARE Market Data Terminal <BANL> <GO>
- On InfoWARE Finance Mobile App ( Android , iPhone & iPad and Windows 10)
| Symbol | DivYield | PE | EPS | Beta | %ChgYTD | ASIYTDReturn | BetaDiff |
|---|---|---|---|---|---|---|---|
| HONYFLOUR | 1.40 | 16.28 | 0.31 | 0.99 | 217.92 | 37.75 | 0.01 |
| CAVERTON | 5.52 | 1.15 | 1.57 | 0.98 | 145.10 | 37.75 | 0.02 |
| ROYALEX | 7.81 | 0.00 | 0.00 | 0.96 | 104.55 | 37.75 | 0.04 |
| CORNERST | 5.28 | 8.62 | 0.35 | 0.93 | 59.85 | 37.75 | 0.07 |
| DEAPCAP | 13.76 | 188.84 | 0.01 | 0.89 | 43.33 | 37.75 | 0.11 |
| UNIVINSURE | 0.00 | 0.00 | 0.00 | 0.83 | 63.89 | 37.75 | 0.17 |
| FTNCOCOA | 1.60 | 0.00 | 0.00 | 0.79 | 217.02 | 37.75 | 0.21 |
| NB | 3.79 | 16.95 | 1.60 | 0.79 | 135.94 | 37.75 | 0.21 |
| MAYBAKER | 3.75 | 58.94 | 0.14 | 0.78 | 72.34 | 37.75 | 0.22 |
| UNILEVER | 2.81 | 67.09 | 0.40 | 0.75 | 102.78 | 37.75 | 0.25 |
African Markets
| Name | LClose | Change | %Chg |
|---|---|---|---|
| BRVM Stock Exchange | 325.18 | 1.10 | 0.34 |
| Botswana Stock Exchange | 10,610.53 | 0.00 | 0.00 |
| Egyptian Exchange | 35,671.43 | -276.80 | -0.77 |
| Ghana Stock Exchange | 8,046.69 | 217.65 | 2.78 |
| Johannesburg Stock Exchange | 105,803.18 | -885.52 | -0.83 |
| Lusaka Stock Exchange | 25,086.36 | 20.05 | 0.08 |
| Casablanca Stock Exchange | 19,430.04 | -188.34 | -0.96 |
| Malawi Stock Exchange | 578,328.56 | -115.69 | -0.02 |
| Nigeria Stock Exchange | 141,157.49 | 436.24 | 0.31 |
| Nairobi Securities Exchange | 177.80 | 0.67 | 0.38 |
| Namibian Stock Exchange | 1,904.66 | 6.26 | 0.33 |
| Rwanda Stock Exchange | 179.31 | 0.00 | 0.00 |
| Tunis Stock Exchange | 12,411.34 | 0.00 | 0.00 |
Nigeria Market Indexes
| Symbol | LClose | %Chg | WTD% | MTD% | QTD% | YTD% | MktCap | Trades |
|---|---|---|---|---|---|---|---|---|
| ASI | 142,133.00 | 0.69 | 0.45 | 1.73 | 18.70 | 37.75 | 20,758 | |
| NGX30 | 5,179.72 | 0.73 | 0.46 | 1.63 | 9.65 | 35.78 | 11,455 | |
| NGXAFRBVI | 3,552.60 | 1.06 | 3.12 | 1.93 | 0.26 | 43.20 | 4,485 | |
| NGXAFRHDYI | 22,596.00 | 0.70 | 0.93 | 0.29 | 8.04 | 32.70 | 5,162 | |
| NGXASEM | 1,538.10 | 0.00 | 0.00 | 0.00 | -3.57 | -2.88 | 7 | |
| NGXBNK | 1,509.04 | 0.19 | 1.45 | -0.16 | -0.12 | 38.77 | 5,460 | |
| NGXCG | 4,032.71 | 0.51 | 0.62 | -0.05 | 17.27 | 42.54 | 11,076 | |
| NGXCNSMRGDS | 3,396.93 | 1.17 | 1.94 | 6.50 | -2.07 | 95.86 | 2,694 | |
| NGXCOMMDTY | 1,101.95 | 0.00 | -0.91 | 3.17 | 5.22 | 10.19 | ||
| NGXGROWTH | 14,535.17 | 1.92 | 16.65 | 29.78 | 52.85 | 87.24 | 296 | |
| NGXINDUSTR | 4,994.70 | 1.69 | 1.34 | 1.26 | 41.78 | 39.84 | 1,724 | |
| NGXINS | 1,237.75 | 0.63 | -0.83 | -3.52 | 67.58 | 57.44 | 1,546 | |
| NGXLOTUSISLM | 11,731.06 | 1.12 | -0.58 | 2.73 | 22.52 | 68.36 | 3,702 | |
| NGXMAINBOARD | 6,971.69 | 0.27 | 0.42 | 2.72 | 18.19 | 39.32 | 15,383 | |
| NGXMERIGRW | 9,879.72 | 0.93 | -0.10 | -1.35 | 2.36 | 51.45 | 3,422 | |
| NGXMERIVAL | 13,594.96 | 1.10 | 2.74 | 1.68 | 13.79 | 30.34 | 5,498 | |
| NGXOILGAS | 2,446.31 | 0.00 | -1.13 | 3.19 | 2.26 | -9.77 | 266 | |
| NGXPENBRD | 2,632.48 | 0.71 | 0.22 | 1.63 | 14.49 | 43.72 | 17,170 | |
| NGXPENSION | 6,677.28 | 0.55 | 0.27 | 0.87 | 5.08 | 47.27 | 12,834 | |
| NGXPREMIUM | 13,732.84 | 1.55 | 0.46 | -0.21 | 19.73 | 41.10 | 5,079 | |
| NGXSOVBND | 657.27 | 0.00 | 0.00 | -0.24 | 0.58 | 9.26 | 0 |
For more detailed analysis,
- On InfoWARE Market Data Terminal <MKTINS> <GO>
- On InfoWARE Finance Mobile App ( Android, iPhone & iPad and Windows 10) , "Market Indexes"
Find the topic interesting? Will like to comment? Contact Us at solutions@infowarelimited.com
Top News

InfoWARE AI Analyst Weekly Market Report: 26-Sep-2025
Chart Of The Day - ASI Chart Vs ASI Advance Decline Line (YTD) (26-Sep-2025 15:06:50.109)
InfoWARE AI Analyst Daily Market Report: 26-Sep-2025

[MERGROWTH]>> DAILY INDICATIVE PRICES
[VSPBONDETF]>> DAILY INDICATIVE PRICES
[XNSA]>> NGX FIXED INCOME INDICATIVE PRICE LIST FOR SEP 26, 2025
[XNSA]>> EXECUTIVE CAPACITY DEVELOPMENT COURSE ON NIGERIA CAPITAL MARKET
[XNSA]>> DAILY FUND PRICE SUBMISSION - FCMB ASSET MANAGEMENT LIMITED
[XNSA]>> REGISTRATION FOR BATCH TWO- 2025 DEALING CLERKSHIP CERTIFICATION PROGRA
[SIAMLETF40]>> DAILY INDICATIVE PRICES
[XNSA]>> DAILY INDICATIVE PRICES
[XNSA]>> UPDATED- SAVE THE DATE: 29TH ANNUAL STOCKBROKERS CONFERENCE
[XNSA]>> AELP CAPACITY BUILDING & ASSDA FORUM
Chart Of The Day - ASI Chart Vs ASI Advance Decline Line (YTD) (25-Sep-2025 15:09:51.734)
InfoWARE AI Analyst Daily Market Report: 25-Sep-2025
[XNSA]>> OFF MARKET TRADE
[MERGROWTH]>> DAILY INDICATIVE PRICES
[VSPBONDETF]>> DAILY INDICATIVE PRICES
[XNSA]>> CORDROS MILESTONE FUNDS' BID & OFFER PRICES
[XNSA]>> NGX FIXED INCOME INDICATIVE PRICE LIST FOR SEP 25, 2025
[LOTUSHAL15]>> DAILY INDICATIVE PRICES
[XNSA]>> APPOINTMENT OF DIRECTORS
[XNSA]>> OFF MARKET TRADE
[XNSA]>> REGISTRATION FOR BATCH TWO- 2025 DEALING CLERKSHIP CERTIFICATION PROGRA
[XNSA]>> UPDATED- SAVE THE DATE: 29TH ANNUAL STOCKBROKERS CONFERENCE
[SIAMLETF40]>> DAILY INDICATIVE PRICES
[XNSA]>> AELP CAPACITY BUILDING & ASSDA FORUM
Chart Of The Day - ASI Chart Vs ASI Advance Decline Line (YTD) (24-Sep-2025 15:06:41.102)
InfoWARE AI Analyst Daily Market Report: 24-Sep-2025
[XNSA]>> DAILY FUND PRICE SUBMISSION - FCMB ASSET MANAGEMENT LIMITED
Get IDIA - the stock trading app for the modern investor
Solutions by Business
Product Suites
Company
Contacts
- 8th Floor,
- South Atlantic Petroleum Towers,
- 1 Adeola Odeku Street,
- Victoria Island,
- Lagos, Nigeria.
- Email: solutions@infowarelimited.com
Follow Us
 |
 |
 |
 |