


InfoWARE AI Analyst Daily Market Report: 24-Sep-2025 | InfoWARE Finance
Get IDIA - the stock trading app for the modern investor


InfoWARE AI Analyst Daily Market Report: 24-Sep-2025
(Source: InfoWARE Terminal, Date: 24-Sep-2025)
Dear Investor,
NGX Daily Market Summary – Wednesday, September 24, 2025
Nigerian equities closed slightly lower today, with the NGX All Share Index declining by -0.15% to settle at 140,929.60. Despite a robust Year-To-Date (YTD) gain of +36.38%, market sentiment cooled, as both turnover (-40.92%) and volume (-49.75% vs. previous day) fell sharply. Breadth remained soft (0.84x), with more decliners (31) than advancers (26). DANGOTE SUGAR led today's rally among a handful of strong performers, but risk-off attitudes dominated, especially in mid-cap ETFs and insurance tickers. Currency markets were mildly supportive, with the naira appreciating 0.23% against the dollar. Below, we dissect today’s market action, sector breakdowns, and offer subtle insights beneath the surface.
Significant Market Trends
- Market Breadth: Only 26 stocks advanced vs. 31 declining, resulting in a breadth ratio of 0.84x. Decliners outpaced gainers, confirming broad-based profit-taking.
-
Top Gainers:
- DANGSUGAR (+10.00%): Rose on bullish technicals (MACD & 15DMA crossover); RSI at 47 signals healthy, non-overbought momentum.
- MECURE (+9.95%): Surged as RSI climbed to 56.45, MACD slightly advancing – still in a sweet technical spot, also features in YTD and 5D top gainers.
- CORNERST (+8.00%): Strong move supported by moderate momentum, 5D and YTD momentum on its side, but with low earnings base (EPS: 0.3515).
- NSLTECH (+8.00%): Appearing in both daily and 5D/YTD gainers, it reflects robust speculative interest rather than fundamentals.
- STANBIC (+3.93%): Technicals robust (MACD bullish, crossover above 15DMA/50DMA, RSI at 51.2).
-
Top Losers:
- LOTUSHAL15 (-9.99%, not in detailed table): ETF volatility continues as investors shift out of Sharia-compliant names post-rebalancing.
- DEAPCAP (-9.42%): Bearish momentum, shares also notable in YTD loser list, RSI below 56.
- LEGENDINT (-9.26%): Under continued pressure, also featured in top YTD losers and bearish momentum table, MACD worsening.
- WAPIC (-8.75%): Insurance weak broadly; RSI neutral but MACD still negative.
- RTBRISCOE & VETINDETF (-8.16%): Corporate-specific and ETF-driven pressure persists.
Momentum Breakdown & Technical Patterns
-
Bullish Momentum, 15DMA Crossovers (select):
- DANGSUGAR and STANBIC both crossed above their 15DMA, with supportive MACD action and strong institutional flows.
-
Bearish Momentum, 15DMA Breakdowns:
- CUTIX, NAHCO, AIICO, LEGENDINT, DEAPCAP, VETINDETF feature with negative price moves, sustained low RSI readings (none below 30 yet—no deep oversold signals), and MACD trending lower.
- LEGENDINT and DEAPCAP: Both appear in top daily/YTD losers and on bearish momentum table—clear "avoid” signals unless a reversal presents.
-
Unusual Volume Standouts:
- ZENITHBANK (Institutional: 15.18M% volume vs average): Institutional trades dominated total volume (155% above 90D avg), with technical trends supportive (+1.33% today; MACD strong, RSI balanced at 51.89).
- FIRSTHOLDCO, MTNN, CHELLARAM also had volumes >2x average—note MTNN fell -4.80%, implying distribution on market weakness.
-
YTD Top Gainers:
Symbol Price %Chg1Dy %Chg5Dys %ChgYTD RSI Div Yield CHELLARAM 16.00 1.56 11.30 339.19 68.06 1.99 MECURE 21.60 9.95 9.95 84.82 56.45 0.00 ROYALEX 2.24 0.00 9.80 103.64 53.46 7.81 CUSTODIAN 48.30 0.00 9.40 182.46 60.10 1.20 NSLTECH 0.75 8.00 8.00 17.39 45.08 15.87 -
YTD Top Losers
Symbol Price %Chg1Dy %Chg5Dys %ChgYTD RSI Div Yield SIAMLETF40 527.40 -4.25 -13.82 -36.87 48.60 0.00 LEGENDINT 5.40 -9.26 -12.66 -20.97 49.74 0.00 GUINEAINS 1.50 -4.00 -11.66 -38.20 50.50 1.96 MCNICHOLS 3.33 0.00 -10.00 106.83 48.07 5.88 Ikejahotel 20.70 0.00 -9.80 67.61 47.48 0.94 -
YTD Overlap Notables:
- MECURE & NSLTECH post strong momentum both in daily and YTD tables—signal for continued near-term bullish sentiment.
- LEGENDINT appears as both daily and YTD loser with bearish 15DMA crossover, raising caution for bottom-fishers.
Contrarian Signals
- STANBIC: RSI is 51.21 (not overbought), but a strong price breakout above 15/50DMAs and a bullish MACD cross. Despite relatively subdued past performance, this mix often precedes breakout trends—opportunity for risk-tolerant swing traders.
- DANGSUGAR: Up +10% but with moderate RSI (47), suggests strength may still be early/mid-stage, but be alert for exhaustion if volume wanes.
- MCNICHOLS: Despite appearing on YTD losers, posted a neutral day—RSI near 48 suggests technical stability could foster a short-term bounce.
- GUINEAINS: Still on YTD loser table, but RSI is neutral, and no decisive bearish technical confluence—possible value, but only with strict risk control.
Sector Performance Heatmap
| Sector | Net % Chg | Leaders | Laggards | Key Technical Trend |
|---|---|---|---|---|
| Food Products | +10.00 | DANGSUGAR | – | 15DMA↑, MACD Bullish |
| Other Financials | +3.92 | STANBIC | – | 15DMA↑ |
| Insurance | -8.75 | – | WAPIC, GUINEAINS | 15DMA↓, RSI Neutral-to-Weak |
| ETF/Index | -9.99 | – | LOTUSHAL15, VETINDETF, SIAMLETF40 | Heavy Profit-Taking, Bearish Technicals |
| Banking | Mixed | ZENITHBANK (vol. leader), FIRSTHOLDCO | – | Unusual Institutional Flows, Technical Strength |
| Telecom | -4.80 | – | MTNN | Distribution on High Volume |
Dividend-Beta Matrix: Defensive Plays
| Symbol | Dividend Yield (%) | Beta | Technical Trend |
|---|---|---|---|
| ZENITHBANK | 2.25 | 1.20 | Momentum Up, Volume Surge |
| ROYALEX | 7.81 | 0.96 | 5D/YTD Outperformer |
| NSLTECH | 15.87 | 0.68 | Strong Price Action, High Yield |
| CUTIX | 6.52 | 0.70 | Bearish Momentum (15DMA↓) |
| AIICO | 4.13 | 1.33 | Bearish Technicals |
- High Yield + Bullish: NSLTECH and ROYALEX – High dividend, low-to-average Beta, and bullish momentum suggest "defensive growth" appeal.
- High Yield + Bearish: CUTIX and AIICO – Attractive yield but watch for further price weakness due to bearish momentum signals.
Institutional Clustering Alerts
- ZENITHBANK was the epicenter of institutional activity, accounting for 20.17% of institutional trade value. Institutional dominance (over 90% of volume/value for the day, 71% of total market volume) suggests accumulation phase continues. Banks dominate both retail and institutional action.
- MTNN and FIRSTHOLDCO also experienced heavy institution-led turnover, but for MTNN, distribution (as price fell) may signal risk of further weakness if support does not emerge.
Market Activity Analysis
- Trading Dynamics: Institutional investors drove market action with 90.95% of total value and 71.19% of volume, despite just 35.19% of trade count. Retail impact shrank considerably to less than 30% of total volume, signaling a risk-averse retail base.
-
Correlations:
- ZENITHBANK, ACCESSCORP, MTNN, UBA, GTCO: Repeated as both institutional and retail trading favorites—these names anchor liquidity and set tone for market moves.
- FirstHoldCo & CHELLARAM (Unusual Volume): Suggest renewed speculative or institutional interest.
-
Actionable Insight:
- Follow the big money: where volumes are outsized (like ZENITHBANK), technicals are strong (15DMA cross, RSI not yet overbought), and institutions dominate—short-term momentum or accumulation in play.
- Avoid/hedge positions in persistent institutional distribution (e.g., MTNN today) given negative price/volume action.
Opportunities & Cautions for Traders
- Momentum Buys: Watch DANGSUGAR, STANBIC, ZENITHBANK for potential short-term entries. Seek confirmation of continued institutional inflow and healthy RSI levels (<70).
- High Yield, Low Beta Picks: ROYALEX and NSLTECH combine defensive yield with technical upside—suitable for conservative or income-focused portfolios.
- Mean Reversion Plays: Stocks like LEGENDINT, DEAPCAP (deep oversold if RSI falls below 40) can present bounce-back trades, but with strict stops and only if reversal volume emerges.
- Caution: Avoid structurally weak names such as LOTUSHAL15, WAPIC, RTBRISCOE until evidence of buyers and stable technicals reappear.
- Sector Rotation: With ETFs/Indices weak and Insurance under pressure, focus flows toward Banking and selected Food/Product leaders.
Hidden & Subtle Insights
- Volume/Price Divergence: MTNN's heavy sell-off on surging volume hints at institutional profit-taking or unwinding—possible leading indicator for banking/telecom sector pressure.
- Persistently Bullish Names: MECURE and CHELLARAM carry continued 5D/YTD momentum strength, signaling "crowded trade” conditions. Monitor for momentum exhaustion in high-flyers.
- Institutional "Clustering”: The clustering of both volume and value in a select basket of banks highlights the sector as a liquidity and confidence anchor in the current market structure.
- Broad Market Softness: Despite notable individual winners, turnover slumped across the board, and more issues saw volume declines than increases, hinting that the rally remains selective, not broad-based.
Retail vs. Institutional Activity Table
| Investor Type | Trade Count | Total Volume | Total Value (₦) | % Volume | % Value |
|---|---|---|---|---|---|
| Institutional | 1,883 | 315.1M | 15.43B | 71.19% | 90.95% |
| Retail | 19,839 | 127.51M | 1.54B | 28.81% | 9.05% |
Insight: Heavily institutional-led market day—retail participation remains cautious, tending toward high-liquidity majors.
Summary Table – Top 5 Most Traded (Institutional)
| Symbol | Volume | Value (₦) | Sector |
|---|---|---|---|
| ACCESSCORP | 42.6M | 1.06B | Other Financials |
| ZENITHBANK | 67.2M | 4.63B | Banking |
| MTNN | 5.02M | 2.08B | Telecom |
| UBA | 14.93M | 0.65B | Banking |
| GTCO | 21.99M | 1.99B | Banking |
Summary Table – Top 5 Most Traded (Retail)
| Symbol | Volume | Value (₦) | Sector |
|---|---|---|---|
| ZENITHBANK | 1.82M | 126M | Banking |
| UBA | 1.97M | 86M | Banking |
| ACCESSCORP | 4.67M | 116M | Other Financials |
| MTNN | 0.13M | 54.7M | Telecom |
| GTCO | 0.89M | 80.8M | Banking |
Patterns: Both retail and institutional flows are clustered around the same banking and telecom majors, though institutional investors are using size to influence directional moves.
Key Takeaways For Investors & Traders
- Momentum and Yield Alignment: Favour stocks with both bullish momentum (15DMA cross up, positive MACD) and/or high yield and moderate Beta—STANBIC, ROYALEX, NSLTECH, ZENITHBANK.
- Risk-Off in Weak Sectors: Avoid/hedge in ETFs, Insurance, and illiquid small caps showing persistent downtrends and institutional exit.
- Outsized Flows Matter: Heavily traded banking stocks are where alpha is being created and institutional sentiment telegraphed.
- Monitor Contrarian Setups: Where technicals and price diverge (e.g., bullish MACD without high RSI or vice versa), pay close attention for breakout or breakdown confirmation.
- Volume Trends as Leading Indicator: Unusual volume on price gains (e.g., CHELLARAM) can signal institutional accumulation; on price losses (MTNN), it often signals distribution/sell programs.
Final Note: While select leaders continue to outperform, broad market softness and turnover decline suggest overall cautious sentiment. Keep a keen eye on technical/momentum alignments and institutional flows for navigating upcoming volatility.
|
Top ASI Gainers Over Last 5 Trading Days
|
Top ASI Losers Over Last 5 Trading Days
|
For more detailed analysis, on InfoWARE Market Data Terminal <NSEPERF> <GO>
On InfoWARE Finance Mobile App (Android, iPhone & iPad, Windows Phone and Windows 8/10), "Top Gainers & Losers"
DANGOTE SUGAR REFINERY PLC (DANGSUGAR) topped the advancers list closing at N59.40 with a gain of 10.00% followed by LOTUS HALAL EQUITY ETF (LOTUSHAL15) which closed at N75.87 with a gain of 9.99%.
On the flip side DEAP CAPITAL MANAGEMENT & TRUST PLC (DEAPCAP) and LEGEND INTERNET PLC (LEGENDINT) topped the decliners log with a loss of -9.42% at a close of N1.73, and -9.26% to close the day at N4.90 respectively.
| Symbol | LClose | %Chg |
|---|---|---|
| DANGSUGAR | 59.40 | 10.00 |
| LOTUSHAL15 | 75.87 | 9.99 |
| MECURE | 23.75 | 9.95 |
| CORNERST | 6.48 | 8.00 |
| NSLTECH | 0.81 | 8.00 |
For more detailed analysis,
- On InfoWARE Market Data Terminal <TOPG> <GO>
- On InfoWARE Finance Mobile App ( Android, iPhone & iPad and Windows 10) , "Top Gainers & Losers"
Currency Market
In the currency market, the Naira appreciated 0.23%(3.37) against the Dollar to settle at 1 to 1NSE: Bull Signal - Price crossed above 15 Day MA
This signal implies these stocks are under buying pressure and the price might continue to rise and therefore positions should be monitored closely. Further suggested analysis include looking at the overall market (ASI) to see if the uptrend is market wide, sector wide or specific to the stock. Portfolio managers tend to use this as a signal to do more research to add to their positions or lock in some profits. Typically further analysis should be done using commands like PC and RV on the InfoWARE Market Data Terminal. Another command is ALERTS to set price triggers for possible exit or entry as necessary
For more detailed analysis,
- On InfoWARE Market Data Terminal <NSEPERF> <GO>
- On InfoWARE Finance Mobile App ( Android , iPhone & iPad and Windows 10) , "Top Gainers & Losers"
| Symbol | Price | %Chg | 15DMA | PE | EPS | DivY | MktCap | Vol | Trades | Value | LstTradeTime |
|---|---|---|---|---|---|---|---|---|---|---|---|
| DANGSUGAR | 59.40 | 9.09 | 59.06 | 11.48 | 3.06 | 4.27 | 721.52B | 1.46M | 398.00 | 86.30M | 24-Sep-2025 14:30:12.677 |
| STANBIC | 101.85 | 3.78 | 98.78 | 6.87 | 8.23 | 3.54 | 1,319.67B | 885.90K | 304.00 | 92.05M | 24-Sep-2025 14:30:14.043 |
| AUSTINLAZ | 2.91 | 0.00 | 2.90 | 0.00 | 0.00 | 0.00 | 3.14B | 7.39K | 10.00 | 20.30K | 24-Sep-2025 14:30:09.703 |
NSE: BEAR Signal - Price crossed below 15 Day MA
This signal implies these stocks are under selling pressure and the price might continue to slide and therefore positions should be monitored closely. Further suggested analysis include looking at the overall market (ASI) to see if the downtrend is market wide, sector wide or specific to the stock. If the overal market trend is upwards, then since these stocks are heading in the opposite direction, then further analysis should be done using commands like PC and RV on the InfoWARE Market Data Terminal. Another command is ALERTS to set price triggers for possible exit is necessar
For more detailed analysis,
- On InfoWARE Market Data Terminal <BEARM> <GO>
- On InfoWARE Finance Mobile App ( Android , iPhone & iPad and Windows 10)
| Symbol | Price | %Chg | 15DMA | PE | EPS | DivY | MktCap | Vol | Trades | Value | LstTradeTime |
|---|---|---|---|---|---|---|---|---|---|---|---|
| NGX30 | 5,124.77 | -0.14 | 5,128.25 | 575.61 | 329.08 | 0.00 | 0.00 | 232.47M | 11,656.00 | 13.62B | 24-Sep-2025 14:30:17.410 |
| NGXPENBRD | 2,607.82 | -0.21 | 2,611.55 | 348.78 | 389.18 | 0.00 | 0.00 | 302.24M | 16,797.00 | 14.66B | 24-Sep-2025 14:30:17.620 |
| NGXLOTUSISLM | 11,591.10 | -0.66 | 11,592.10 | 1,270.93 | 62.77 | 0.00 | 0.00 | 15.18M | 3,596.00 | 2.82B | 24-Sep-2025 14:30:17.547 |
| CUTIX | 3.46 | -1.16 | 3.49 | 8.81 | 0.26 | 6.52 | 12.19B | 3.40M | 203.00 | 11.93M | 24-Sep-2025 14:30:09.950 |
| NAHCO | 105.00 | -1.43 | 105.04 | 92.98 | 0.41 | 6.66 | 204.65B | 1.02M | 124.00 | 107.23M | 24-Sep-2025 14:30:13.540 |
| AIICO | 3.92 | -1.53 | 3.94 | 2.01 | 0.60 | 4.13 | 143.49B | 5.36M | 292.00 | 20.89M | 24-Sep-2025 14:30:28.080 |
| VFDGROUP | 10.80 | -1.85 | 10.96 | 0.00 | 0.00 | 0.00 | 0.00 | 3.20M | 229.00 | 34.42M | 24-Sep-2025 14:30:14.433 |
| CAVERTON | 6.65 | -3.76 | 6.67 | 1.15 | 1.57 | 5.52 | 22.28B | 575.10K | 70.00 | 3.81M | 24-Sep-2025 14:30:09.827 |
| MAYBAKER | 16.25 | -7.69 | 17.31 | 58.94 | 0.14 | 3.75 | 28.04B | 249.13K | 74.00 | 4.08M | 24-Sep-2025 14:30:13.407 |
| VETINDETF | 45.00 | -8.89 | 47.26 | 0.00 | 0.00 | 510.00 | 8.00 | 22.95K | 24-Sep-2025 14:30:28.400 | ||
| LEGENDINT | 4.90 | -10.20 | 5.35 | 0.00 | 0.00 | 5.62M | 150.00 | 28.55M | 24-Sep-2025 14:30:28.110 | ||
| DEAPCAP | 1.73 | -10.40 | 1.77 | 188.84 | 0.01 | 13.76 | 2.60B | 1.41M | 62.00 | 2.45M | 24-Sep-2025 14:30:12.697 |
| FGSUK2031S4 | 73.50 | -31.89 | 85.41 | 0.00 | 0.00 | 5.00K | 1.00 | 3.68M | 24-Sep-2025 14:30:31.250 |
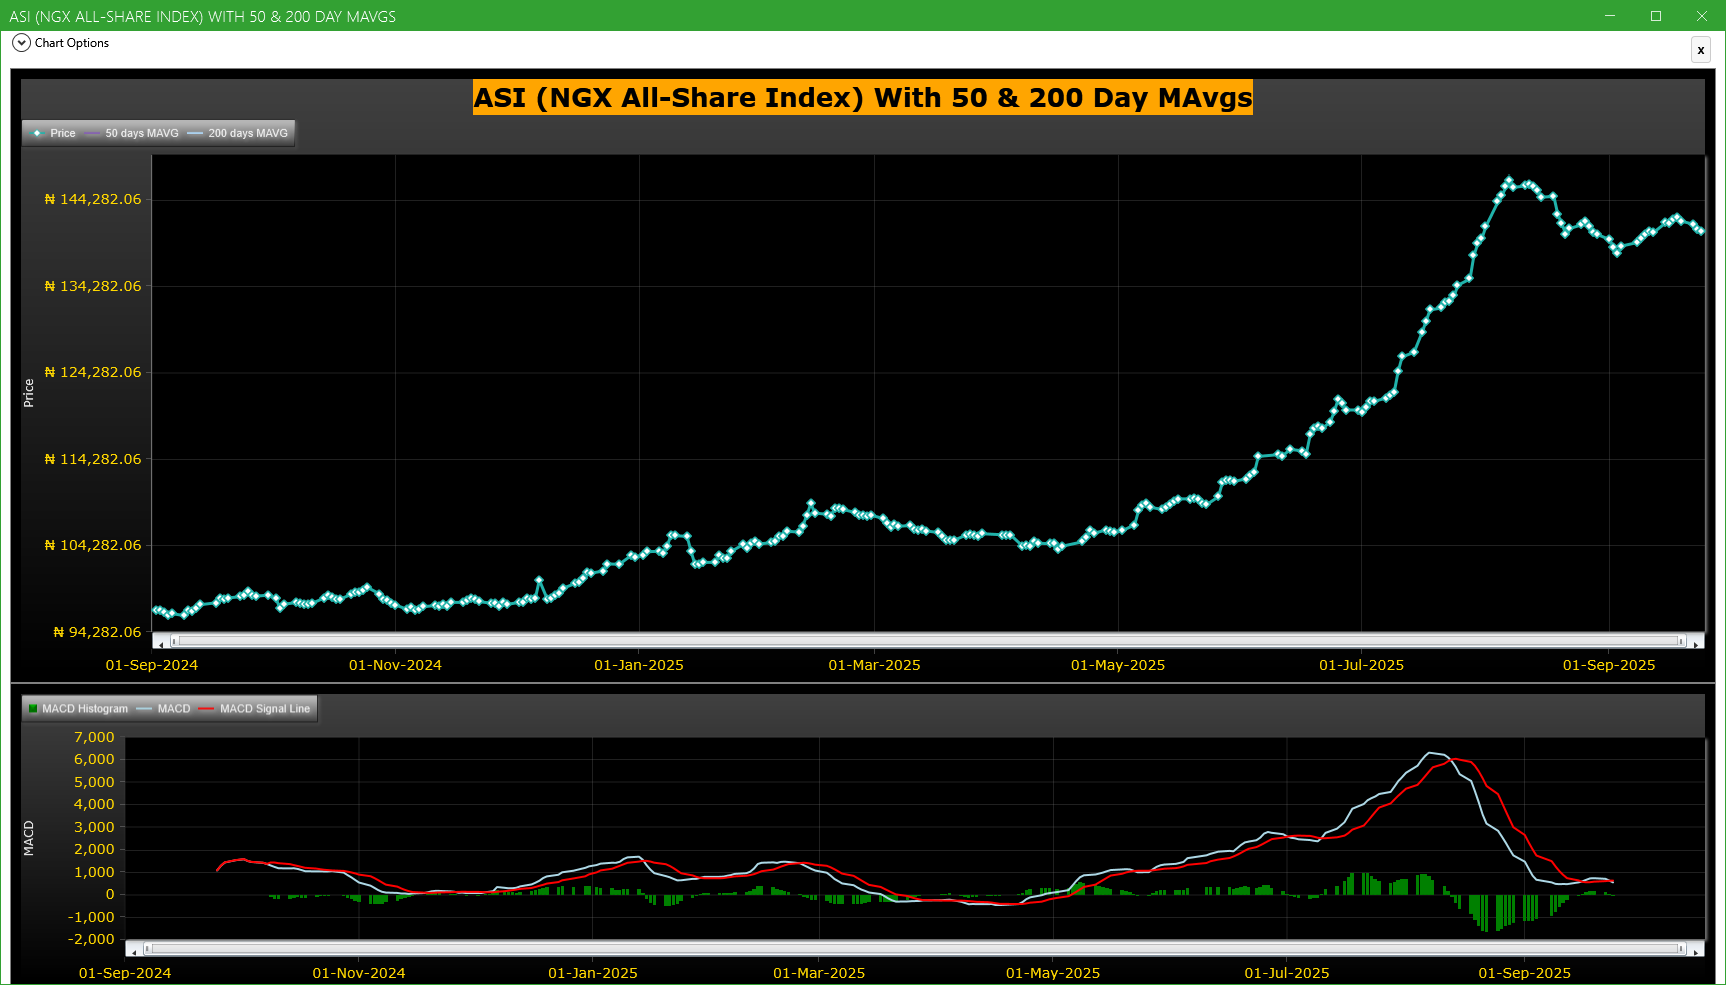
Market Trend - ASI (NGX All-Share-Index) With 50 & 200 Day MAvgs Chart
Technical traders typically use the 50 & 200 day moving averages to aid in choosing
where to enter or exit a position, which then causes these levels to act as strong
support or resistance. As a general guideline, if the price is above a moving average,
the trend is up. If the price is below a moving average, the trend is down.
It is important to note that critics of technical analysis say that moving averages act
as support and resistance because so many traders use these indicators to inform their
trading decisions. Also moving averages tend to work quite well in strong trending conditions
but poorly in choppy or ranging conditions.
Trading Strategies: Crossovers
Crossovers are one of the main moving average strategies. The first type is a price crossover,
which is when the price crosses above or below a moving average to signal a potential change
in trend. Another strategy is to apply two moving averages to a chart: one longer and one
shorter. When the shorter-term MA crosses above the longer-term MA, it is a buy signal, as
it indicates that the trend is shifting up. This is known as a golden cross. Meanwhile, when
the shorter-term MA crosses below the longer-term MA, it is a sell signal, as it indicates that
the trend is shifting down. This is known as a dead/death cross
For more detailed analysis,
- On InfoWARE Market Data Terminal <CI> <GO>
- On InfoWARE Finance Mobile App ( Android , iPhone & iPad and Windows 10) , "Research"
Unusual Volume: Volume traded is more than double the 90 day moving average (All exchanges; ASI & ASem). For more detailed analysis,
- On InfoWARE Market Data Terminal <UV> <GO>
- On InfoWARE Finance Mobile App ( Android , iPhone & iPad and Windows 10)
| Symbol | Name | Volume | 90DAvgVol | %VolChg | Price | LClose | %Chg | Trades | Value |
|---|---|---|---|---|---|---|---|---|---|
| ZENITHBANK | ZENITH INTERNATIONAL BANK PLC | 68.99M | 27.04M | 155.17 | 68.80 | 67.90 | 1.33 | 1,445 | 4.76B |
| FIRSTHOLDCO | FIRST HOLDCO PLC | 46.11M | 16.71M | 175.95 | 31.00 | 30.70 | 0.98 | 370 | 1.42B |
| MTNN | MTN NIGERIA PLC | 5.15M | 1.97M | 161.69 | 414.10 | 435.00 | -4.80 | 1,094 | 2.14B |
| CHELLARAM | CHELLARAMS PLC. | 739.09K | 103.38K | 614.92 | 16.25 | 16.00 | 1.56 | 83 | 12.06M |
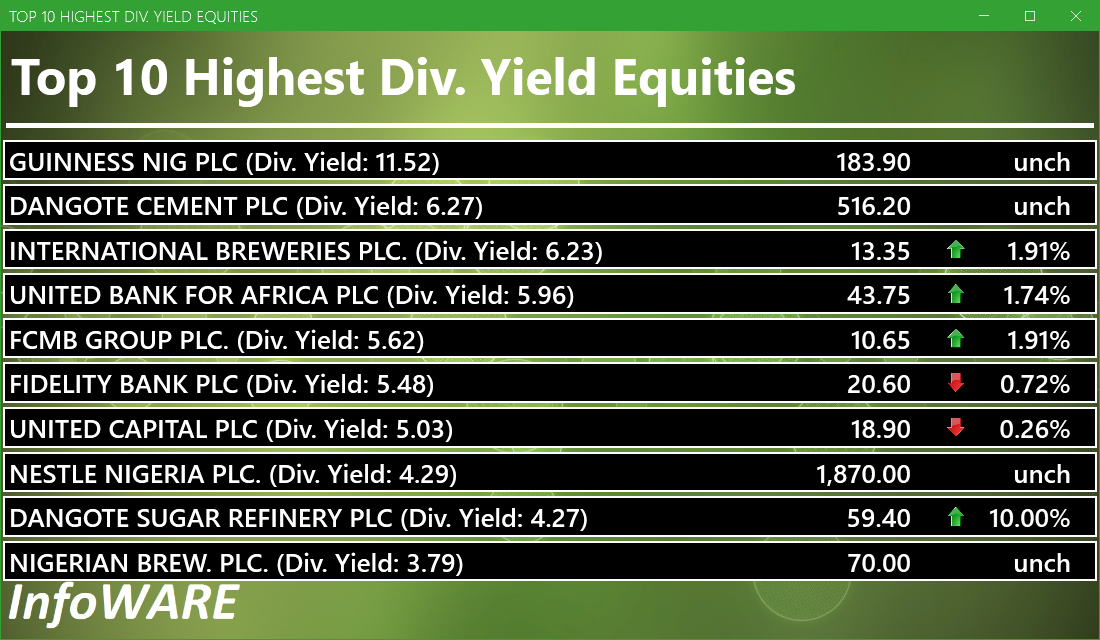
Investment Insights - High Div. Stocks
Dividend stocks distribute a portion of the company earnings to investors on a regular basis and they can a great choice for investors looking for regular income. As an investment or trading strategy, high dividend yield equities provide annual cash payments as against mostly capital gains in the price of a stock. The list in the table below represent the highest dividend paying stocks from the list of the most liquid stocks in the NSE top 30.
For more detailed analysis,
- On InfoWARE Market Data Terminal <HYIELD> <GO>
- On InfoWARE Finance Mobile App ( Android , iPhone & iPad and Windows 10) , "Research"
Investment Insights - Stocks outperforming the ASI but with approximately the same risk
These list of stocks represent equities that are less risky than the ASI but doing better than the ASI (All Shares Index) using the YTD (Year to Date) returns as the measure. The risk is measured by Beta. Beta is an assessment of a stock's tendency to undergo price changes, (its volatility), as well as its potential returns compared to the ASI. It is expressed as a ratio, where a score of 1 represents performance comparable to the ASI, and returns above or below the market may receive scores greater or lower than 1.
For a full list of both positively and negatively corelated stocks visit InfoWARE Market Data Terminal
- On InfoWARE Market Data Terminal <BANL> <GO>
- On InfoWARE Finance Mobile App ( Android , iPhone & iPad and Windows 10)
| Symbol | DivYield | PE | EPS | Beta | %ChgYTD | ASIYTDReturn | BetaDiff |
|---|---|---|---|---|---|---|---|
| HONYFLOUR | 1.40 | 16.28 | 0.31 | 0.99 | 202.75 | 36.38 | 0.01 |
| CAVERTON | 5.52 | 1.15 | 1.57 | 0.98 | 160.78 | 36.38 | 0.02 |
| ROYALEX | 7.81 | 0.00 | 0.00 | 0.96 | 103.64 | 36.38 | 0.04 |
| CORNERST | 5.28 | 8.62 | 0.35 | 0.93 | 63.64 | 36.38 | 0.07 |
| DEAPCAP | 13.76 | 188.84 | 0.01 | 0.89 | 44.17 | 36.38 | 0.11 |
| UNIVINSURE | 0.00 | 0.00 | 0.00 | 0.83 | 61.11 | 36.38 | 0.17 |
| FTNCOCOA | 1.60 | 0.00 | 0.00 | 0.79 | 193.62 | 36.38 | 0.21 |
| NB | 3.79 | 16.95 | 1.60 | 0.79 | 118.75 | 36.38 | 0.21 |
| MAYBAKER | 3.75 | 58.94 | 0.14 | 0.78 | 72.87 | 36.38 | 0.22 |
| UNILEVER | 2.81 | 67.09 | 0.40 | 0.75 | 102.78 | 36.38 | 0.25 |
African Markets
| Name | LClose | Change | %Chg |
|---|---|---|---|
| BRVM Stock Exchange | 323.35 | 0.23 | 0.07 |
| Botswana Stock Exchange | 10,610.53 | 0.00 | 0.00 |
| Egyptian Exchange | 35,328.63 | 116.20 | 0.33 |
| Ghana Stock Exchange | 7,800.70 | 21.78 | 0.28 |
| Johannesburg Stock Exchange | 106,693.25 | 731.14 | 0.69 |
| Lusaka Stock Exchange | 25,084.27 | -146.34 | -0.58 |
| Casablanca Stock Exchange | 19,770.15 | -185.59 | -0.93 |
| Malawi Stock Exchange | 578,467.58 | 3,221.38 | 0.56 |
| Nigeria Stock Exchange | 140,929.60 | -565.98 | -0.40 |
| Nairobi Securities Exchange | 174.32 | 0.92 | 0.53 |
| Namibian Stock Exchange | 1,898.32 | 7.94 | 0.42 |
| Rwanda Stock Exchange | 179.31 | 0.00 | 0.00 |
| Tunis Stock Exchange | 12,419.39 | 44.55 | 0.36 |
| Uganda Securities Exchange | 1,429.25 | -0.86 | -0.06 |
Nigeria Market Indexes
| Symbol | LClose | %Chg | WTD% | MTD% | QTD% | YTD% | MktCap | Trades |
|---|---|---|---|---|---|---|---|---|
| ASI | 140,716.10 | -0.15 | -0.55 | 0.71 | 17.52 | 36.38 | 20,330 | |
| NGX30 | 5,124.77 | -0.14 | -0.60 | 0.55 | 8.49 | 34.34 | 11,656 | |
| NGXAFRBVI | 3,463.82 | 1.41 | 0.54 | -0.62 | -2.25 | 39.63 | 5,359 | |
| NGXAFRHDYI | 22,303.69 | 0.46 | -0.38 | -1.01 | 6.65 | 30.99 | 5,317 | |
| NGXASEM | 1,538.10 | 0.00 | 0.00 | 0.00 | -3.57 | -2.88 | 2 | |
| NGXBNK | 1,490.99 | 1.29 | 0.23 | -1.36 | -1.31 | 37.11 | 6,103 | |
| NGXCG | 3,982.93 | 0.17 | -0.63 | -1.28 | 15.83 | 40.78 | 11,458 | |
| NGXCNSMRGDS | 3,347.15 | 0.55 | 0.44 | 4.94 | -3.50 | 92.99 | 2,360 | |
| NGXCOMMDTY | 1,101.96 | 0.00 | -0.90 | 3.17 | 5.22 | 10.19 | ||
| NGXGROWTH | 13,403.33 | 6.42 | 7.57 | 19.67 | 40.95 | 72.66 | 231 | |
| NGXINDUSTR | 4,911.52 | 0.25 | -0.35 | -0.42 | 39.42 | 37.51 | 1,433 | |
| NGXINS | 1,235.08 | -0.25 | -1.04 | -3.73 | 67.22 | 57.10 | 1,601 | |
| NGXLOTUSISLM | 11,591.10 | -0.65 | -1.76 | 1.51 | 21.06 | 66.35 | 3,596 | |
| NGXMAINBOARD | 6,931.39 | 0.31 | -0.16 | 2.13 | 17.50 | 38.52 | 14,170 | |
| NGXMERIGRW | 9,800.61 | 1.14 | -0.90 | -2.14 | 1.54 | 50.24 | 3,033 | |
| NGXMERIVAL | 13,348.12 | 1.09 | 0.87 | -0.16 | 11.72 | 27.97 | 6,079 | |
| NGXOILGAS | 2,428.42 | -0.05 | -1.85 | 2.44 | 1.52 | -10.43 | 313 | |
| NGXPENBRD | 2,607.82 | -0.21 | -0.72 | 0.68 | 13.42 | 42.38 | 16,797 | |
| NGXPENSION | 6,616.44 | 0.08 | -0.64 | -0.05 | 4.12 | 45.93 | 12,828 | |
| NGXPREMIUM | 13,487.77 | -1.06 | -1.34 | -1.99 | 17.59 | 38.58 | 5,929 | |
| NGXSOVBND | 657.27 | 0.00 | 0.00 | -0.24 | 0.58 | 9.26 | 0 |
For more detailed analysis,
- On InfoWARE Market Data Terminal <MKTINS> <GO>
- On InfoWARE Finance Mobile App ( Android, iPhone & iPad and Windows 10) , "Market Indexes"
Find the topic interesting? Will like to comment? Contact Us at solutions@infowarelimited.com
Top News

InfoWARE AI Analyst Weekly Market Report: 26-Sep-2025
Chart Of The Day - ASI Chart Vs ASI Advance Decline Line (YTD) (26-Sep-2025 15:06:50.109)
InfoWARE AI Analyst Daily Market Report: 26-Sep-2025

[MERGROWTH]>> DAILY INDICATIVE PRICES
[VSPBONDETF]>> DAILY INDICATIVE PRICES
[XNSA]>> NGX FIXED INCOME INDICATIVE PRICE LIST FOR SEP 26, 2025
[XNSA]>> EXECUTIVE CAPACITY DEVELOPMENT COURSE ON NIGERIA CAPITAL MARKET
[XNSA]>> DAILY FUND PRICE SUBMISSION - FCMB ASSET MANAGEMENT LIMITED
[XNSA]>> REGISTRATION FOR BATCH TWO- 2025 DEALING CLERKSHIP CERTIFICATION PROGRA
[SIAMLETF40]>> DAILY INDICATIVE PRICES
[XNSA]>> DAILY INDICATIVE PRICES
[XNSA]>> UPDATED- SAVE THE DATE: 29TH ANNUAL STOCKBROKERS CONFERENCE
[XNSA]>> AELP CAPACITY BUILDING & ASSDA FORUM
Chart Of The Day - ASI Chart Vs ASI Advance Decline Line (YTD) (25-Sep-2025 15:09:51.734)
InfoWARE AI Analyst Daily Market Report: 25-Sep-2025
[XNSA]>> OFF MARKET TRADE
[MERGROWTH]>> DAILY INDICATIVE PRICES
[VSPBONDETF]>> DAILY INDICATIVE PRICES
[XNSA]>> CORDROS MILESTONE FUNDS' BID & OFFER PRICES
[XNSA]>> NGX FIXED INCOME INDICATIVE PRICE LIST FOR SEP 25, 2025
[LOTUSHAL15]>> DAILY INDICATIVE PRICES
[XNSA]>> APPOINTMENT OF DIRECTORS
[XNSA]>> OFF MARKET TRADE
[XNSA]>> REGISTRATION FOR BATCH TWO- 2025 DEALING CLERKSHIP CERTIFICATION PROGRA
[XNSA]>> UPDATED- SAVE THE DATE: 29TH ANNUAL STOCKBROKERS CONFERENCE
[SIAMLETF40]>> DAILY INDICATIVE PRICES
[XNSA]>> AELP CAPACITY BUILDING & ASSDA FORUM
Chart Of The Day - ASI Chart Vs ASI Advance Decline Line (YTD) (24-Sep-2025 15:06:41.102)
InfoWARE AI Analyst Daily Market Report: 24-Sep-2025
[XNSA]>> DAILY FUND PRICE SUBMISSION - FCMB ASSET MANAGEMENT LIMITED
Get IDIA - the stock trading app for the modern investor
Solutions by Business
Product Suites
Company
Contacts
- 8th Floor,
- South Atlantic Petroleum Towers,
- 1 Adeola Odeku Street,
- Victoria Island,
- Lagos, Nigeria.
- Email: solutions@infowarelimited.com
Follow Us
 |
 |
 |
 |