


InfoWARE AI Analyst Daily Market Report: 15-Oct-2025 | InfoWARE Finance
Get IDIA - the stock trading app for the modern investor


InfoWARE AI Analyst Daily Market Report: 15-Oct-2025
(Source: InfoWARE Terminal, Date: 15-Oct-2025)
Dear Investor,
NGX Daily Market Summary – Wednesday, October 15, 2025
The NGX All Share Index (ASI) closed marginally up 0.02% at 147,710.96, extending its impressive 43.19% YTD return. Despite the positive tick, trading activity softened: total volume slipped to 361.05M shares and turnover fell sharply by -35.66% to 11.15B Naira. Market breadth remained healthy (1.23x) with more advancers (37) than decliners (30), indicating selective bullishness. Notably, ETF instruments (SFSREIT, GREENWETF) dominated the top gainers, while industrial and financials absorbed the bulk of losses. The sustained rotation between sectors, coupled with spikes in trading volume and momentum divergences, offers a nuanced picture for both traders and institutional investors.
📈 Key Market Trends & Breadth
- Positive Breadth: 37 advancers vs 30 decliners (Breadth: 1.23x) but volume down for 87 companies (50 up), meaning few winners drove gains.
- Turnover Decrease: Value traded dropped -35.66% (to 11.15B) vs prior session—a strong retracement; such declines after an up-day often foreshadow consolidation or profit taking.
- Unusual Volume: VITAFOAM (+458.7%), HMCALL, LIVINGTRUST, TRIPPLEG, and IMG saw trading far above their 90-day avg—the former two with price upticks, latter two with steep declines (TRIPPLEG, IMG plunged nearly -10%).
🌟 Top Gainers & Losers
- Top Gainer: SFSREIT (+9.88%, ₦418.75) – sustained strong demand in REITs.
- ETF Surge: GREENWETF (+8.33%, 69 RSI) and MERVALUE (paradoxically a top day gainer and loser in different tables; likely pricing error or ETF rebalance effect) surged, with GREENWETF hitting a very strong MACD/RSI combo.
- Insurance Outperformance: ROYALEX (+7.4%), INTENEGINS (+6.05%)—momentum and RSI neutral, suggesting fresh institutional accumulation.
- Steepest Loser: MERVALUE (-9.85%, ₦174.00) and TRIPPLEG (-9.91%, ₦4.91) – note MERVALUE's conflicting placement (see Contrarian Signals below).
- Volume-Decline Correlation: TRIPPLEG and IMG, both heavy-volume fallers, also sit among YTD laggards—a potential exhaustion signal for short-sellers.
| Name | Price | 5D % | YTD % | RSI | MACD | DivYield |
|---|---|---|---|---|---|---|
| GREENWETF | 360 | 30.00% | 67.95% | 69.28 | 17.57 | 0.00% |
| MERVALUE | 158.4 | 20.83% | -2.90% | 41.72 | -10.94 | 0.00% |
| VSPBONDETF | 240 | 17.64% | 17.71% | 56.53 | -2.39 | 0.00% |
| CONHALLPLC | 4.60 | 13.10% | 18.75% | 58.39 | 0.10 | 2.08% |
| WAPIC | 3.30 | 10.00% | 6.45% | 53.61 | -0.02 | 2.56% |
| Name | Price | 5D % | YTD % | RSI | MACD | DivYield |
|---|---|---|---|---|---|---|
| TRIPPLEG | 5.45 | -18.84% | 118.22% | 46.76 | 0.14 | 5.32% |
| REGALINS | 1.48 | -13.33% | 78.75% | 48.04 | 0.03 | 6.52% |
| IMG | 35.95 | -9.87% | -14.62% | 50.43 | 0.08 | 1.32% |
| AUSTINLAZ | 2.90 | -7.94% | 60.22% | 48.76 | 0.11 | 0.00% |
| ELLAHLAKES | 13.95 | -7.89% | 341.86% | 53.14 | 0.40 | 0.00% |
🔎 Momentum & Technical Observations
- Bullish Crossovers: ROYAL EXCHANGE (ROYALEX) and JULIUS BERGER (JBERGER) both up >5% and closed above 15DMA, hinting at near-term upside. ROYAL EXCHANGE especially combines a bullish MACD, positive price action, and moderate RSI (51).
- Bearish Signals: WEMABANK, JAIZBANK, NGXBNK, PRESTIGE, HONYFLOUR, JAPAULGOLD, UACN all closed below 15DMA, confirming recent underperformance. Many overlap with YTD or 5D losers (UACN, JAPAULGOLD).
- Volume Confirmation: Both TRIPPLEG and IMG had >2x 90DAvgVol trading and deep declines, reinforcing heavy distribution selling.
- RSI Extreme Watch: No 5D/YTD leaders or laggards are "red hot” on RSI (>70) or deeply oversold (<30). GREENWETF gets closest at RSI 69—overbought territory. TRIPPLEG and IMG are mid-RSI, suggesting more downside is possible if volume persists.
- MACD Divergence: GREENWETF features an aggressive positive MACD histogram (+15.64) and price well above its moving averages—suggesting extended bullish momentum but a cautionary watch for mean reversion.
⚖️ Contrarian Signals
- MERVALUE: Simultaneous appearance as a top gainer (+9.85%) and top loser (-9.85%)—possibly due to ETF pricing, tracking error, or market technicals. Such ETF volatility can swing sentiment abruptly; avoid chasing moves without confirming underlying asset NAV.
- TRIPPLEG: Despite being a top YTD gainer (118% YTD), it's currently the steepest 5D and daily decliner (-18.8% 5D), and trades with huge volume – classic "distribution top” pattern.
- IMG: Features in both top 5 day and YTD loser lists and sees ≥227% normal volume. Despite losing -9.87% in a day, RSI mid range—hidden risk of further weakness but with the potential for a dead cat bounce.
- CONHALLPLC: Strong 5D surge (13%), but moderate RSI (~58) and flat MACD, with positive volatility—potential for additional upside but reduced momentum.
- Dividend Losers: REGALINS and TRIPPLEG have high dividend yields yet are stalling among losers; this traps income hunters but offers long-term value on further weakness.
🔥 Sector Performance Heatmap
| Sector | Direction | Sample Movers | Retail % by Volume | Institutional % by Volume | Retail vs Institutional Pattern |
|---|---|---|---|---|---|
| ETF/REITs | Up | SFSREIT, GREENWETF, MERVALUE | Low | High | Institutions buying up ETFs—defensive or rotation play? |
| Other Financials/Insurance | Up | ROYALEX, MBENEFIT | Mixed | Moderate | Broad participation, possible accumulation phase |
| Industrial/Chemicals | Down | IMG, TRIPPLEG | Low | Spiking | Institutions selling into volume spikes |
| Construction/Infra | Up | JBERGER | Low | Moderate | Bullish price signals and 15D/50D cross |
| Banking | Down | WEMABANK, UACN, JAIZBANK | High | High | Profit-taking; short-term weakness after outsized prior gains |
| Consumer/Household | Up | VITAFOAM | Low | High | Institutionals buying high-volume breakout |
🔄 Dividend - Beta Defensive Matrix
| Stock | Dividend Yield | Beta | Signal |
|---|---|---|---|
| AFRIPRUD | 1.27% | 0.64 | Low-beta, moderate yield; classically defensive. |
| TRIPPLEG | 5.32% | 0.60 | High yield, but huge volatility. Be cautious—may be "yield trap.” |
| REGALINS | 6.52% | 0.47 | Attractive yield, but price trend is weak. Value seekers may watch for bottom. |
| MBENEFIT | 3.28% | 1.27 | High yield, high beta—aggressive income play with volatility risk. |
| CUSTODIAN | 1.20% | 0.54 | Defensive nature with rising YTD trend; consider on dips. |
- Implication: While high-dividend, low-beta stocks (AFRIPRUD, REGALINS) remain defensive, note that some are currently facing price pressure—ideal for dividend reinvestors with a contrarian tilt.
🏦 Institutional Clustering
- ZENITHBANK: Led institutional trading by value today (20.17%+ of institutional trade value). Such clustering could signify upcoming block trades or index rebalancing—watch for continued volatility or "stealth” accumulation.
- VITAFOAM: Both institutions and retail traded record volumes today—often marks the beginning (or end) of a significant trend. Price +4.32% off huge volume is a positive lead.
| Symbol | TradeCount | TotalVolume | TotalGrossTradeAmt | Sector |
|---|---|---|---|---|
| ZENITHBANK | 190 | 19.79M | ₦1.35B | Banking |
| ACCESSCORP | 127 | 16.25M | ₦419M | Other Financials |
| VITAFOAM | 123 | 4.35M | ₦360M | Household Durables |
| MTNN | 108 | 0.79M | ₦371M | Telecom |
| GTCO | 106 | 8.30M | ₦778M | Banking |
| Symbol | TradeCount | TotalVolume | TotalGrossTradeAmt | Sector |
|---|---|---|---|---|
| MTNN | 1,162 | 0.22M | ₦101M | Telecom |
| GTCO | 1,064 | 0.98M | ₦91.5M | Banking |
| ACCESSCORP | 943 | 2.96M | ₦76.4M | Other Financials |
| UBA | 928 | 1.61M | ₦68.3M | Banking |
| ZENITHBANK | 823 | 1.06M | ₦72M | Banking |
- Pattern: Banks and large-caps remain the main retail churn zone, but institutions are weighting ETFs and select industrials (VITAFOAM, ZENITHBANK)—suggesting portfolio rotations away from crowded trades.
- Retail/Institutional Mix: Institutional investors dominated volume (67.85%) and value (86.54%), while retail held most trade counts (63.93%)—showing institutions focus on fewer, larger blocks.
💡 Opportunities & Cautions for Traders
- Favor accumulating ETF/REITs with confirmed momentum but beware of mean reversion in rapidly rising ETFs like GREENWETF.
- High-volume losers like TRIPPLEG and IMG: short-term pain but watch for reversal signs—RSI not oversold yet, but volume spike could mark capitulation soon.
- Dividend/income names (REGALINS, TRIPPLEG, MBENEFIT)—attractive for long-term, but verify earnings quality before bottom fishing.
- Banks look tired on near-term charts; trailing below 15DMA (bearish signal), so wait for confirmation of support before fresh buys.
- Monitor for fund flows into low-beta, moderate-yield stocks for defensive positioning amidst pending market consolidation.
- Keep watch on stocks showing conflicting signals—contrarian setups often offer best risk/reward on successful reversals.
- For ETF exposure, confirm underlying NAV and volumes, not just quoted price action, to avoid getting caught in aberrant technical swings.
🌍 Macro Context
- The Naira appreciated 0.22% (3.27 points) against the Dollar to 1,460/$1, a tailwind for sectors exposed to imports or FX costs.
🔬 Additional Market Activity Insights
- Institutions: Though just 36.07% of trades, they dominated with 67.85% of volumes and 86.54% of value. Their "big block” approach and focus on banks, ETFs, household and infra sectors dictates broad market direction.
- Retail: More active by trade count (63.93%) but controlled just 13.46% of value, showing strong participation in smaller caps, banks, and day-trade friendly names.
-
Patterns:
- Top 5 institutional traded stocks largely align with technical and fundamental drivers (VITAFOAM, ZENITHBANK, GTCO, ACCESSCORP, MTNN) and institutional clustering alerts.
- Retail focus on the same large caps/banks (MTNN, GTCO, UBA, ZENITHBANK) means retail traders chase liquidity and volatility.
- ETF sector rotation: Institutional accumulation in ETFs/REITs points to a tactical shift toward yield and relative safety after recent sharp rallies in banks and industrials.
Bottom Line for Investors:
- Be selective: chase breakouts confirmed by volume and crossovers, not just price.
- Watch for mean reversion in red-hot ETFs and profit-taking in banks and industrials.
- For yield hunters, look for defensive low-beta names—avoid high-yield traps among recent losers unless a true bottom is forming.
- Monitor institutional flows and rotational plays for clues to upcoming sector moves.
|
Top ASI Gainers Over Last 5 Trading Days
|
Top ASI Losers Over Last 5 Trading Days
|
For more detailed analysis, on InfoWARE Market Data Terminal <NSEPERF> <GO>
On InfoWARE Finance Mobile App (Android, iPhone & iPad, Windows Phone and Windows 8/10), "Top Gainers & Losers"
SFS REAL ESTATE INVESTMENT TRUST (SFSREIT) topped the advancers list closing at N418.75 with a gain of 9.88% followed by MERISTEM VALUE EXCHANGE TRADED FUND (MERVALUE) which closed at N174.00 with a gain of 9.85%.
On the flip side TRIPPLE GEE AND COMPANY PLC. (TRIPPLEG) and INDUSTRIAL & MEDICAL GASES NIGERIA PLC (IMG) topped the decliners log with a loss of -9.91% at a close of N4.91, and -9.87% to close the day at N32.40 respectively.
| Symbol | LClose | %Chg |
|---|---|---|
| SFSREIT | 418.75 | 9.88 |
| MERVALUE | 174.00 | 9.85 |
| GREENWETF | 390.00 | 8.33 |
| ROYALEX | 2.33 | 7.37 |
| INTENEGINS | 2.98 | 6.05 |
| Symbol | LClose | %Chg |
|---|---|---|
| TRIPPLEG | 4.91 | -9.91 |
| IMG | 32.40 | -9.87 |
| UACN | 68.00 | -6.46 |
| ELLAHLAKES | 13.30 | -4.66 |
| JAPAULGOLD | 2.54 | -4.51 |
For more detailed analysis,
- On InfoWARE Market Data Terminal <TOPG> <GO>
- On InfoWARE Finance Mobile App ( Android, iPhone & iPad and Windows 10) , "Top Gainers & Losers"
Currency Market
In the currency market, the Naira appreciated 0.22%(3.27) against the Dollar to settle at 1 to 1NSE: Bull Signal - Price crossed above 15 Day MA
This signal implies these stocks are under buying pressure and the price might continue to rise and therefore positions should be monitored closely. Further suggested analysis include looking at the overall market (ASI) to see if the uptrend is market wide, sector wide or specific to the stock. Portfolio managers tend to use this as a signal to do more research to add to their positions or lock in some profits. Typically further analysis should be done using commands like PC and RV on the InfoWARE Market Data Terminal. Another command is ALERTS to set price triggers for possible exit or entry as necessary
For more detailed analysis,
- On InfoWARE Market Data Terminal <NSEPERF> <GO>
- On InfoWARE Finance Mobile App ( Android , iPhone & iPad and Windows 10) , "Top Gainers & Losers"
| Symbol | Price | %Chg | 15DMA | PE | EPS | DivY | MktCap | Vol | Trades | Value | LstTradeTime |
|---|---|---|---|---|---|---|---|---|---|---|---|
| ROYALEX | 2.33 | 6.87 | 2.19 | 0.00 | 0.00 | 7.81 | 11.99B | 16.00M | 212.00 | 37.40M | 15-Oct-2025 14:30:28.373 |
| JBERGER | 134.00 | 5.22 | 133.14 | 16.73 | 10.31 | 1.74 | 214.40B | 211.07K | 90.00 | 27.91M | 15-Oct-2025 14:30:09.817 |
| DAARCOMM | 1.10 | 4.55 | 1.08 | 0.00 | 0.00 | 0.00 | 13.20B | 1.16M | 80.00 | 1.21M | 15-Oct-2025 14:30:09.177 |
| FG202033S6 | 119.39 | 4.21 | 114.69 | 0.00 | 0.00 | 3.91K | 1.00 | 4.67M | 15-Oct-2025 14:30:15.830 | ||
| TRANSCORP | 48.50 | 4.02 | 47.70 | 0.00 | 0.00 | 0.23 | 1,971.43B | 2.31M | 236.00 | 111.45M | 15-Oct-2025 14:30:11.200 |
| MBENEFIT | 3.85 | 3.38 | 3.77 | 5.43 | 0.11 | 3.28 | 77.24B | 4.50M | 139.00 | 17.32M | 15-Oct-2025 14:30:28.357 |
| DEAPCAP | 1.71 | 1.75 | 1.69 | 188.84 | 0.01 | 13.76 | 2.57B | 800.61K | 32.00 | 1.39M | 15-Oct-2025 14:30:28.333 |
NSE: BEAR Signal - Price crossed below 15 Day MA
This signal implies these stocks are under selling pressure and the price might continue to slide and therefore positions should be monitored closely. Further suggested analysis include looking at the overall market (ASI) to see if the downtrend is market wide, sector wide or specific to the stock. If the overal market trend is upwards, then since these stocks are heading in the opposite direction, then further analysis should be done using commands like PC and RV on the InfoWARE Market Data Terminal. Another command is ALERTS to set price triggers for possible exit is necessar
For more detailed analysis,
- On InfoWARE Market Data Terminal <BEARM> <GO>
- On InfoWARE Finance Mobile App ( Android , iPhone & iPad and Windows 10)
| Symbol | Price | %Chg | 15DMA | PE | EPS | DivY | MktCap | Vol | Trades | Value | LstTradeTime |
|---|---|---|---|---|---|---|---|---|---|---|---|
| NGXBNK | 1,514.99 | -0.15 | 1,516.48 | 6.10 | 34.65 | 0.00 | 0.00 | 122.47M | 5,034.00 | 3.67B | 15-Oct-2025 14:30:17.370 |
| ACCESSCORP | 25.75 | -0.58 | 25.86 | 8.56 | 2.81 | 1.87 | 915.29B | 19.21M | 1,070.00 | 495.35M | 15-Oct-2025 14:30:28.607 |
| JAIZBANK | 4.32 | -2.55 | 4.39 | 83.05 | 0.03 | 1.67 | 149.22B | 5.05M | 362.00 | 21.88M | 15-Oct-2025 14:30:31.937 |
| WEMABANK | 18.40 | -3.26 | 18.86 | 216.91 | 0.04 | 5.81 | 236.59B | 5.58M | 301.00 | 103.60M | 15-Oct-2025 14:30:28.403 |
| PRESTIGE | 1.69 | -3.55 | 1.70 | 10.49 | 0.08 | 2.50 | 22.40B | 2.16M | 76.00 | 3.70M | 15-Oct-2025 14:30:10.597 |
| HONYFLOUR | 22.15 | -3.61 | 22.24 | 16.28 | 0.31 | 1.40 | 175.65B | 736.45K | 300.00 | 16.72M | 15-Oct-2025 14:30:09.677 |
| NSLTECH | 0.85 | -4.71 | 0.89 | 0.00 | 0.00 | 15.87 | 4.79B | 1.32M | 79.00 | 1.14M | 15-Oct-2025 14:30:10.437 |
| JAPAULGOLD | 2.54 | -4.72 | 2.62 | 0.19 | 12.01 | 0.90 | 15.91B | 12.36M | 201.00 | 32.58M | 15-Oct-2025 14:30:09.793 |
| ELLAHLAKES | 13.30 | -4.89 | 13.38 | 0.00 | 0.00 | 0.00 | 26.60B | 13.51M | 606.00 | 181.16M | 15-Oct-2025 14:30:09.293 |
| UACN | 68.00 | -6.91 | 70.04 | 9.38 | 2.35 | 1.00 | 198.98B | 1.19M | 117.00 | 81.32M | 15-Oct-2025 14:30:11.280 |
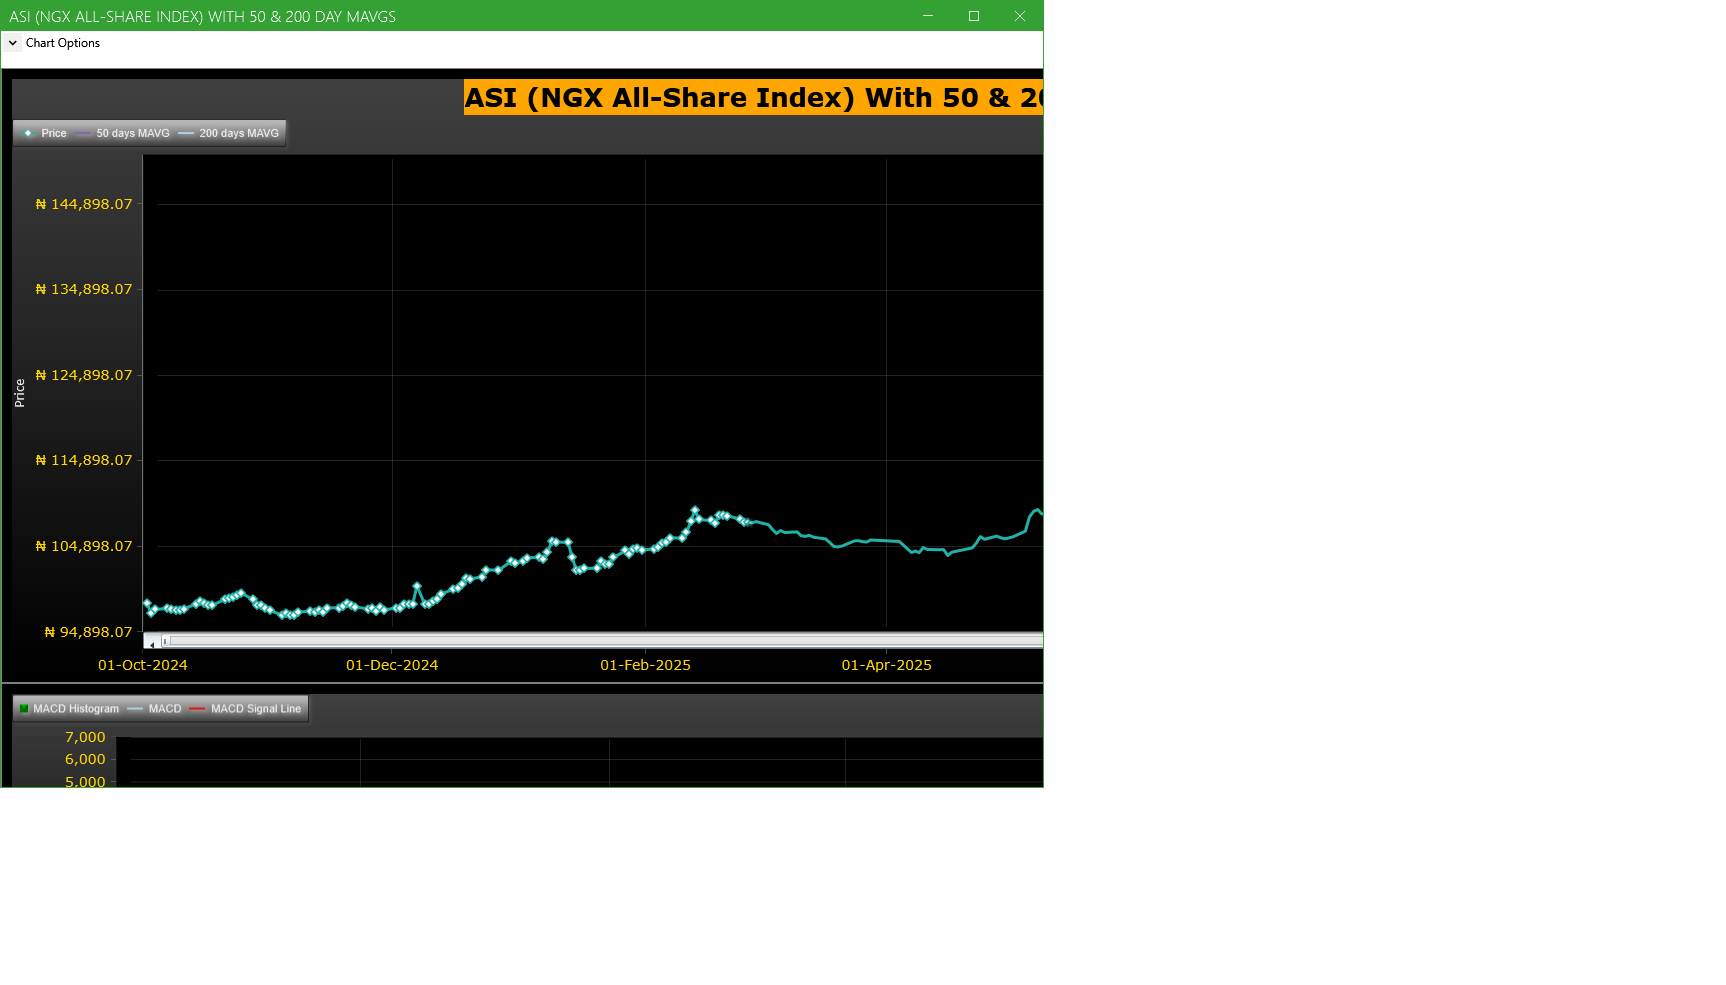
Market Trend - ASI (NGX All-Share-Index) With 50 & 200 Day MAvgs Chart
Technical traders typically use the 50 & 200 day moving averages to aid in choosing
where to enter or exit a position, which then causes these levels to act as strong
support or resistance. As a general guideline, if the price is above a moving average,
the trend is up. If the price is below a moving average, the trend is down.
It is important to note that critics of technical analysis say that moving averages act
as support and resistance because so many traders use these indicators to inform their
trading decisions. Also moving averages tend to work quite well in strong trending conditions
but poorly in choppy or ranging conditions.
Trading Strategies: Crossovers
Crossovers are one of the main moving average strategies. The first type is a price crossover,
which is when the price crosses above or below a moving average to signal a potential change
in trend. Another strategy is to apply two moving averages to a chart: one longer and one
shorter. When the shorter-term MA crosses above the longer-term MA, it is a buy signal, as
it indicates that the trend is shifting up. This is known as a golden cross. Meanwhile, when
the shorter-term MA crosses below the longer-term MA, it is a sell signal, as it indicates that
the trend is shifting down. This is known as a dead/death cross
For more detailed analysis,
- On InfoWARE Market Data Terminal <CI> <GO>
- On InfoWARE Finance Mobile App ( Android , iPhone & iPad and Windows 10) , "Research"
Unusual Volume: Volume traded is more than double the 90 day moving average (All exchanges; ASI & ASem). For more detailed analysis,
- On InfoWARE Market Data Terminal <UV> <GO>
- On InfoWARE Finance Mobile App ( Android , iPhone & iPad and Windows 10)
| Symbol | Name | Volume | 90DAvgVol | %VolChg | Price | LClose | %Chg | Trades | Value |
|---|---|---|---|---|---|---|---|---|---|
| VITAFOAM | VITAFOAM NIG PLC. | 4.71M | 842.71K | 458.69 | 84.50 | 81.00 | 4.32 | 275 | 390.27M |
| HMCALL | HALDANE MCCALL PLC | 4.16M | 929.89K | 347.22 | 4.38 | 4.38 | 0.00 | 31 | 17.42M |
| LIVINGTRUST | LIVINGTRUST MORTGAGE BANK PLC | 1.52M | 669.05K | 126.56 | 5.00 | 5.00 | 0.00 | 52 | 6.95M |
| TRIPPLEG | TRIPPLE GEE AND COMPANY PLC. | 565.74K | 158.85K | 256.15 | 4.91 | 5.45 | -9.91 | 27 | 2.79M |
| IMG | INDUSTRIAL & MEDICAL GASES NIGERIA PLC | 391.37K | 119.64K | 227.13 | 32.40 | 35.95 | -9.87 | 30 | 12.68M |
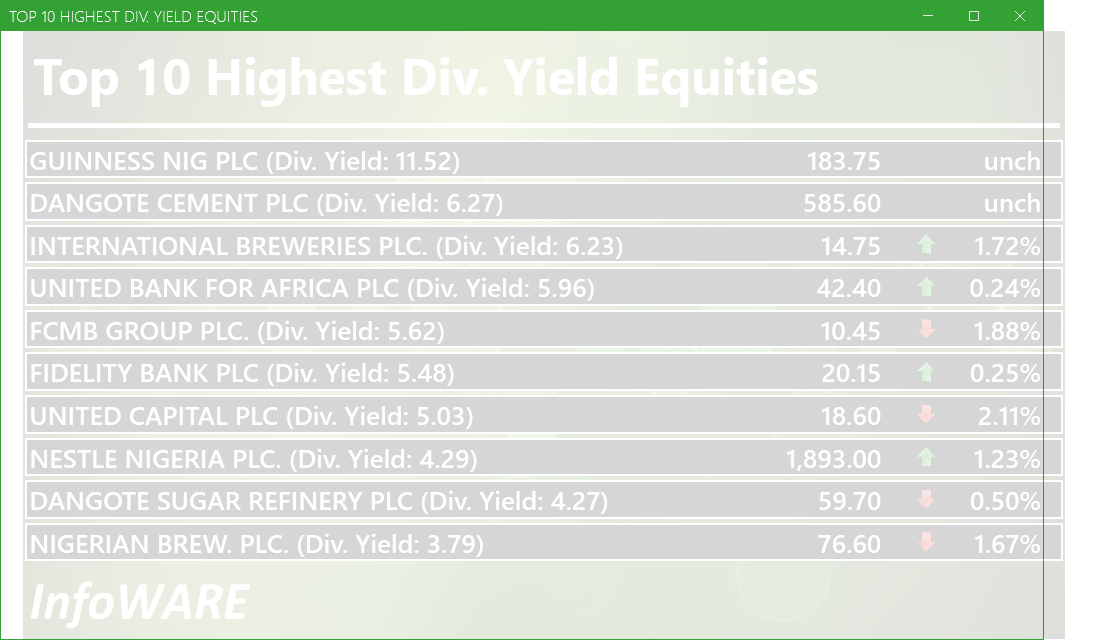
Investment Insights - High Div. Stocks
Dividend stocks distribute a portion of the company earnings to investors on a regular basis and they can a great choice for investors looking for regular income. As an investment or trading strategy, high dividend yield equities provide annual cash payments as against mostly capital gains in the price of a stock. The list in the table below represent the highest dividend paying stocks from the list of the most liquid stocks in the NSE top 30.
For more detailed analysis,
- On InfoWARE Market Data Terminal <HYIELD> <GO>
- On InfoWARE Finance Mobile App ( Android , iPhone & iPad and Windows 10) , "Research"
Investment Insights - Stocks outperforming the ASI but with approximately the same risk
These list of stocks represent equities that are less risky than the ASI but doing better than the ASI (All Shares Index) using the YTD (Year to Date) returns as the measure. The risk is measured by Beta. Beta is an assessment of a stock's tendency to undergo price changes, (its volatility), as well as its potential returns compared to the ASI. It is expressed as a ratio, where a score of 1 represents performance comparable to the ASI, and returns above or below the market may receive scores greater or lower than 1.
For a full list of both positively and negatively corelated stocks visit InfoWARE Market Data Terminal
- On InfoWARE Market Data Terminal <BANL> <GO>
- On InfoWARE Finance Mobile App ( Android , iPhone & iPad and Windows 10)
| Symbol | DivYield | PE | EPS | Beta | %ChgYTD | ASIYTDReturn | BetaDiff |
|---|---|---|---|---|---|---|---|
| HONYFLOUR | 1.40 | 16.28 | 0.31 | 0.99 | 220.09 | 43.19 | 0.01 |
| CAVERTON | 5.52 | 1.15 | 1.57 | 0.98 | 161.57 | 43.19 | 0.02 |
| ROYALEX | 7.81 | 0.00 | 0.00 | 0.96 | 111.82 | 43.19 | 0.04 |
| CORNERST | 5.28 | 8.62 | 0.35 | 0.93 | 56.57 | 43.19 | 0.07 |
| VERITASKAP | 4.17 | 48.77 | 0.02 | 0.88 | 44.97 | 43.19 | 0.12 |
| UNIVINSURE | 0.00 | 0.00 | 0.00 | 0.83 | 54.17 | 43.19 | 0.17 |
| FTNCOCOA | 1.60 | 0.00 | 0.00 | 0.79 | 219.15 | 43.19 | 0.21 |
| NB | 3.79 | 16.95 | 1.60 | 0.79 | 139.38 | 43.19 | 0.21 |
| MAYBAKER | 3.75 | 58.94 | 0.14 | 0.78 | 81.38 | 43.19 | 0.22 |
| UNILEVER | 2.81 | 67.09 | 0.40 | 0.75 | 105.56 | 43.19 | 0.25 |
African Markets
| Name | LClose | Change | %Chg |
|---|---|---|---|
| BRVM Stock Exchange | 331.11 | 2.14 | 0.65 |
| Egyptian Exchange | 37,097.37 | 3.71 | 0.01 |
| Nairobi Securities Exchange | 173.75 | -2.54 | -1.44 |
| Tunis Stock Exchange | 12,298.61 | -23.41 | -0.19 |
Nigeria Market Indexes
| Symbol | LClose | %Chg | WTD% | MTD% | QTD% | YTD% | MktCap | Trades |
|---|---|---|---|---|---|---|---|---|
| ASI | 147,742.20 | 0.02 | 0.02 | 3.33 | 3.33 | 43.19 | 21,781 | |
| NGX30 | 5,393.45 | 0.07 | 0.07 | 3.36 | 3.36 | 41.38 | 12,508 | |
| NGXAFRBVI | 3,519.69 | -0.06 | -0.41 | -0.84 | -0.84 | 41.88 | 4,699 | |
| NGXAFRHDYI | 22,049.30 | 0.41 | -0.37 | -0.95 | -0.95 | 29.49 | 5,865 | |
| NGXASEM | 1,392.88 | 0.00 | 0.00 | -9.44 | -9.44 | -12.05 | 6 | |
| NGXBNK | 1,514.99 | -0.15 | -0.52 | -0.12 | -0.12 | 39.32 | 5,034 | |
| NGXCG | 4,142.78 | -0.14 | -0.47 | 2.27 | 2.27 | 46.43 | 11,518 | |
| NGXCNSMRGDS | 3,443.65 | 0.09 | 0.18 | 1.80 | 1.80 | 98.55 | 2,957 | |
| NGXCOMMDTY | 1,170.42 | 0.00 | 0.00 | 4.33 | 4.33 | 17.04 | ||
| NGXGROWTH | 15,279.27 | -0.18 | -0.22 | 1.38 | 1.38 | 96.83 | 244 | |
| NGXINDUSTR | 5,347.60 | 0.08 | 0.38 | 5.52 | 5.52 | 49.72 | 1,889 | |
| NGXINS | 1,295.30 | -0.13 | 0.88 | 8.29 | 8.29 | 64.76 | 1,555 | |
| NGXLOTUSISLM | 12,389.21 | 0.10 | 0.11 | 4.36 | 4.36 | 77.81 | 4,009 | |
| NGXMAINBOARD | 7,124.86 | 0.02 | 0.07 | 1.14 | 1.14 | 42.38 | 15,929 | |
| NGXMERIGRW | 10,025.49 | -0.77 | -1.57 | 1.24 | 1.24 | 53.69 | 3,460 | |
| NGXMERIVAL | 13,571.64 | -0.12 | -0.52 | 1.52 | 1.52 | 30.12 | 5,932 | |
| NGXOILGAS | 2,659.47 | 0.09 | 0.00 | 5.28 | 5.28 | -1.91 | 315 | |
| NGXPENBRD | 2,744.12 | -0.03 | -0.12 | 3.51 | 3.51 | 49.82 | 17,827 | |
| NGXPENSION | 6,878.47 | 0.09 | -0.26 | 2.09 | 2.09 | 51.71 | 13,854 | |
| NGXPREMIUM | 14,777.37 | 0.04 | -0.05 | 7.93 | 7.93 | 51.83 | 5,608 | |
| NGXSOVBND | 665.94 | 0.49 | 0.49 | 1.32 | 1.32 | 10.71 | 0 |
For more detailed analysis,
- On InfoWARE Market Data Terminal <MKTINS> <GO>
- On InfoWARE Finance Mobile App ( Android, iPhone & iPad and Windows 10) , "Market Indexes"
Find the topic interesting? Will like to comment? Contact Us at solutions@infowarelimited.com
Top News

Chart Of The Day - ASI Chart Vs ASI Advance Decline Line (YTD) (15-Oct-2025 15:17:10.151)
InfoWARE AI Analyst Daily Market Report: 15-Oct-2025

[XNSA]>> REINSTATEMENT OF ECL ASSET MANAGEMENT LIMITED
[VETBANK]>> DAILY INDICATIVE PRICES
[XNSA]>> TIMELY NOTIFICATION AND PRIOR APPROVAL OF CORPORATE CHANGES
[XNSA]>> NGX FIXED INCOME INDICATIVE PRICE LIST FOR OCT 15, 2025
[SIAMLETF40]>> DAILY INDICATIVE SERVICE
[XNSA]>> CORDROS MILESTONE FUNDS' BID & OFFER PRICES
[XNSA]>> COUNTDOWN BEGINS - 29TH ANNUAL STOCKBROKERS CONFERENCE
[XNSA]>> AELP CAPACITY BUILDING & ASSDA FORUM
[XNSA]>> DELISTING OF SMART PRODUCTS PLC AND MIGRATION OF JULI PLC TO GROWTH BOA
Chart Of The Day - ASI Chart Vs ASI Advance Decline Line (YTD) (14-Oct-2025 15:07:09.195)
InfoWARE AI Analyst Daily Market Report: 14-Oct-2025
[MERVALUE]>> DAILY INDICATIVE PRICES
[XNSA]>> RESIGNATION OF A DIRECTOR (NIGERIAN STOCKBROKERS LIMITED)
[XNSA]>> DAILY INDICATIVE PRICES
[XNSA]>> NGX FIXED INCOME INDICATIVE PRICE LIST FOR OCT 14, 2025
[XNSA]>> COUNTDOWN BEGINS: JUST ONE DAY TO THE 29TH ANNUAL STOCKBROKERS CONFEREN
[SIAMLETF40]>> DAILY INDICATIVE PRICES
[XNSA]>> UPDATED: PROPOSED RIGHTS ISSUE PRESCO PLC
[XNSA]>> CORDROS MILESTONE FUNDS' BID & OFFER PRICES
[XNSA]>> CLOSING GONG CEREMONY BY ZENITH BANK PLC
[XNSA]>> UPDATED- SAVE THE DATE: 29TH ANNUAL STOCKBROKERS CONFERENCE
[XNSA]>> AELP CAPACITY BUILDING & ASSDA FORUM
[XNSA]>> DELISTING OF SMART PRODUCTS PLC AND MIGRATION OF JULI PLC TO GROWTH BOA
Chart Of The Day - ASI Chart Vs ASI Advance Decline Line (YTD) (13-Oct-2025 15:09:57.318)
InfoWARE AI Analyst Daily Market Report: 13-Oct-2025
[XNSA]>> CORDROS MILESTONE FUNDS' BID & OFFER PRICES
[XNSA]>> PRESCO PLC: PROPOSED RIGHTS ISSUE
[XNSA]>> RESIGNATION OF A DIRECTOR
Get IDIA - the stock trading app for the modern investor
Solutions by Business
Product Suites
Company
Contacts
- 8th Floor,
- South Atlantic Petroleum Towers,
- 1 Adeola Odeku Street,
- Victoria Island,
- Lagos, Nigeria.
- Email: solutions@infowarelimited.com
Follow Us
 |
 |
 |
 |