


InfoWARE AI Analyst Daily Market Report: 14-Oct-2025 | InfoWARE Finance
Get IDIA - the stock trading app for the modern investor


InfoWARE AI Analyst Daily Market Report: 14-Oct-2025
(Source: InfoWARE Terminal, Date: 14-Oct-2025)
Dear Investor,
NGX Daily Market Summary – Tuesday, October 14, 2025
Market Overview
The Nigerian equities market ground to a virtual standstill today, with the NGX All Share Index (ASI) parking at 147,717.23, nearly unchanged (0.00%). YTD returns hold at a robust 43.16%, underscoring a resilient underlying uptrend despite a stagnant session. Activity levels, however, told a different, more vibrant story: market turnover surged by 58.03% to ₦17.32B and total volume ballooned to 495M shares, up over 27% from the prior day. Today's action was marked by a mixed breath (advancers vs. decliners ratio of 0.78x), with sector and stock-specific volatility dictating direction.
- Top gainer: VETIVA S & P NIGERIA SOVEREIGN BOND ETF (VSPBONDETF) up 14.29% at ₦240.00
- Top loser: GREENWICH ASSET ETF (GREENWETF) down 9.09% at ₦360.00
Market Breadth & Volume Trends
-
Market breadth: Weak at 0.78x (28 advancers, 36 decliners), indicating moderate downward bias despite flat index close.
- Volume traded increased for 67 companies, while 71 saw decreased volumes, confirming selective interest.
- Turnover spike: 58.03% jump in total value traded to ₦17.32B signals institutional re-engagement or large block trades.
- Unusual volume: Notable surges seen in TANTALIZER (+648.60%), WAPCO (+229.57%), CHAMS (+113.81%), and MTNN (+120.42%) versus respective 90-day averages, reflecting sector-rotational plays and possible liquidity hunts.
Highlights – Top 5 Gainers & Losers
| Stock | % Change | RSI | MACD | Volatility | PE |
|---|---|---|---|---|---|
| VSPBONDETF | 14.29% | 49.1 | -5.43 | 0.53 | N/A |
| GREENWETF | 9.09% | 65.0 | 11.85 | 0.78 | N/A |
| REGALINS | 8.82% | 43.1 | 0.04 | 0.94 | 4.35 |
| PRESTIGE | 6.71% | 47.1 | -0.01 | 0.35 | 10.49 |
| WAPIC | 6.45% | 49.4 | -0.04 | 0.65 | 72.55 |
| AUSTINLAZ | -7.94% | 56.1 | 0.14 | 0.72 | 0.00 |
| DEAPCAP | -6.67% | 55.1 | 0.03 | 0.62 | 188.84 |
| FIDSON | -6.67% | 53.3 | 0.50 | 0.24 | 22.54 |
| CAVERTON | -6.35% | 53.0 | 0.07 | 0.69 | 1.15 |
| BERGER | -5.92% | 53.2 | 0.86 | 0.64 | 14.18 |
- ETF volatility: ETFs (VSPBONDETF and GREENWETF) are dominating both top gainers and losers today—suggesting underlying fixed income or liquidity shifts.
- Insurance names: REGALINS, PRESTIGE, and WAPIC feature among gainers, pointing to sectorwide flows.
- Losers: AUSTINLAZ and DEAPCAP see above-average losses with no significant deterioration in RSI, suggesting potential reversal zones if fresh buyers emerge.
Key Insights and Predictions
- Turnover increase: The sharp rise in turnover, primarily concentrated in a few large, institutionally traded names (e.g., DANGCEM, MTNN, ZENITHBANK), hints at strategic positioning, possibly ahead of earnings or macro events. Sustained high turnover may lift volatility and provide trading opportunities if confirmed by consequent price action.
- Breadth divergence: Despite the flat index, more decliners than advancers and mixed individual stock volumes hint at hidden distribution, particularly outside today's top institutional flows.
-
Unusual volumes:
- TANTALIZER traded volume up nearly +649% vs 90-day average, yet price ticked down only -0.85% — suggests aggressive supply absorption; watch for directional break soon.
- WAPCO (+229%) and CHAMS (+114%) both saw strong volume and mild negative price action, signaling possible institutional rotations rather than panic selling.
- MTNN pulling in >5M shares at flat pricing (120% above average volume), a clue that big block trades are being absorbed without price impact (potential underlying support).
-
YTD Gainers/Laggards:
Top 5 YTD Gainers YTD Return SOVRENINS 186.18% CUSTODIAN 157.31% TRIPPLEG 142.22% COMPUTER WAREHOUSE GROUP (CWG) 152.35% STANBIC 98.28%
Top 5 YTD Losers YTD Return REGALINS -4.52% STERLINGNG -1.91% MEYER -9.85% NEWGOLD ETF -10.17% TIP -7.53% - SOVRENINS, CUSTODIAN, TRIPPLEG – outstanding multi-month momentum; yet only CUSTODIAN and SOVRENINS show healthy RSI—no overbought signals (ranging 50s–60s).
- REGALINS – YTD loser but among today's top gainers, possibly short covering or bounce attempt.
-
Bullish and Bearish Momentum:
-
Bullish crossovers (above 15DMA): PRESTIGE, CUSTODIAN, JAPAULGOLD.
- CUSTODIAN is compelling: robust YTD gain (157.31%), above its 15DMA, and strong dividend yield. RSI at a comfortable neutral. Suggests trend continuation.
-
Bearish crossovers (below 15DMA): BERGER, CAVERTON, DEAPCAP, FIDSON, AUSTINLAZ, TIP, DANGSUGAR, UCAP, FCMB, ROYALEX, MBENEFIT, LINKASSURE, LIVESTOCK.
- Berger and Fidson are notable: significant price declines, both with RSI above 50 – room for further downside unless sharp reversal appears shortly.
- FIDSON experienced a steep drop (-6.67% today), below 15DMA and MACD approaching potential bearish signal.
-
Bullish crossovers (above 15DMA): PRESTIGE, CUSTODIAN, JAPAULGOLD.
- RSI - Overbought/Oversold: None of the immediate top movers show extreme RSI values (i.e., >70 or <30), indicating further move potential both ways, with few imminent mean-reversion threats.
- Divergences: Several stocks in both gainers and losers lists are also in the YTD weakest/strongest tables, indicating short-term reversals or mean-reversion attempts (e.g., REGALINS).
Contrarian Signals
- REGALINS: Despite being among the top YTD losers (-4.52% YTD), it posted a strong rebound today (+8.82%). RSI climbs, though still below 50—suggests potential for a multi-day rally if buying persists.
- GREENWETF: Delivered both high momentum (RSI 64.9) and dramatic price swings (+9% today, but also in losers table recently). MACD highly positive, but volatility up, so caution advised—momentum works until it doesn’t, watch for reversal triggers.
- AUSTINLAZ, FIDSON, CAVERTON, BERGER: All experienced sharp declines despite middle-of-the-road RSI readings and no extreme MACD levels—one or more of these may soon see bottom fishers test the lows.
Sector Heatmaps & Institutional Activity
| Sector | Key Movers | % Chg | Activity | Comment |
|---|---|---|---|---|
| Insurance | REGALINS, PRESTIGE, WAPIC | +6%–8% | Rising | Broad-based buying; sector rotation evident |
| Building Materials | DANGCEM, WAPCO, BERGER | Flat to +0.2% | High (Instit.) | Selective -- DANGCEM block trades, BERGER weak, WAPCO heavy volume |
| Oil & Gas | OANDO, ARADEL | -1.2% | Mixed | OANDO heavy volume, flat; watch for upcoming break |
| Telecoms | MTNN | Flat | Heavy | Strong institutional trade, price static |
| Financials | ACCESSCORP, ZENITHBANK, UCAP | Mixed | Very Active | Heavy rotation; ACCESSCORP & ZENITH attract both segments |
- Institutional flows: Highest in DANGCEM, ZENITHBANK (over 20% institutional value share), MTNN, ACCESSCORP, and ARADEL. These names dominate total trade value and volume for the day.
- Retail hotspots: UBA, ACCESSCORP, and GTCO led in retail activity, revealing retail's preference for liquid, well-known banks.
Dividend-Beta Matrix: Defensive Playbook
| Stock | Dividend Yield | Beta | Risk Score | Note |
|---|---|---|---|---|
| AFRIPRUD | 1.27% | 0.64 | Low | Reliable yield; low β = defensive |
| REGALINS | 6.52% | 0.47 | Low | High yield, rebounding; but erratic earnings, high risk of dividend cut |
| MBENEFIT | 3.28% | 1.27 | High | High yield but volatile |
| FCMB | 5.62% | 1.17 | Medium-High | Attractive yield but momentum negative |
| ZENITHBANK | 2.25% | 1.20 | Medium | Top institutional favorite, steady |
- Defensive positioning: Names like AFRIPRUD and REGALINS present low-beta, high-yield profiles for risk-averse investors.
- Caveat: Some high yields (REGALINS, MBENEFIT) are linked to volatile earnings or weak price trends—monitor dividend sustainability.
Institutional Clustering Alerts
- ZENITHBANK: 20.17% of institutional trade value share—reflects strong buy or rotation-in by large players; signals short-term support or pre-positioning ahead of potential market events or results.
- DANGCEM and MTNN: Multiple block trades, nearly all via institutional books. May provide liquidity for index trackers and suggest underlying confidence in these bellwethers.
High Dividend Yield & Momentum Crossovers
- CUSTODIAN: Positive crossover above 15DMA, high YTD gain, decent dividend yield. Suitable for both growth and income-focused investors.
- FCMB: Despite high dividend yield (5.62%), crosses below the 15DMA with bearish momentum; avoid fresh positions until reversal signaled.
Trading Playbook & Cautions
- Focus on Insurance and Building Materials sectors for short-term upswings based on broad participation and positive momentum (especially PRESTIGE, CUSTODIAN).
- Closely monitor unusually high-volume stocks such as TANTALIZER and MTNN for breakout or support-failure setups.
- Watch YTD laggards posting gains (e.g., REGALINS) for mean-reversion plays, but mind stop-loss levels given historical underperformance.
- Caution on bearish crossovers (e.g., BERGER, FIDSON, AUSTINLAZ): if downtrends persist, short-term trading only.
Top 5 YTD Gainers and Losers (YTD % Change)
| Top Gainers | % Chg YTD |
|---|---|
| SOVRENINS | 186.18% |
| CUSTODIAN | 157.31% |
| TRIPPLEG | 142.22% |
| CWG | 152.35% |
| STANBIC | 98.28% |
| Top Losers | % Chg YTD |
|---|---|
| REGALINS | -4.52% |
| STERLINGNG | -1.91% |
| MEYER | -9.85% |
| NEWGOLD | -10.17% |
| TIP | -7.53% |
Market Activity & Trade Summaries
- Institutional dominance: Institutions accounted for 89.41% of trade value and 66.48% of volumes, but only 39.30% of trade count—signaling bigger ticket block activity and potential portfolio rebalancing.
- Retail prevalence: 60.7% of trades (by count) but only 10.6% of value; continued retail preference for highly liquid, low-priced banking stocks (UBA, ACCESSCORP, MTNN, ZENITHBANK, GTCO).
| Top 5 Traded by Institutional Investors | Main Dynamics | |
|---|---|---|
| DANGCEM | ₦2.9B | Key index mover; high institutional trust |
| MTNN | ₦2.4B | High conviction, little price change |
| ACCESSCORP | ₦664M | Dual interest: retail & institutional |
| ZENITHBANK | ₦1.2B | Core sector play, block flows |
| ARADEL | ₦1.0B | Oil & Gas block play |
| Top 5 Traded by Retail Investors | Main Dynamics | |
|---|---|---|
| UBA | ₦91.3M | Liquid; retail speculative |
| ACCESSCORP | ₦127.6M | Bridging both trading camps |
| MTNN | ₦66.0M | Big retail orders, but dwarfed by institutional flows |
| ZENITHBANK | ₦96.4M | Retail participants jump in after institutions |
| GTCO | ₦66.9M | Retail momentum chasing |
- Patterns: Top names (MTNN, ACCESSCORP, ZENITHBANK) are repeated in both retail and institutional top 5—consensus trades, potential for sharp moves if sentiment reverses.
- Sectoral conclusion: Institutional flows focus on heavyweights and index names, retail chases liquidity and recent momentum.
Summary & Takeaways
- Short-term traders: Look for breakouts in high-volume, high-momentum stocks (TANTALIZER, WAPCO, MTNN). Lean into insurance sector.
- Medium-term investors: Stay with sector leaders showing bullish crossovers, but rebalance away from names experiencing persistent bearish momentum.
- Contrarians: REGALINS and other bounce-back laggards may offer high-reward entries, cautiously.
- Defensives: Focus on high-yield, low-beta names for capital protection, but verify dividend sustainability.
- Institutional watch: Heavy clustering (ZENITHBANK, MTNN, DANGCEM) may prelude sharp moves if supported by news/earnings.
|
Top ASI Gainers Over Last 5 Trading Days
|
Top ASI Losers Over Last 5 Trading Days
|
For more detailed analysis, on InfoWARE Market Data Terminal <NSEPERF> <GO>
On InfoWARE Finance Mobile App (Android, iPhone & iPad, Windows Phone and Windows 8/10), "Top Gainers & Losers"
VETIVA S & P NIGERIA SOVEREIGN BOND ETF (VSPBONDETF) topped the advancers list closing at N240.00 with a gain of 14.29% followed by GREENWICH ASSET ETF (GREENWETF) which closed at N360.00 with a gain of 9.09%.
On the flip side AUSTIN LAZ & COMPANY PLC (AUSTINLAZ) and DEAP CAPITAL MANAGEMENT & TRUST PLC (DEAPCAP) topped the decliners log with a loss of -7.94% at a close of N2.90, and -6.67% to close the day at N1.68 respectively.
| Symbol | LClose | %Chg |
|---|---|---|
| VSPBONDETF | 240.00 | 14.29 |
| GREENWETF | 360.00 | 9.09 |
| REGALINS | 1.48 | 8.82 |
| LOTUSHAL15 | 100.00 | 7.81 |
| PRESTIGE | 1.75 | 6.71 |
For more detailed analysis,
- On InfoWARE Market Data Terminal <TOPG> <GO>
- On InfoWARE Finance Mobile App ( Android, iPhone & iPad and Windows 10) , "Top Gainers & Losers"
Currency Market
In the currency market, the Naira was unchanged against the dollar at 1 to 1NSE: Bull Signal - Price crossed above 15 Day MA
This signal implies these stocks are under buying pressure and the price might continue to rise and therefore positions should be monitored closely. Further suggested analysis include looking at the overall market (ASI) to see if the uptrend is market wide, sector wide or specific to the stock. Portfolio managers tend to use this as a signal to do more research to add to their positions or lock in some profits. Typically further analysis should be done using commands like PC and RV on the InfoWARE Market Data Terminal. Another command is ALERTS to set price triggers for possible exit or entry as necessary
For more detailed analysis,
- On InfoWARE Market Data Terminal <NSEPERF> <GO>
- On InfoWARE Finance Mobile App ( Android , iPhone & iPad and Windows 10) , "Top Gainers & Losers"
| Symbol | Price | %Chg | 15DMA | PE | EPS | DivY | MktCap | Vol | Trades | Value | LstTradeTime |
|---|---|---|---|---|---|---|---|---|---|---|---|
| PRESTIGE | 1.75 | 6.29 | 1.70 | 10.49 | 0.08 | 2.50 | 23.19B | 3.25M | 76.00 | 5.44M | 14-Oct-2025 15:03:41.707 |
| CUSTODIAN | 44.00 | 2.27 | 43.20 | 3.80 | 3.29 | 1.20 | 258.80B | 385.87K | 127.00 | 16.56M | 14-Oct-2025 15:03:41.960 |
| JAPAULGOLD | 2.66 | 2.26 | 2.64 | 0.19 | 12.01 | 0.90 | 16.66B | 6.98M | 173.00 | 18.29M | 14-Oct-2025 15:03:42.363 |
NSE: BEAR Signal - Price crossed below 15 Day MA
This signal implies these stocks are under selling pressure and the price might continue to slide and therefore positions should be monitored closely. Further suggested analysis include looking at the overall market (ASI) to see if the downtrend is market wide, sector wide or specific to the stock. If the overal market trend is upwards, then since these stocks are heading in the opposite direction, then further analysis should be done using commands like PC and RV on the InfoWARE Market Data Terminal. Another command is ALERTS to set price triggers for possible exit is necessar
For more detailed analysis,
- On InfoWARE Market Data Terminal <BEARM> <GO>
- On InfoWARE Finance Mobile App ( Android , iPhone & iPad and Windows 10)
| Symbol | Price | %Chg | 15DMA | PE | EPS | DivY | MktCap | Vol | Trades | Value | LstTradeTime |
|---|---|---|---|---|---|---|---|---|---|---|---|
| NGXAFRBVI | 3,521.65 | -0.36 | 3,526.43 | 3.14 | 35.50 | 0.00 | 0.00 | 72.26M | 5,668.00 | 3.57B | 14-Oct-2025 15:03:40.853 |
| TIP | 13.50 | -0.52 | 13.65 | 0.00 | 12.01B | 1.44M | 152.00 | 19.67M | 14-Oct-2025 15:03:41.020 | ||
| DANGSUGAR | 60.00 | -1.67 | 60.87 | 11.48 | 3.06 | 4.27 | 728.81B | 6.41M | 759.00 | 387.62M | 14-Oct-2025 15:03:41.607 |
| UCAP | 19.00 | -2.37 | 19.06 | 19.15 | 0.93 | 5.03 | 114.00B | 2.20M | 233.00 | 42.37M | 14-Oct-2025 15:03:41.803 |
| FCMB | 10.65 | -2.82 | 10.70 | 104.31 | 0.09 | 5.62 | 210.90B | 6.65M | 808.00 | 71.92M | 14-Oct-2025 15:03:42.577 |
| ROYALEX | 2.17 | -3.23 | 2.18 | 0.00 | 0.00 | 7.81 | 11.17B | 2.84M | 66.00 | 6.18M | 14-Oct-2025 15:03:41.400 |
| MBENEFIT | 3.72 | -3.49 | 3.77 | 5.43 | 0.11 | 3.28 | 74.63B | 7.51M | 158.00 | 28.63M | 14-Oct-2025 15:03:42.493 |
| LINKASSURE | 2.00 | -5.00 | 2.04 | 59.89 | 0.02 | 5.56 | 28.00B | 3.12M | 41.00 | 6.31M | 14-Oct-2025 15:03:42.310 |
| LIVESTOCK | 7.50 | -6.00 | 7.74 | 0.00 | 0.00 | 2.94 | 22.50B | 1.60M | 96.00 | 12.46M | 14-Oct-2025 15:03:42.140 |
| BERGER | 36.55 | -6.29 | 38.51 | 14.18 | 1.22 | 1.15 | 10.59B | 732.94K | 80.00 | 26.76M | 14-Oct-2025 15:03:42.610 |
| CAVERTON | 6.49 | -6.78 | 6.69 | 1.15 | 1.57 | 5.52 | 21.74B | 3.25M | 132.00 | 21.12M | 14-Oct-2025 15:03:42.567 |
| DEAPCAP | 1.68 | -7.14 | 1.70 | 188.84 | 0.01 | 13.76 | 2.52B | 1.98M | 67.00 | 3.36M | 14-Oct-2025 15:03:41.860 |
| FIDSON | 40.60 | -7.14 | 42.80 | 22.54 | 0.64 | 4.14 | 93.18B | 2.16M | 211.00 | 87.57M | 14-Oct-2025 15:03:42.730 |
| AUSTINLAZ | 2.90 | -8.62 | 3.05 | 0.00 | 0.00 | 0.00 | 3.13B | 450.49K | 37.00 | 1.34M | 14-Oct-2025 15:03:41.467 |
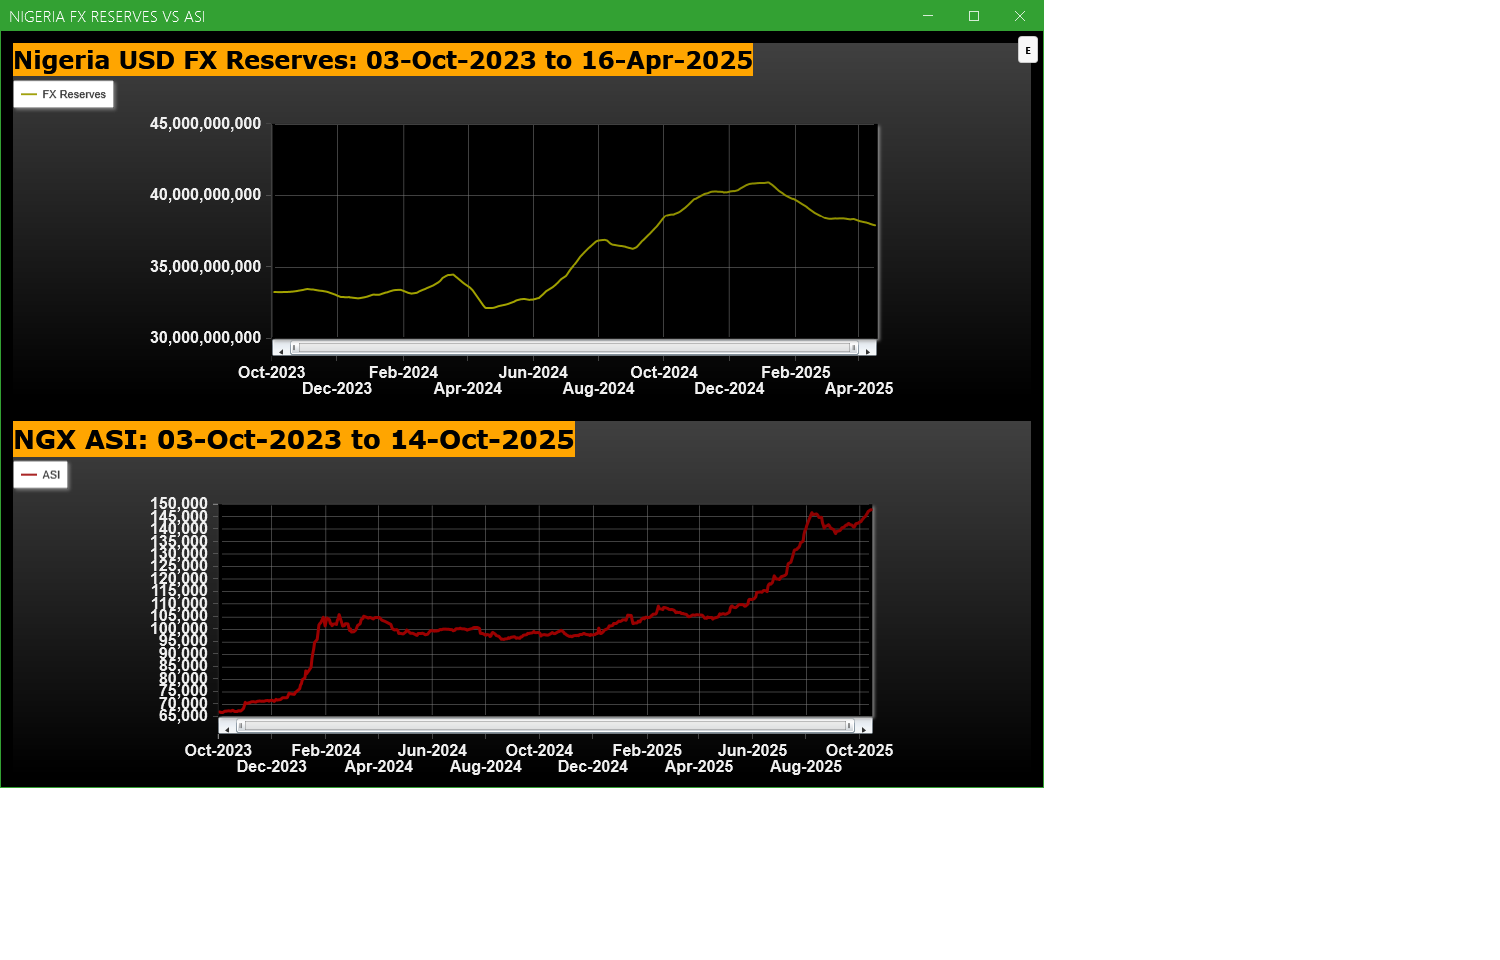
Economic Indicators - Nigeria FX Reserves Vs ASI Chart
Nigeria FX Reserves are assets held on reserve by CBN in foreign currencies. These reserves are used to back liabilities and influence monetary policy. Given the nature of the Nigeria economy, FX Reserves can appear to have an outsize influence on the economy and hence on the capital market. The chart below allows comparison of FX Reserves against the ASI to make investment decisions
For more detailed analysis,
- On InfoWARE Market Data Terminal <CI> <GO>
- On InfoWARE Finance Mobile App ( Android , iPhone & iPad and Windows 10) , "Research"
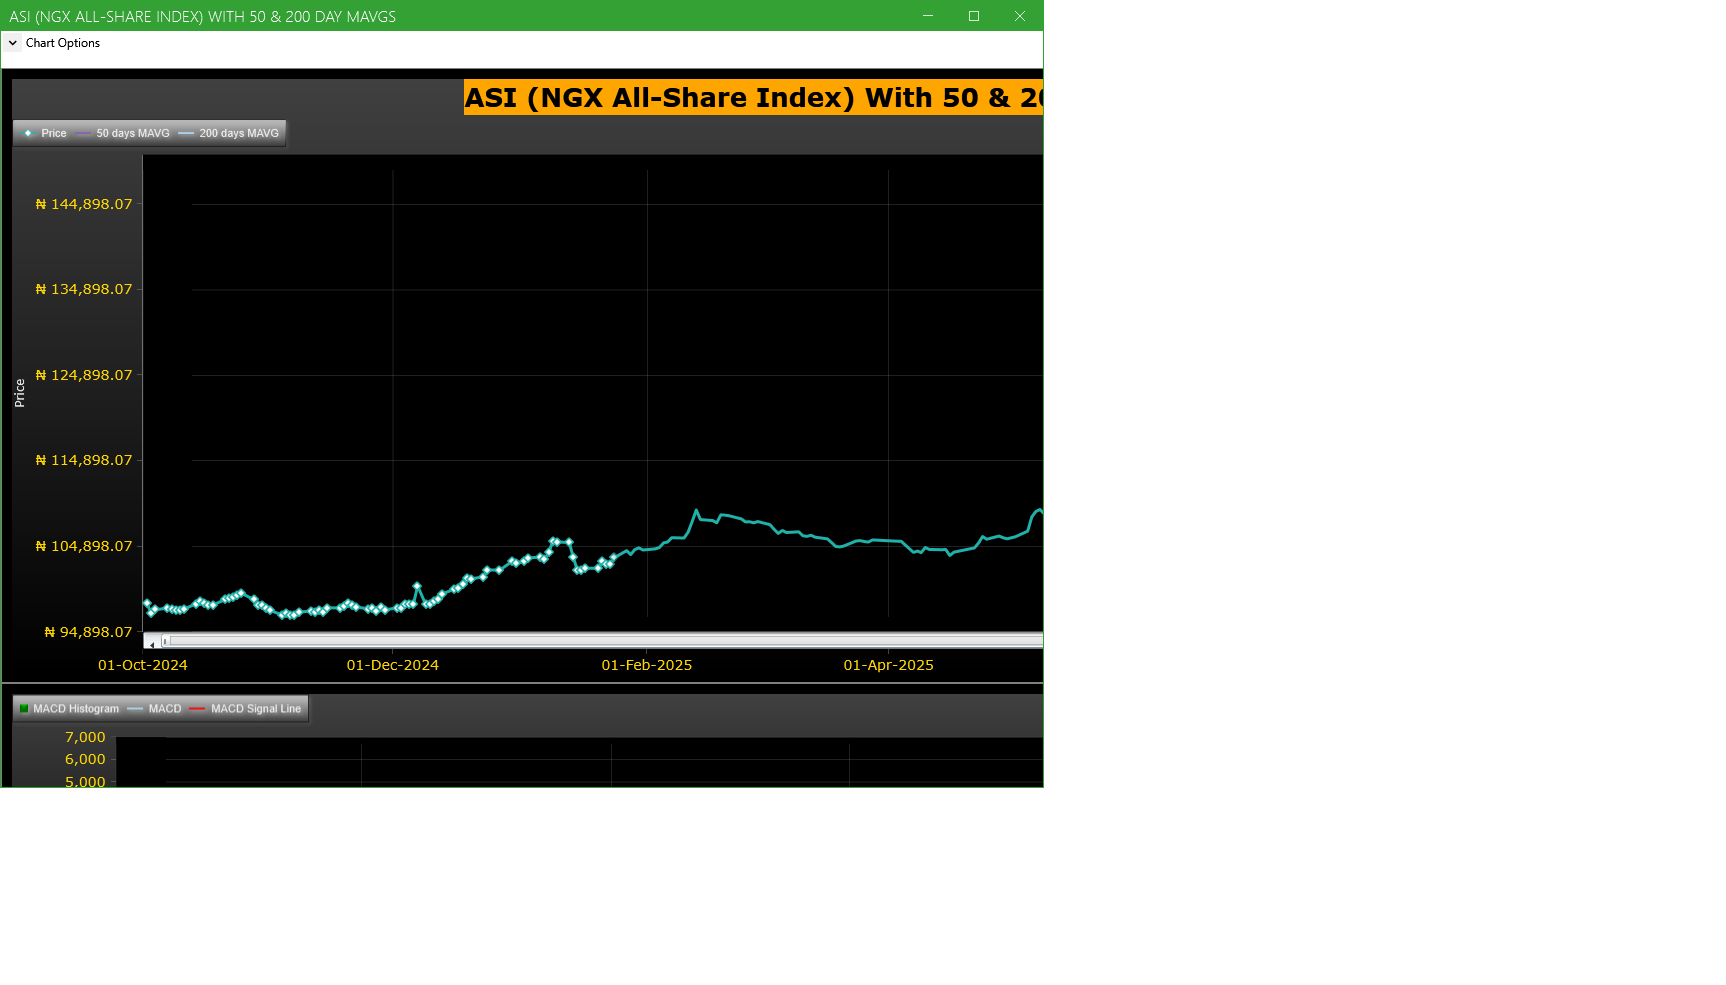
Market Trend - ASI (NGX All-Share-Index) With 50 & 200 Day MAvgs Chart
Technical traders typically use the 50 & 200 day moving averages to aid in choosing
where to enter or exit a position, which then causes these levels to act as strong
support or resistance. As a general guideline, if the price is above a moving average,
the trend is up. If the price is below a moving average, the trend is down.
It is important to note that critics of technical analysis say that moving averages act
as support and resistance because so many traders use these indicators to inform their
trading decisions. Also moving averages tend to work quite well in strong trending conditions
but poorly in choppy or ranging conditions.
Trading Strategies: Crossovers
Crossovers are one of the main moving average strategies. The first type is a price crossover,
which is when the price crosses above or below a moving average to signal a potential change
in trend. Another strategy is to apply two moving averages to a chart: one longer and one
shorter. When the shorter-term MA crosses above the longer-term MA, it is a buy signal, as
it indicates that the trend is shifting up. This is known as a golden cross. Meanwhile, when
the shorter-term MA crosses below the longer-term MA, it is a sell signal, as it indicates that
the trend is shifting down. This is known as a dead/death cross
For more detailed analysis,
- On InfoWARE Market Data Terminal <CI> <GO>
- On InfoWARE Finance Mobile App ( Android , iPhone & iPad and Windows 10) , "Research"
Unusual Volume: Volume traded is more than double the 90 day moving average (All exchanges; ASI & ASem). For more detailed analysis,
- On InfoWARE Market Data Terminal <UV> <GO>
- On InfoWARE Finance Mobile App ( Android , iPhone & iPad and Windows 10)
| Symbol | Name | Volume | 90DAvgVol | %VolChg | Price | LClose | %Chg | Trades | Value |
|---|---|---|---|---|---|---|---|---|---|
| CHAMS | CHAMS PLC | 37.36M | 17.47M | 113.81 | 4.00 | 4.18 | -4.31 | 670 | 157.75M |
| TANTALIZER | TANTALIZERS PLC | 36.69M | 4.90M | 648.60 | 2.34 | 2.36 | -0.85 | 107 | 85.25M |
| WAPCO | LAFARGE WAPCO PLC. | 17.51M | 5.31M | 229.57 | 129.30 | 129.00 | 0.23 | 339 | 2.27B |
| OANDO | OANDO PLC | 9.94M | 4.86M | 104.60 | 44.10 | 44.65 | -1.23 | 621 | 441.24M |
| MTNN | MTN NIGERIA PLC | 5.35M | 2.43M | 120.42 | 471.00 | 471.00 | 0.00 | 1,262 | 2.46B |
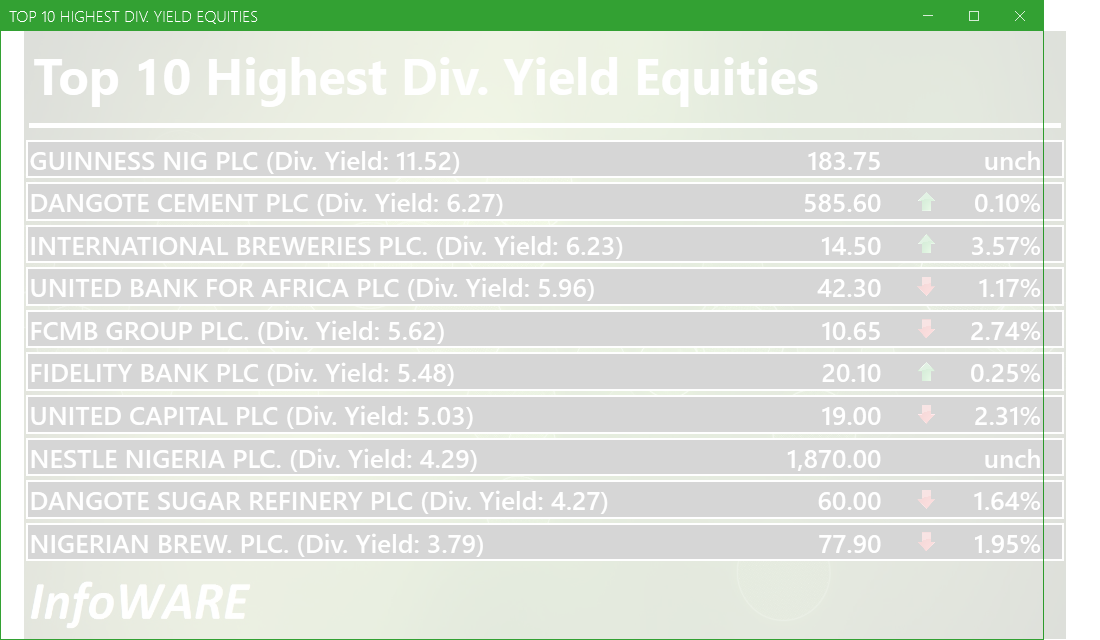
Investment Insights - High Div. Stocks
Dividend stocks distribute a portion of the company earnings to investors on a regular basis and they can a great choice for investors looking for regular income. As an investment or trading strategy, high dividend yield equities provide annual cash payments as against mostly capital gains in the price of a stock. The list in the table below represent the highest dividend paying stocks from the list of the most liquid stocks in the NSE top 30.
For more detailed analysis,
- On InfoWARE Market Data Terminal <HYIELD> <GO>
- On InfoWARE Finance Mobile App ( Android , iPhone & iPad and Windows 10) , "Research"
African Markets
| Name | LClose | Change | %Chg |
|---|---|---|---|
| BRVM Stock Exchange | 331.11 | 2.14 | 0.65 |
| Egyptian Exchange | 37,097.37 | 3.71 | 0.01 |
| Nairobi Securities Exchange | 173.75 | -2.54 | -1.44 |
| Tunis Stock Exchange | 12,298.61 | -23.41 | -0.19 |
Nigeria Market Indexes
| Symbol | LClose | %Chg | WTD% | MTD% | QTD% | YTD% | MktCap | Trades |
|---|---|---|---|---|---|---|---|---|
| ASI | 147,710.96 | 0.00 | 0.00 | 3.31 | 3.31 | 43.16 | 25,485 | |
| NGX30 | 5,389.65 | 0.00 | 0.00 | 3.29 | 3.29 | 41.28 | 14,941 | |
| NGXAFRBVI | 3,521.65 | -0.35 | -0.35 | -0.79 | -0.79 | 41.96 | 5,668 | |
| NGXAFRHDYI | 21,959.53 | -0.77 | -0.77 | -1.35 | -1.35 | 28.96 | 7,239 | |
| NGXASEM | 1,392.88 | 0.00 | 0.00 | -9.44 | -9.44 | -12.05 | 4 | |
| NGXBNK | 1,517.30 | -0.37 | -0.37 | 0.04 | 0.04 | 39.53 | 7,850 | |
| NGXCG | 4,148.53 | -0.33 | -0.33 | 2.41 | 2.41 | 46.63 | 13,060 | |
| NGXCNSMRGDS | 3,440.61 | 0.10 | 0.10 | 1.71 | 1.71 | 98.38 | 2,951 | |
| NGXCOMMDTY | 1,170.42 | 0.00 | 0.00 | 4.33 | 4.33 | 17.04 | 1,277 | |
| NGXGROWTH | 15,306.90 | -0.04 | -0.04 | 1.56 | 1.56 | 97.18 | 309 | |
| NGXINDUSTR | 5,343.58 | 0.30 | 0.30 | 5.44 | 5.44 | 49.61 | 2,410 | |
| NGXINS | 1,296.94 | 1.01 | 1.01 | 8.43 | 8.43 | 64.97 | 1,964 | |
| NGXLOTUSISLM | 12,376.60 | 0.01 | 0.01 | 4.26 | 4.26 | 77.62 | 4,793 | |
| NGXMAINBOARD | 7,123.27 | 0.05 | 0.05 | 1.12 | 1.12 | 42.35 | 17,203 | |
| NGXMERIGRW | 10,103.68 | -0.81 | -0.81 | 2.02 | 2.02 | 54.89 | 3,460 | |
| NGXMERIVAL | 13,587.95 | -0.40 | -0.40 | 1.65 | 1.65 | 30.27 | 6,156 | |
| NGXOILGAS | 2,656.96 | -0.09 | -0.09 | 5.19 | 5.19 | -2.00 | 1,443 | |
| NGXPENBRD | 2,745.00 | -0.09 | -0.09 | 3.54 | 3.54 | 49.87 | 20,597 | |
| NGXPENSION | 6,872.42 | -0.35 | -0.35 | 2.00 | 2.00 | 51.57 | 15,736 | |
| NGXPREMIUM | 14,772.17 | -0.09 | -0.09 | 7.89 | 7.89 | 51.78 | 7,502 | |
| NGXSOVBND | 662.67 | 0.00 | 0.00 | 0.82 | 0.82 | 10.16 | 0 |
For more detailed analysis,
- On InfoWARE Market Data Terminal <MKTINS> <GO>
- On InfoWARE Finance Mobile App ( Android, iPhone & iPad and Windows 10) , "Market Indexes"
Find the topic interesting? Will like to comment? Contact Us at solutions@infowarelimited.com
Top News

Chart Of The Day - ASI Chart Vs ASI Advance Decline Line (YTD) (14-Oct-2025 15:07:09.195)
InfoWARE AI Analyst Daily Market Report: 14-Oct-2025

[MERVALUE]>> DAILY INDICATIVE PRICES
[XNSA]>> RESIGNATION OF A DIRECTOR (NIGERIAN STOCKBROKERS LIMITED)
[XNSA]>> DAILY INDICATIVE PRICES
[XNSA]>> NGX FIXED INCOME INDICATIVE PRICE LIST FOR OCT 14, 2025
[XNSA]>> COUNTDOWN BEGINS: JUST ONE DAY TO THE 29TH ANNUAL STOCKBROKERS CONFEREN
[SIAMLETF40]>> DAILY INDICATIVE PRICES
[XNSA]>> UPDATED: PROPOSED RIGHTS ISSUE PRESCO PLC
[XNSA]>> CORDROS MILESTONE FUNDS' BID & OFFER PRICES
[XNSA]>> CLOSING GONG CEREMONY BY ZENITH BANK PLC
[XNSA]>> UPDATED- SAVE THE DATE: 29TH ANNUAL STOCKBROKERS CONFERENCE
[XNSA]>> AELP CAPACITY BUILDING & ASSDA FORUM
[XNSA]>> DELISTING OF SMART PRODUCTS PLC AND MIGRATION OF JULI PLC TO GROWTH BOA
Chart Of The Day - ASI Chart Vs ASI Advance Decline Line (YTD) (13-Oct-2025 15:09:57.318)
InfoWARE AI Analyst Daily Market Report: 13-Oct-2025
[XNSA]>> CORDROS MILESTONE FUNDS' BID & OFFER PRICES
[XNSA]>> PRESCO PLC: PROPOSED RIGHTS ISSUE
[XNSA]>> RESIGNATION OF A DIRECTOR
[VSPBONDETF]>> DAILY INDICATIVE PRICES
[XNSA]>> NGX FIXED INCOME INDICATIVE PRICE LIST FOR OCT 13, 2025
[XNSA]>> DAILY FUND PRICE SUBMISSION - FCMB ASSET MANAGEMENT LIMITED
[XNSA]>> EMERGING AFRICA DAILY MUTUAL FUND PRICES
[XNSA]>> NOTIFICATION OF PRICE ADJUSTMENT
[XNSA]>> CLOSING GONG CEREMONY BY ZENITH BANK PLC
[XNSA]>> UPDATED- SAVE THE DATE: 29TH ANNUAL STOCKBROKERS CONFERENCE
[XNSA]>> AELP CAPACITY BUILDING & ASSDA FORUM
[STANBICETF30]>> DAILY INDICATIVE PRICES
[XNSA]>> DELISTING OF SMART PRODUCTS PLC AND MIGRATION OF JULI PLC TO GROWTH BOA
InfoWARE AI Analyst Weekly Market Report: 10-Oct-2025
Get IDIA - the stock trading app for the modern investor
Solutions by Business
Product Suites
Company
Contacts
- 8th Floor,
- South Atlantic Petroleum Towers,
- 1 Adeola Odeku Street,
- Victoria Island,
- Lagos, Nigeria.
- Email: solutions@infowarelimited.com
Follow Us
 |
 |
 |
 |