


InfoWARE AI Analyst Daily Market Report: 13-Oct-2025 | InfoWARE Finance
Get IDIA - the stock trading app for the modern investor


InfoWARE AI Analyst Daily Market Report: 13-Oct-2025
(Source: InfoWARE Terminal, Date: 13-Oct-2025)
Dear Investor,
NGX Market Wrap – Monday, October 13, 2025
The Nigerian market kicked off the week with a modest rebound, as the NGX ASI climbed +0.50% to close at 146,988.04. Year-to-date returns remain robust at +43.16%, reinforcing the market’s relative outperformance versus most African and frontier peers. Despite mild currency headwinds (-0.43% for the Naira against the USD), investor sentiment held firm. Market turnover rose 4.92% from last session to ₦10.96 billion on higher volume (387.21M shares), while a breadth ratio of 1.11x was recorded (31 advancers vs. 28 decliners)—illustrating a slightly bullish undertone amid active trading. The insurance and real estate segments led the action, supported by sharp price moves and several technical crossovers.
Quick Insights & Trends
- Market Breadth: Advancers (31) outpaced decliners (28), reflecting positive sentiment but not overwhelmingly so. Volume was up in 85 companies and down in 55—a slightly more energetic session compared to recent trading days.
- Top Gainer: GREENWETF (+10.00%, ₦330.00) - RSI: 59.8 (neutral-bullish), MACD solidly positive (7.44 vs. -5.45 prior).
- Top Loser: MERVALUE (-10.00%, ₦158.40) - RSI: 35.7 (approaching oversold), negative MACD momentum.
- Unusual Volume: CONHALLPLC (+935% vs. average!), HMCALL (+549%), MTNN, UPDCREIT—institutional engagement and price action worth close monitoring.
- Sector/ETF Play: Strong showings in alternative investment products (ETFs, REITs) on both top gainers and unusual volume lists.
Top 5 Daily Gainers
| Stock Name | Symbol | %Change | Close | RSI | MACD |
|---|---|---|---|---|---|
| GREENWICH ASSET ETF | GREENWETF | +10.00% | ₦330.00 | 59.8 | 7.44 |
| MERISTEM VALUE ETF | MERVALUE | +10.00% | ₦158.40 | 35.7 | -10.32 |
| SOVEREIGN TRUST INSURANCE | SOVRENINS | +9.97% | ₦3.53 | 56.4 | 0.12 |
| REGENCY ALLIANCE INSURANCE | REGALINS | +9.68% | ₦1.36 | 54.7 | 0.07 |
| TRANSCORP POWER | TRANSPOWER | +8.92% | ₦342.00 | 53.8 | 5.27 |
Top 5 Daily Losers
| Stock Name | Symbol | %Change | Close | RSI | MACD |
|---|---|---|---|---|---|
| TRIPPLE GEE | TRIPPLEG | -9.92% | ₦5.45 | 61.0 | 0.24 |
| WEMA BANK | WEMABANK | -4.51% | ₦19.05 | 50.6 | -0.32 |
| LIVINGTRUST MORTGAGE | LIVINGTRUST | -3.85% | ₦5.00 | 49.5 | 0.25 |
| NIGERIAN EXCHANGE GROUP | NGXGROUP | -3.33% | ₦58.00 | 51.8 | 0.39 |
| CUTIX | CUTIX | -3.08% | ₦3.78 | 57.9 | 0.10 |
Deeper Insights & Possible Moves
- Turnover Impact: The 4.92% turnover rise is bullish and typical of the early week, suggesting institutional participation remains robust. Higher value and volume favor continuation of current trends especially in financials and select ETFs.
- Advancers vs. Decliners: Market breadth above 1.0 for the third consecutive day—while not overwhelming, does indicate underlying rotational strength. Advancers clustering in insurance, REITs, and alternative assets hint at a tactical risk-on rotation.
-
Unusual Volume Alerts:
- CONHALLPLC: +935% volume surge.
- HMCALL: +549% unusual activity, price up +6.80%, crossed above 15DMA—a potential short-term breakout.
- MTNN and UPDCREIT: Both saw institutional dominance—MTNN is flat, but this often precedes big directional moves.
- Real Estate & Insurance segments are disproportionately present among top unusual volume equities.
-
YTD Gainers vs. Losers Overlap:
- SOVRENINS, CAVERTON, DANGCEM—all strong YTD winners, with persistent momentum (see sparkline crossovers below).
- REGALINS, MERVALUE—notable for being both daily gainers or losers and among YTD worst. REGALINS is a rare case: +9.68% today but still +70.00% YTD (rebounding from prior sharp losses).
- TRANSCORP POWER continues uptrend with strong MACD and 15DMA > 50DMA scenario, but daily volatility suggests traders should deploy tight stops.
-
Bullish & Bearish Momentum Crossovers:
-
Bullish:
- HMCALL, UPDCREIT, AFRIPRUD—closed above 15DMA (see sparkline): HMCALL in particular has unusual volume, a technical buy signal, and potential for more momentum.
-
Bearish:
- REGALINS, ZENITHBANK, GTCO—closed below 15DMA, despite some seeing institutional interest (contrarian sign to watch).
- TRIPPLEG: Big one-day drop -9.92% and below 15DMA; traders should await stabilization before considering a rebound play.
-
Bullish:
Contrarian Signals (Conflicting Indicators Worth Watching)
-
ZENITHBANK (20.17% institutional trade value share):
- Closed below 15DMA (Bearish MA breakdown) but strong institutional accumulation—potential accumulation phase. RSI near neutral (48.3); traders should watch for reversal.
-
REGALINS:
- Closed below 15DMA and appears in both gainers and YTD losers—signal is mixed. Today’s rebound may be a short covering or relief bounce, not a trend reversal yet.
-
MERVALUE (ETF, -20.68% YTD):
- Big daily gain after being among biggest YTD losers and negative MACD/RSI. Volatility is high; not safe for conservative portfolios.
-
TRANSCORP POWER:
- High volatility, strong MACD, but 20-day rate of change is 0.0—potential bull trap if buying is not sustained.
Sector Heatmaps
| Sector | Bright Spots | %Movers (Sparkline 15D/50D) | Institutional % |
|---|---|---|---|
| Insurance/Financials | SOVRENINS, REGALINS, GUINEAINS, WAPIC | 💹 | 💹 | 💡 | 💡 | High (via CONHALLPLC) |
| Banking | ZENITHBANK, GTCO (inst. focus but bearish price) | ⬇️ | ⬇️ | Very High (top 2 by trade value) |
| Real Estate/REITs | UPDCREIT, HMCALL | 💹 | 💹 | Moderate/High |
| Telcos | MTNN | ⬇️ | Large blocks by both retail & inst. |
| ETF | GREENWETF, MERVALUE | 💹 | ⬇️ | Spotty |
Dividend-Beta Matrix (Defensive Opportunities)
| Stock | Dividend Yield | Beta | Technical Signal |
|---|---|---|---|
| AFRIPRUD | 1.27% | 0.64 | Above 15DMA (Bullish) |
| REGALINS | 6.52% | 0.47 | Below 15DMA (Bearish/rebound?) |
| LINKASSURE | 5.56% | 0.41 | Above 15DMA (Bullish) |
| WAPIC | 2.56% | 0.76 | Above 15DMA (Bullish) |
| ZENITHBANK | 2.25% | 1.20 | Below 15DMA (Bearish institutional cluster) |
Institutional Clustering Alerts
- ZENITHBANK: Comprising 20.17% of institutional trade value today—heavy institutional clustering, despite closing below 15DMA (contrarian signal for savvy observers).
- MTNN: Heavy institutional and retail trading, yet price unchanged—could signal large repositioning. Monitor for breakout.
- UPDCREIT, HMCALL: Surging institutional and retail activity as they cross 15DMA, hinting at mounting momentum.
YTD Top Gainers & Losers (where trends overlap, caution!)
| Top YTD Gainers | %ChgYTD | RSI | Today %Chg |
|---|---|---|---|
| SOVRENINS | +186.99% | 56.36 | +9.97% |
| CAVERTON | +171.76% | 52.96 | 0.00% |
| DANGCEM | +22.18% | 62.62 | +1.74% |
| EUNISELL | +128.33% | 80.17 | 0.00% |
| MECURE | +104.32% | 72.85 | 0.00% |
| GREENWETF | -38.20% | 59.79 | +10.00% |
| TRANSPOWER | -4.97% | 53.84 | +8.92% |
| Top YTD Losers | %ChgYTD | RSI | Today %Chg |
|---|---|---|---|
| REGALINS | +70.00% | 54.74 | +9.68% |
| MERVALUE | -20.68% | 35.72 | +10.00% |
| TRIPPLEG | +142.22% | 60.95 | -9.92% |
| LIVINGTRUST | +14.16% | 49.46 | -3.85% |
| VFDGROUP | -75.68% | 49.52 | -2.26% |
Trading Activity Analysis (Institutional vs Retail)
- Deal Flow: Institutions handled only 35.84% of trade count but a commanding 85.82% of value and 73.62% of volume. Retail dominated numerically but hunted for smaller ticket sizes and less impact.
-
Top 5 Institutional Favourites:
- ZENITHBANK (20.17%)
- MTNN
- ARADEL
- GTCO
- UBA
-
Top 5 Retail Favourites:
- MTNN
- ZENITHBANK
- UBA
- GTCO
- FCMB
- Correlation: Stocks with high institutional concentration—especially those crossing technical levels—are often harbingers of trend starts/stops. Beware ZENITHBANK and GTCO: the price is weak, but "smart" money is active.
Trader Suggestions & Cautions
-
Opportunities:
- Watch HMCALL, AFRIPRUD, and LINKASSURE for 15DMA breakouts with volume. These have momentum and low beta/dividend angle for safer swing trades.
- MTNN is on institutional radar—continual sideways price could be a coiled spring for a large directional breakout.
-
Caution:
- Widespread volatility in certain insurance and ETF names (REGALINS, MERVALUE) could deliver whipsaws; use tight stops.
- Top gainers with low RSI (MERVALUE) are vulnerable to profit-taking. Avoid chasing after big runs unless confirmed by further technicals.
- Defensive Play: Consider rotation towards AFRIPRUD, LINKASSURE, both with good dividend yields and positive short-term technical setups.
Last Week Recap (for context)
The Nigerian bourse finished last week on a relatively flat note after profit taking midweek, but the new week has started with a firmer tone as investors rotate into insurance, REITs, and select large caps. Turnover patterns signal institutions remain bullish in select banks, while retail is increasingly driving the insurance and telco volumes.
Summary: Hidden Insights and Final Thoughts
- Insurance sector dominates both top gainers and high unusual volume, supported by bullish momentum on several names.
- Institutional money clusters in banks and MTNN—with price/momentum divergence—pointing to potential inflection points.
- Several high-yield, low-beta stocks (e.g., AFRIPRUD, LINKASSURE) show technical strength—prime candidates for cautious bullish exposure.
- Sharp volume surges forecast short-term volatility: traders should use stops and remain nimble on illiquid or swingy insurance/ETF plays.
- Contrarian watch: Banks under institutional accumulation but bearishly postured—look for base-building/reversals.
- Technical Bulls: Play confirmed 15DMA breakouts—but note which ones are reinforced by volume and/or institutional flows.
Stay alert for cross-market rotation and do not chase runaway names without confirmation!
|
Top ASI Gainers Over Last 5 Trading Days
|
Top ASI Losers Over Last 5 Trading Days
|
For more detailed analysis, on InfoWARE Market Data Terminal <NSEPERF> <GO>
On InfoWARE Finance Mobile App (Android, iPhone & iPad, Windows Phone and Windows 8/10), "Top Gainers & Losers"
GREENWICH ASSET ETF (GREENWETF) topped the advancers list closing at N330.00 with a gain of 10.00% followed by MERISTEM VALUE EXCHANGE TRADED FUND (MERVALUE) which closed at N158.40 with a gain of 10.00%.
On the flip side LOTUS HALAL EQUITY ETF (LOTUSHAL15) and TRIPPLE GEE AND COMPANY PLC. (TRIPPLEG) topped the decliners log with a loss of -9.94% at a close of N92.76, and -9.92% to close the day at N5.45 respectively.
| Symbol | LClose | %Chg |
|---|---|---|
| GREENWETF | 330.00 | 10.00 |
| MERVALUE | 158.40 | 10.00 |
| SOVRENINS | 3.53 | 9.97 |
| REGALINS | 1.36 | 9.68 |
| TRANSPOWER | 342.00 | 8.92 |
| Symbol | LClose | %Chg |
|---|---|---|
| LOTUSHAL15 | 92.76 | -9.94 |
| TRIPPLEG | 5.45 | -9.92 |
| WEMABANK | 19.05 | -4.51 |
| LIVINGTRUST | 5.00 | -3.85 |
| NGXGROUP | 58.00 | -3.33 |
For more detailed analysis,
- On InfoWARE Market Data Terminal <TOPG> <GO>
- On InfoWARE Finance Mobile App ( Android, iPhone & iPad and Windows 10) , "Top Gainers & Losers"
Currency Market
In the currency market, the Naira fell 0.43%(-6.39) against the Dollar to settle at 1 to 1Investment Insights - Top 5 Gainers YTD
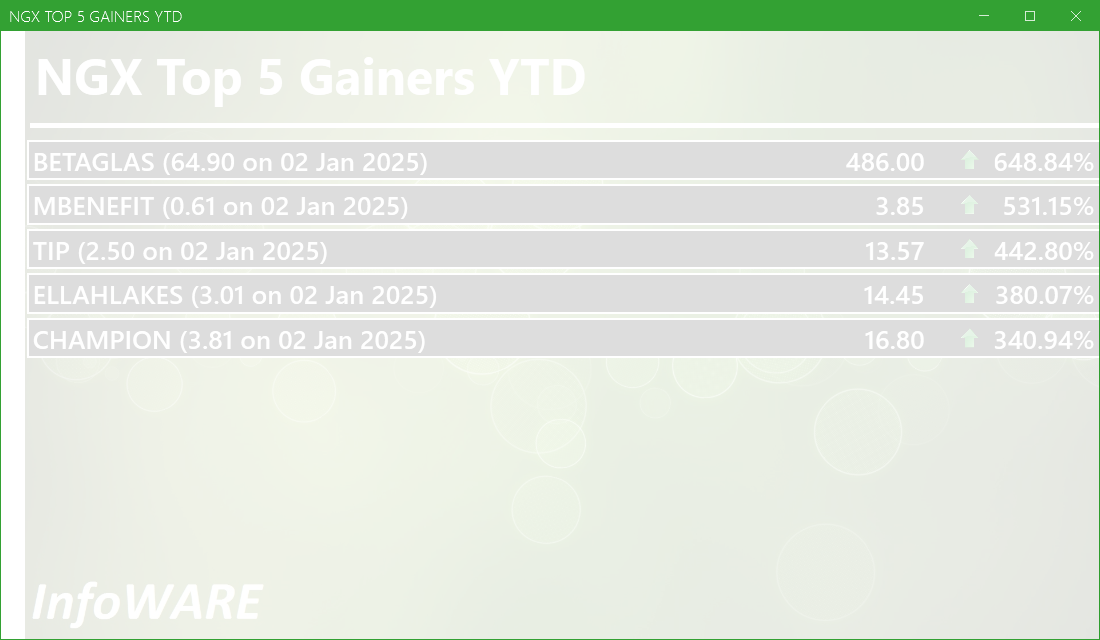
These stocks are the best performers whose price has risen faster than the market as a whole with the best returns year to date. Momentum investors believe that stocks that have outperformed the market will often continue to do so because the factors that caused them to outperform will not suddenly disappear. In addition, other investors seeking to benefit from the stock’s outperformance will often purchase the stock, further bidding its price higher and pushing the stock higher still
For more detailed analysis,
- On InfoWARE Market Data Terminal <T5YTD2> <GO>
- On InfoWARE Finance Mobile App ( Android , iPhone & iPad and Windows 10) , "Research"
NSE: Bull Signal - Price crossed above 15 Day MA
This signal implies these stocks are under buying pressure and the price might continue to rise and therefore positions should be monitored closely. Further suggested analysis include looking at the overall market (ASI) to see if the uptrend is market wide, sector wide or specific to the stock. Portfolio managers tend to use this as a signal to do more research to add to their positions or lock in some profits. Typically further analysis should be done using commands like PC and RV on the InfoWARE Market Data Terminal. Another command is ALERTS to set price triggers for possible exit or entry as necessary
For more detailed analysis,
- On InfoWARE Market Data Terminal <NSEPERF> <GO>
- On InfoWARE Finance Mobile App ( Android , iPhone & iPad and Windows 10) , "Top Gainers & Losers"
| Symbol | Price | %Chg | 15DMA | PE | EPS | DivY | MktCap | Vol | Trades | Value | LstTradeTime |
|---|---|---|---|---|---|---|---|---|---|---|---|
| FGSUK2033S6 | 100.00 | 7.90 | 98.86 | 0.00 | 0.00 | 880.00 | 3.00 | 648.16K | 13-Oct-2025 14:30:43.513 | ||
| HMCALL | 4.40 | 6.36 | 4.20 | 0.00 | 0.00 | 0.00 | 0.00 | 5.64M | 44.00 | 24.68M | 13-Oct-2025 14:30:15.277 |
| VETGOODS | 36.50 | 4.11 | 35.19 | 0.00 | 0.00 | 1.13K | 6.00 | 41.80K | 13-Oct-2025 14:30:39.530 | ||
| GUINEAINS | 1.49 | 4.03 | 1.47 | 66.79 | 0.01 | 1.96 | 9.15B | 2.65M | 138.00 | 3.77M | 13-Oct-2025 14:30:15.203 |
| UPDCREIT | 7.45 | 4.03 | 7.21 | 9.09 | 0.57 | 10.87 | 19.88B | 3.65M | 191.00 | 27.30M | 13-Oct-2025 14:30:29.673 |
| LINKASSURE | 2.10 | 3.81 | 2.05 | 59.89 | 0.02 | 5.56 | 29.40B | 11.19M | 98.00 | 22.76M | 13-Oct-2025 14:30:15.727 |
| ROYALEX | 2.24 | 3.57 | 2.19 | 0.00 | 0.00 | 7.81 | 11.53B | 3.30M | 79.00 | 7.29M | 13-Oct-2025 14:30:16.833 |
| VSPBONDETF | 210.00 | 3.26 | 207.63 | 0.00 | 0.00 | 1.22K | 1.00 | 256.62K | 13-Oct-2025 14:30:39.560 | ||
| WAPIC | 3.10 | 3.23 | 3.07 | 72.55 | 0.02 | 2.56 | 74.37B | 4.48M | 110.00 | 13.82M | 13-Oct-2025 14:30:17.897 |
| FIRSTHOLDCO | 31.50 | 1.59 | 31.07 | 0.00 | 0.00 | 10.46M | 379.00 | 326.54M | 13-Oct-2025 14:30:39.670 | ||
| AFRIPRUD | 14.90 | 0.00 | 14.86 | 19.57 | 0.61 | 1.27 | 29.80B | 592.29K | 137.00 | 8.87M | 13-Oct-2025 14:30:13.587 |
NSE: BEAR Signal - Price crossed below 15 Day MA
This signal implies these stocks are under selling pressure and the price might continue to slide and therefore positions should be monitored closely. Further suggested analysis include looking at the overall market (ASI) to see if the downtrend is market wide, sector wide or specific to the stock. If the overal market trend is upwards, then since these stocks are heading in the opposite direction, then further analysis should be done using commands like PC and RV on the InfoWARE Market Data Terminal. Another command is ALERTS to set price triggers for possible exit is necessar
For more detailed analysis,
- On InfoWARE Market Data Terminal <BEARM> <GO>
- On InfoWARE Finance Mobile App ( Android , iPhone & iPad and Windows 10)
| Symbol | Price | %Chg | 15DMA | PE | EPS | DivY | MktCap | Vol | Trades | Value | LstTradeTime |
|---|---|---|---|---|---|---|---|---|---|---|---|
| REGALINS | 1.36 | 8.82 | 1.61 | 4.35 | 0.11 | 6.52 | 9.07B | 2.10M | 62.00 | 2.85M | 13-Oct-2025 14:30:16.797 |
| ZENITHBANK | 68.00 | -0.74 | 68.73 | 3.33 | 13.30 | 2.25 | 2,134.96B | 21.10M | 1,714.00 | 1.44B | 13-Oct-2025 14:30:39.820 |
| GTCO | 94.00 | -1.06 | 94.10 | 7.49 | 7.10 | 1.88 | 2,766.53B | 11.06M | 1,363.00 | 1.04B | 13-Oct-2025 14:30:15.167 |
| VFDGROUP | 10.80 | -2.31 | 10.99 | 0.00 | 0.00 | 0.00 | 0.00 | 4.87M | 323.00 | 53.14M | 13-Oct-2025 14:30:39.407 |
| NGXGROUP | 58.00 | -3.45 | 59.13 | 0.00 | 0.00 | 2.73 | 113.92B | 340.88K | 79.00 | 19.87M | 13-Oct-2025 14:30:16.293 |
| TRIPPLEG | 5.45 | -11.01 | 5.77 | 215.00 | 0.01 | 5.32 | 2.70B | 315.82K | 29.00 | 1.72M | 13-Oct-2025 14:30:17.403 |
| FGSUK2027S3 | 75.00 | -17.33 | 84.87 | 0.00 | 0.00 | 20.00 | 1.00 | 15.00K | 13-Oct-2025 14:30:43.487 |
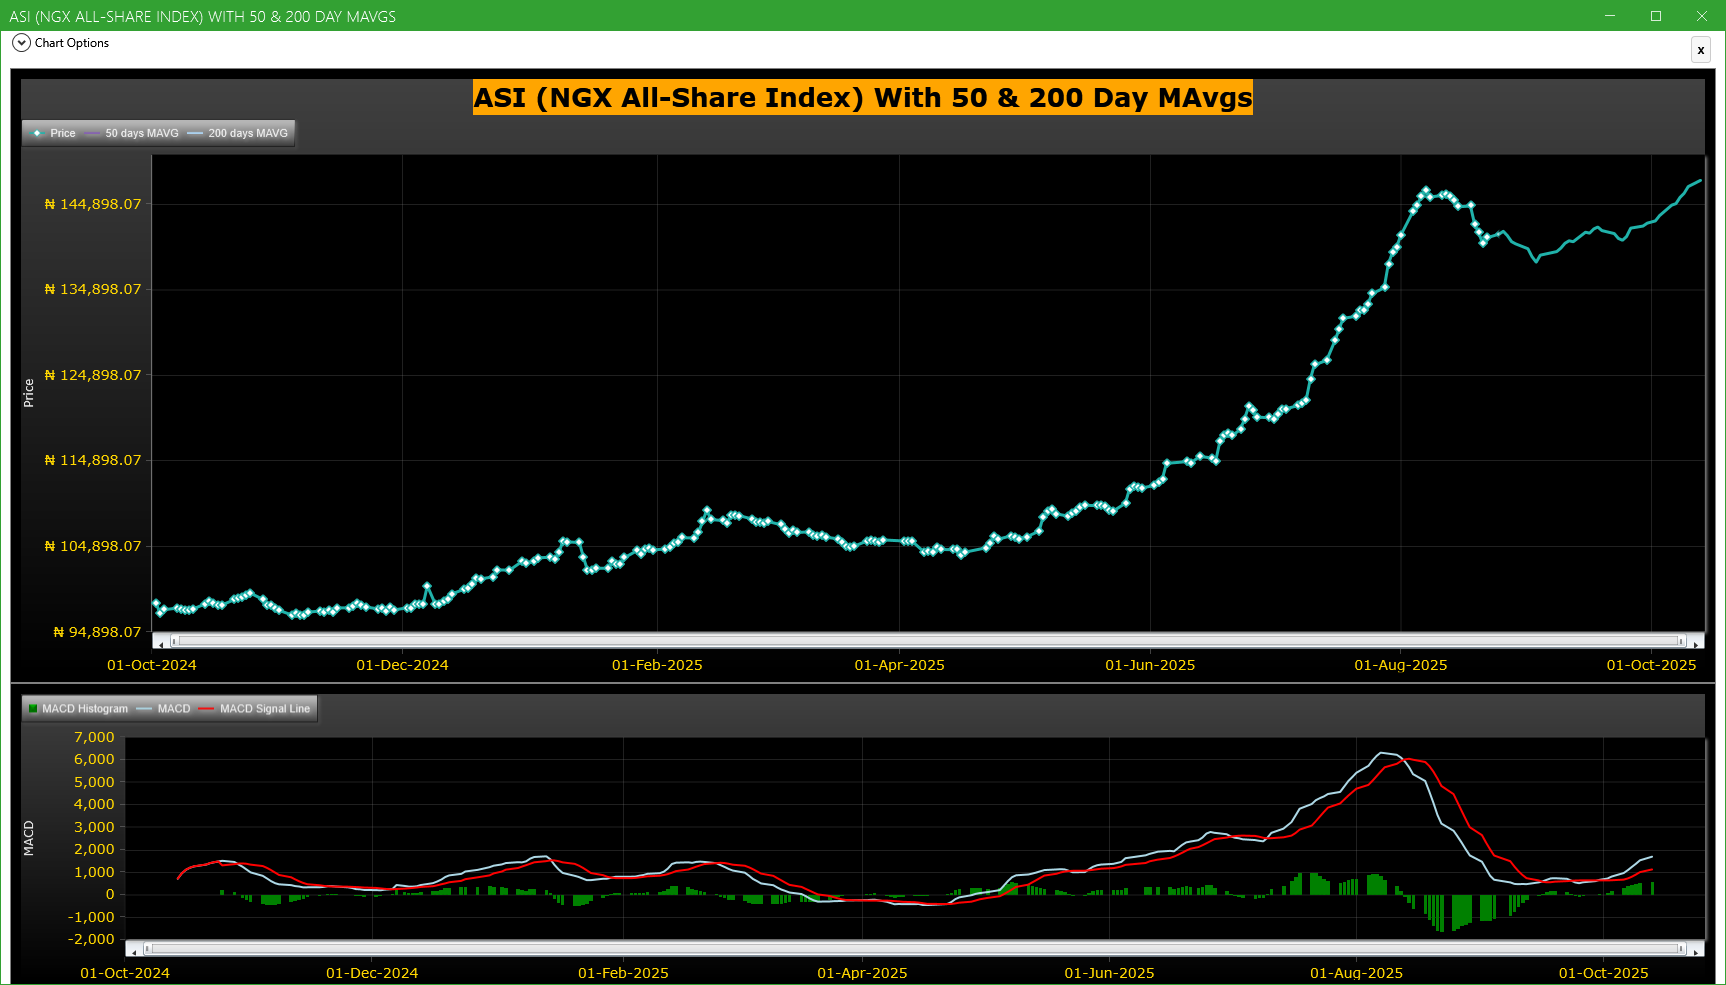
Market Trend - ASI (NGX All-Share-Index) With 50 & 200 Day MAvgs Chart
Technical traders typically use the 50 & 200 day moving averages to aid in choosing
where to enter or exit a position, which then causes these levels to act as strong
support or resistance. As a general guideline, if the price is above a moving average,
the trend is up. If the price is below a moving average, the trend is down.
It is important to note that critics of technical analysis say that moving averages act
as support and resistance because so many traders use these indicators to inform their
trading decisions. Also moving averages tend to work quite well in strong trending conditions
but poorly in choppy or ranging conditions.
Trading Strategies: Crossovers
Crossovers are one of the main moving average strategies. The first type is a price crossover,
which is when the price crosses above or below a moving average to signal a potential change
in trend. Another strategy is to apply two moving averages to a chart: one longer and one
shorter. When the shorter-term MA crosses above the longer-term MA, it is a buy signal, as
it indicates that the trend is shifting up. This is known as a golden cross. Meanwhile, when
the shorter-term MA crosses below the longer-term MA, it is a sell signal, as it indicates that
the trend is shifting down. This is known as a dead/death cross
For more detailed analysis,
- On InfoWARE Market Data Terminal <CI> <GO>
- On InfoWARE Finance Mobile App ( Android , iPhone & iPad and Windows 10) , "Research"
Unusual Volume: Volume traded is more than double the 90 day moving average (All exchanges; ASI & ASem). For more detailed analysis,
- On InfoWARE Market Data Terminal <UV> <GO>
- On InfoWARE Finance Mobile App ( Android , iPhone & iPad and Windows 10)
| Symbol | Name | Volume | 90DAvgVol | %VolChg | Price | LClose | %Chg | Trades | Value |
|---|---|---|---|---|---|---|---|---|---|
| CONHALLPLC | CONSOLIDATED HALLMARK INSURANCE PLC | 210.46M | 20.33M | 935.12 | 4.50 | 4.20 | 7.14 | 127 | 909.65M |
| CHAMS | CHAMS PLC | 43.96M | 17.65M | 149.04 | 4.18 | 4.30 | -2.79 | 825 | 191.63M |
| MTNN | MTN NIGERIA PLC | 5.69M | 2.35M | 142.44 | 471.00 | 471.00 | 0.00 | 1,887 | 2.62B |
| HMCALL | HALDANE MCCALL PLC | 5.64M | 869.38K | 548.74 | 4.40 | 4.12 | 6.80 | 44 | 24.68M |
| UPDCREIT | UPDC REAL ESTATE INVESTMENT TRUST | 3.65M | 1.62M | 125.07 | 7.45 | 7.15 | 4.20 | 191 | 27.30M |
Investment Insights - High Div. Stocks
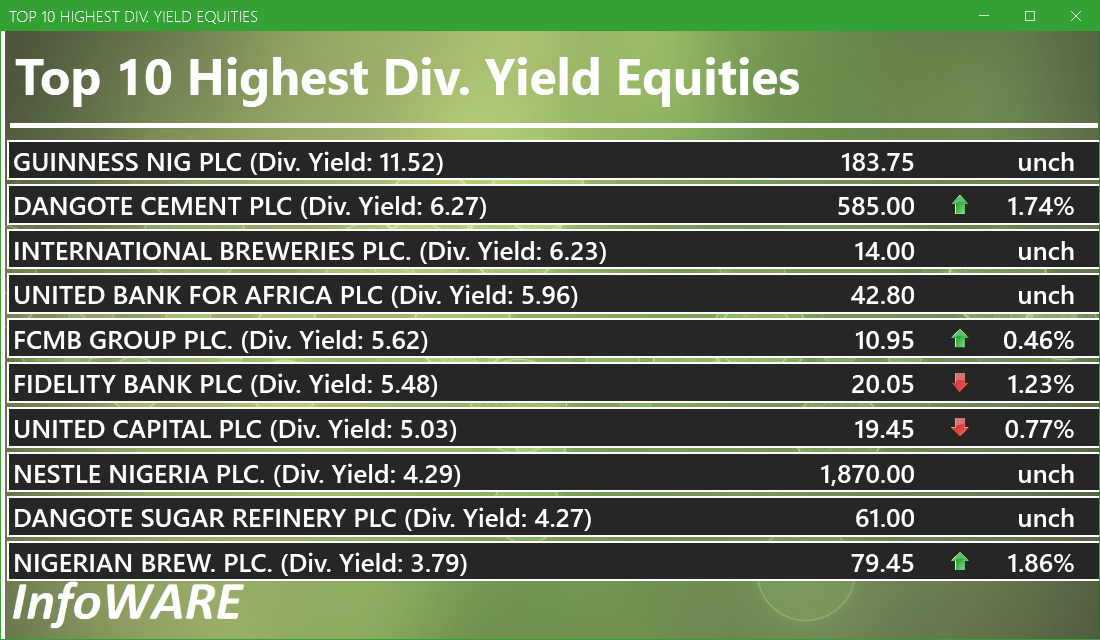
Dividend stocks distribute a portion of the company earnings to investors on a regular basis and they can a great choice for investors looking for regular income. As an investment or trading strategy, high dividend yield equities provide annual cash payments as against mostly capital gains in the price of a stock. The list in the table below represent the highest dividend paying stocks from the list of the most liquid stocks in the NSE top 30.
For more detailed analysis,
- On InfoWARE Market Data Terminal <HYIELD> <GO>
- On InfoWARE Finance Mobile App ( Android , iPhone & iPad and Windows 10) , "Research"
Investment Insights - Stocks outperforming the ASI but with approximately the same risk
These list of stocks represent equities that are less risky than the ASI but doing better than the ASI (All Shares Index) using the YTD (Year to Date) returns as the measure. The risk is measured by Beta. Beta is an assessment of a stock's tendency to undergo price changes, (its volatility), as well as its potential returns compared to the ASI. It is expressed as a ratio, where a score of 1 represents performance comparable to the ASI, and returns above or below the market may receive scores greater or lower than 1.
For a full list of both positively and negatively corelated stocks visit InfoWARE Market Data Terminal
- On InfoWARE Market Data Terminal <BANL> <GO>
- On InfoWARE Finance Mobile App ( Android , iPhone & iPad and Windows 10)
| Symbol | DivYield | PE | EPS | Beta | %ChgYTD | ASIYTDReturn | BetaDiff |
|---|---|---|---|---|---|---|---|
| HONYFLOUR | 1.40 | 16.28 | 0.31 | 0.99 | 228.76 | 43.16 | 0.01 |
| CAVERTON | 5.52 | 1.15 | 1.57 | 0.98 | 171.76 | 43.16 | 0.02 |
| ROYALEX | 7.81 | 0.00 | 0.00 | 0.96 | 103.64 | 43.16 | 0.04 |
| CORNERST | 5.28 | 8.62 | 0.35 | 0.93 | 56.82 | 43.16 | 0.07 |
| DEAPCAP | 13.76 | 188.84 | 0.01 | 0.89 | 50.00 | 43.16 | 0.11 |
| VERITASKAP | 4.17 | 48.77 | 0.02 | 0.88 | 44.30 | 43.16 | 0.12 |
| UNIVINSURE | 0.00 | 0.00 | 0.00 | 0.83 | 54.17 | 43.16 | 0.17 |
| FTNCOCOA | 1.60 | 0.00 | 0.00 | 0.79 | 208.51 | 43.16 | 0.21 |
| NB | 3.79 | 16.95 | 1.60 | 0.79 | 148.28 | 43.16 | 0.21 |
| MAYBAKER | 3.75 | 58.94 | 0.14 | 0.78 | 84.04 | 43.16 | 0.22 |
African Markets
| Name | LClose | Change | %Chg |
|---|---|---|---|
| BRVM Stock Exchange | 331.11 | 2.14 | 0.65 |
| Egyptian Exchange | 37,097.37 | 3.71 | 0.01 |
| Nairobi Securities Exchange | 173.75 | -2.54 | -1.44 |
| Tunis Stock Exchange | 12,298.61 | -23.41 | -0.19 |
Nigeria Market Indexes
| Symbol | LClose | %Chg | WTD% | MTD% | QTD% | YTD% | MktCap | Trades |
|---|---|---|---|---|---|---|---|---|
| ASI | 147,717.21 | 0.50 | 0.00 | 3.31 | 3.31 | 43.16 | 29,818 | |
| NGX30 | 5,389.57 | 0.50 | 0.00 | 3.29 | 3.29 | 41.28 | 17,218 | |
| NGXAFRBVI | 3,534.17 | 0.03 | 0.00 | -0.43 | -0.43 | 42.46 | 6,021 | |
| NGXAFRHDYI | 22,130.79 | -0.53 | 0.00 | -0.58 | -0.58 | 29.97 | 8,297 | |
| NGXASEM | 1,392.88 | 0.00 | 0.00 | -9.44 | -9.44 | -12.05 | 10 | |
| NGXBNK | 1,522.91 | 0.16 | 0.00 | 0.41 | 0.41 | 40.05 | 7,140 | |
| NGXCG | 4,162.26 | 0.13 | 0.00 | 2.75 | 2.75 | 47.12 | 15,159 | |
| NGXCNSMRGDS | 3,437.31 | 0.23 | 0.00 | 1.61 | 1.61 | 98.19 | 3,888 | |
| NGXCOMMDTY | 1,170.42 | 1.51 | 0.00 | 4.33 | 4.33 | 17.04 | ||
| NGXGROWTH | 15,312.57 | -0.74 | 0.00 | 1.60 | 1.60 | 97.25 | 348 | |
| NGXINDUSTR | 5,327.47 | 0.66 | 0.00 | 5.12 | 5.12 | 49.16 | 2,935 | |
| NGXINS | 1,284.03 | 2.11 | 0.00 | 7.35 | 7.35 | 63.32 | 2,179 | |
| NGXLOTUSISLM | 12,375.38 | 0.16 | 0.00 | 4.25 | 4.25 | 77.61 | 5,876 | |
| NGXMAINBOARD | 7,119.97 | 0.50 | 0.00 | 1.07 | 1.07 | 42.29 | 21,467 | |
| NGXMERIGRW | 10,185.90 | -0.27 | 0.00 | 2.85 | 2.85 | 56.15 | 4,355 | |
| NGXMERIVAL | 13,642.19 | -0.02 | 0.00 | 2.05 | 2.05 | 30.79 | 8,287 | |
| NGXOILGAS | 2,659.47 | -0.03 | 0.00 | 5.28 | 5.28 | -1.91 | 523 | |
| NGXPENBRD | 2,747.41 | 0.54 | 0.00 | 3.63 | 3.63 | 50.00 | 24,379 | |
| NGXPENSION | 6,896.53 | 0.19 | 0.00 | 2.36 | 2.36 | 52.11 | 19,022 | |
| NGXPREMIUM | 14,785.46 | 0.50 | 0.00 | 7.99 | 7.99 | 51.91 | 8,003 | |
| NGXSOVBND | 662.67 | 0.00 | 0.00 | 0.82 | 0.82 | 10.16 | 0 |
For more detailed analysis,
- On InfoWARE Market Data Terminal <MKTINS> <GO>
- On InfoWARE Finance Mobile App ( Android, iPhone & iPad and Windows 10) , "Market Indexes"
Find the topic interesting? Will like to comment? Contact Us at solutions@infowarelimited.com
Top News

Chart Of The Day - ASI Chart Vs ASI Advance Decline Line (YTD) (13-Oct-2025 15:09:57.318)
InfoWARE AI Analyst Daily Market Report: 13-Oct-2025

[XNSA]>> CORDROS MILESTONE FUNDS' BID & OFFER PRICES
[XNSA]>> PRESCO PLC: PROPOSED RIGHTS ISSUE
[XNSA]>> RESIGNATION OF A DIRECTOR
[VSPBONDETF]>> DAILY INDICATIVE PRICES
[XNSA]>> NGX FIXED INCOME INDICATIVE PRICE LIST FOR OCT 13, 2025
[XNSA]>> DAILY FUND PRICE SUBMISSION - FCMB ASSET MANAGEMENT LIMITED
[XNSA]>> EMERGING AFRICA DAILY MUTUAL FUND PRICES
[XNSA]>> NOTIFICATION OF PRICE ADJUSTMENT
[XNSA]>> CLOSING GONG CEREMONY BY ZENITH BANK PLC
[XNSA]>> UPDATED- SAVE THE DATE: 29TH ANNUAL STOCKBROKERS CONFERENCE
[XNSA]>> AELP CAPACITY BUILDING & ASSDA FORUM
[STANBICETF30]>> DAILY INDICATIVE PRICES
[XNSA]>> DELISTING OF SMART PRODUCTS PLC AND MIGRATION OF JULI PLC TO GROWTH BOA
InfoWARE AI Analyst Weekly Market Report: 10-Oct-2025
Chart Of The Day - ASI Chart Vs ASI Advance Decline Line (YTD) (10-Oct-2025 15:06:58.197)
InfoWARE AI Analyst Daily Market Report: 10-Oct-2025
[XNSA]>> NORRENBERGER MUTUAL FUNDS WEEKLY UPDATE
[MERGROWTH]>> DAILY INDICATIVE PRICES
[VETINDETF]>> DAILY INDICATIVE PRICES
[XNSA]>> NGX FIXED INCOME INDICATIVE PRICE LIST FOR OCT 10, 2025
[XNSA]>> CLOSING GONG CEREMONY IN COMMEMORATION OF WORLD MENTAL HEALTH DAY
[XNSA]>> CLOSING GONG CEREMONY BY ZENITH BANK PLC
[XNSA]>> CORDROS MILESTONE FUNDS' BID & OFFER PRICES
[XNSA]>> UPDATED- SAVE THE DATE: 29TH ANNUAL STOCKBROKERS CONFERENCE
[XNSA]>> AELP CAPACITY BUILDING & ASSDA FORUM
Chart Of The Day - ASI Chart Vs ASI Advance Decline Line (YTD) (09-Oct-2025 15:11:54.102)
InfoWARE AI Analyst Daily Market Report: 09-Oct-2025
[XNSA]>> CLOSING GONG CEREMONY IN COMMEMORATION OF WORLD MENTAL HEALTH DAY
Get IDIA - the stock trading app for the modern investor
Solutions by Business
Product Suites
Company
Contacts
- 8th Floor,
- South Atlantic Petroleum Towers,
- 1 Adeola Odeku Street,
- Victoria Island,
- Lagos, Nigeria.
- Email: solutions@infowarelimited.com
Follow Us
 |
 |
 |
 |