


InfoWARE AI Analyst Daily Market Report: 05-Nov-2025 | InfoWARE Finance
Get IDIA - the stock trading app for the modern investor


InfoWARE AI Analyst Daily Market Report: 05-Nov-2025
(Source: InfoWARE Terminal, Date: 05-Nov-2025)
Dear Investor,
NGX Daily Market Summary – Wednesday, November 5, 2025
The NGX All Share Index (ASI) slid -1.19% to 152,629.61, turning in its weakest day this month, though the YTD performance still reflects robust gains at 46.17%. Market turnover decelerated sharply, dropping by -20.54% to ₦14.34B as trade activity and volumes cooled. Market breadth remained deeply negative (0.39x), with decliners (49) outnumbering advancers (19)—a clear signal of broad risk-off sentiment and declining conviction. While the Naira appreciated modestly (up 0.22% vs. USD), heavyweights and banking names faced selling pressure, some on unusually high volumes, painting a technical picture of tactical risk reduction across sectors as the overall market entered a pullback.
Key Trends & Market Breadth:
- Market Breadth: Decliners dominated, with breadth at just 0.39x (19 advancers vs. 49 decliners). This ratio confirms a market-wide selloff rather than isolated weakness.
-
Turnover & Volume: Market turnover fell -20.54% to ₦14.34B (from ₦18.05B yesterday), echoing risk aversion and lighter institutional commitment. Trading volume also dropped to 501.2M (-22.3%).
- Institutionals controlled 88.42% of trade value (despite only 35% of trade count), further highlighting the "big money" rebalancing out of key positions.
- Unusual Volume: Banks were notably active: Sterling Financial (+220.9% volume surge), Zenith Bank (+126.4% volume), ASO Savings (+284.9%), UACN (+173.9%). These moves often foreshadow shifting institutional or large-retail sentiment and may presage larger trend shifts.
- Sectoral Weakness: Premium banking and diversified industrials, alongside the NGX30 and Premium indices, triggered fresh bearish technical signals (see Sector Heatmap below).
Top Gainers & Losers – Single Day Standouts:
| Stock | Move | RSI | MACD | 15DMA/50DMA | Sector |
|---|---|---|---|---|---|
| NCR | +10.00% | 66.3 | 0.37 | 16.11/15.06 | Technology |
| VETGRIF30 | +10.00% | 49.5 | 0.92 | 55.93/52.75 | ETF |
| MERVALUE | +9.74% | 49.3 | 6.34 | 205.13/195.71 | ETF |
| LEGENDINT | +9.16% | 43.4 | -0.00 | 5.80/5.54 | Digital |
| CORNERST | +8.80% | 42.1 | -0.11 | 6.26/6.49 | Insurance |
| CILEASING | -10.00% | 50.4 | -0.03 | 6.12/6.32 | Leasing |
| TRANSCORP | -10.00% | 58.1 | 0.58 | 48.23/47.40 | Diversified |
| SKYAVN | -9.99% | 39.6 | 2.11 | 95.03/91.54 | Transport |
| BETAGLAS | -9.99% | 30.2 | -8.64 | 463.65/479.29 | Industry |
| RTBRISCOE | -9.92% | 52.4 | -0.02 | 3.43/3.47 | Auto |
- NCR and LEGENDINT: Stand out in both top gainers and the YTD top gainers, supported by RSI above 40 and positive MACD; momentum remains favorable (short-term MAs above long-term).
- SKYAVN and BETAGLAS appear on both top losers and YTD laggards, with SKYAVN’s RSI sharply lower, signifying emerging oversold conditions.
- VETGRIF30 (ETF) is notable for crossing above the 15DMA (bullish momentum) with a sharp single-day gain.
Insights & Predictions
- Turnover Down, Volatility Up: A -20.54% drop in market turnover amidst heavy decliners often preludes further choppiness—traders should expect continued two-way volatility with potential for snap-back rallies as some oversold technicals emerge.
- Unusual Volumes—Banking Focus: Sterling Financial, Zenith Bank, GTCO, and Access Holdings posted volumes well above historical averages (2-3x 90D avg). This suggests either institutional repositioning or pre-earnings speculation but also exposes these names to short-term mean reversion risk.
- Bullish Momentum Overlaps: VETGRIF30, MERVALUE, LEGENDINT: All crossed above the 15DMA and are top daily gainers—momentum players will watch for follow-through, though profit-taking risk rises as RSI nears 70 in spots.
- Bearish Momentum/Breakdowns: AFRIPRUD, WEMABANK, RTBRISCOE, CILEASING, TRANSCORP, MTNN, WAPCO all fell below their 15DMA—with some also showing persistent value outflows. When both technicals and volume confirm weakness, support levels can crack swiftly.
- Contrarian Watch: SKYAVN is a large YTD gainer yet among top daily/YTD losers. Its RSI crashing down hints at deepening correction (possible "catch-the-knife" bounce ahead?), but high beta and sector cyclicality suggest caution.
Contrarian Signals
| Stock | YTD % | RSI | MACD | 15DMA/50DMA | Contradiction |
|---|---|---|---|---|---|
| CHAMPION | -9.8% | 54.4 | Bullish | 15.99/15.59 | Mixed: Weak YTD, but improving momentum (MACD, RSI in neutral) |
| TRANSCORP | -9.8% | 58.1 | Bullish | 48.23/47.40 | Bearish price trend, but no technical breakdown yet; potential dead cat bounce? |
| SKYAVN | 140.96% | 39.6 | Bullish recent MACD | 95.03/91.54 | Massive YTD gainer but now severely oversold—possible snapback or exhaustion gap? |
Sector Heatmaps
| Sector | Performance | Top Stock | Inst. Activity | Tech Signal |
|---|---|---|---|---|
| Banking | Weak | ZENITHBANK | 20.17% volume (Inst.) | Bullish Vol, Bearish Price |
| ETF/Passive | Strong | VETGRIF30/MERVALUE | Medium | Bullish 15DMA Cross (Momentum) |
| Diversified/Industrials | Weak | UACN/TRANSCORP | Low | Bearish |
| Insurance | Mixed | CORNERST | Light | Stabilizing |
| Telecom | Weak | MTNN | Heavy | Bearish (fell below 15DMA) |
Dividend-Beta Matrix: Defensive Opportunities
| Stock | Dividend Yield | Beta | Momentum | Commentary |
|---|---|---|---|---|
| AFRIPRUD | 1.27% | 0.64 | Bearish | Low beta, decent yield—potential defensive buy; recently broke below 15DMA, near mild oversold. Await further confirmation. |
| WAPCO | 2.7% | 1.17 | Bearish | Above-average yield for a cyclical; but above-median beta and new technical breakdown—better to watch for reversal signal first. |
| RTBRISCOE | 4.35% | -0.16 | Bearish | High yield & negative beta, but in technical breakdown—could appeal to deep-value contrarians after further washout. |
| CILEASING | 1.2% | ~0.30 | Bearish | Low-risk, income-oriented profile but under significant downside pressure. |
| SOVRENINS | 3.75% | 0.97 | Stable | Moderate yield, at threshold beta—short-term stabilization but longer-term still pressured. |
- Watch for reversal in AFRIPRUD—income with downside protection. But, don’t rush until signals turn positive.
- Multiple high-yield stocks are showing bearish momentum, indicating "yield traps" for casual investors.
Institutional Clustering Alerts
- ZENITHBANK: Commanded a leading 20.17% of institutional trade value. Trading volume was more than double 90D average. Indicates major fund rotation (likely profit booking and/or rebalancing out of banks short term). If institutional selling persists tomorrow, expect sector drag to continue—especially as it aligns with a broader bearish sectoral signal.
- MTNN: Appears heavily traded by both retail and institutional investors but closed -6.32%—distribution by large players is outweighing any retail dip-buying attempt.
Trader Suggestions & Opportunities
- For short-term traders: Focus on ultra-liquid, high-vol stocks with technical reversals: NCR, LEGENDINT, VETGRIF30 for breakout continuation, but watch for profit-taking.
- Income/Hedged investors: Track AFRIPRUD for bottoming; if reversal forms, can provide low-beta and yield cushion.
- Contrarians: Take note of severe drop in SKYAVN—but only initiate after stabilization (current momentum still negative).
- Caution: Market is whippy with risk-off tone; avoid leveraged long positions in anything showing new breakdowns (TRANSCORP, CILEASING, MTNN).
Year To Date (YTD) Top Gainers & Losers
| Stock | YTD % | %Chg 5 Days | RSI | MACD |
|---|---|---|---|---|
| SKYAVN | 140.96% | -18.99% | 39.6 | 2.11 |
| SOVRENINS | 170.73% | -14.62% | 51.56 | 0.26 |
| EUNISELL | 236.79% | +10.00% | 80.33 | 7.00 |
| CHAMS | 42.86% | -12.02% | 39.2 | -0.03 |
| NCR | 220.00% | +10.00% | 66.33 | 0.37 |
| BETAGLAS | 506.63% | -9.99% | 30.18 | -8.64 |
| CILEASING | 34.78% | -11.43% | 50.43 | -0.03 |
| TRANSCORP | 3.45% | -10.00% | 58.14 | 0.58 |
Market Activity/Trades Summaries Analysis
-
Institutional vs Retail: 35.19% of trades (Inst.) drove 88.42% of value, while retail made up 65% of counts but barely 12% of aggregate value—continuing the institutional dominance theme.
- Top 5 Most Traded (Institutional): Zenith Bank (lead), Access Holdings, GTCO, Aradel & MTNN. Pattern: Large-cap banks dominate institutional flows, synchronizing with high-vol spikes and bearish price action—suggesting net outflows and increased volatility ahead.
- Top 5 Most Traded (Retail): MTNN, GTCO, Zenith Bank, FCMB, AccessCorp—retail activity also clustered in blue-chip financials but with less volume per trade, showing "dip-buying" attempts against the broader institutional selling.
- Hidden Opportunity: If institutions continue to exit, short-term traders may capitalize on volatility spikes and fast rebounds—but must remain alert to failed ‘bear trap’ scenarios. Retail’s attempt to catch falling knives in banks and MTNN could be painful if broader selling persists.
Summary Thought
Bottom line: The current market composite is signaling risk-off discipline among institutions, widespread distribution, sector-wide technical breakdowns, and negative breadth. For the nimble, this offers volatility windows and quick-swing trading opportunities. For the longer-term, await stabilization of technical signals, especially in high-yield, low-beta defensives like AFRIPRUD. Contrarians may eye deep YTD winners now in oversold correction (SKYAVN), but should not be early. Expect more choppiness; confirm all trades with volume, technical reversals, and, ideally, a return of broad market breadth.
|
Top ASI Gainers Over Last 5 Trading Days
|
Top ASI Losers Over Last 5 Trading Days
|
For more detailed analysis, on InfoWARE Market Data Terminal <NSEPERF> <GO>
On InfoWARE Finance Mobile App (Android, iPhone & iPad, Windows Phone and Windows 8/10), "Top Gainers & Losers"
NCR (NIGERIA) PLC. (NCR) topped the advancers list closing at N17.60 with a gain of 10.00% followed by VETIVA GRIFFIN 30 ETF (VETGRIF30) which closed at N59.40 with a gain of 10.00%.
On the flip side C & I LEASING PLC. (CILEASING) and TRANSNATIONAL CORPORATION OF NIGERIA PLC (TRANSCORP) topped the decliners log with a loss of -10.00% at a close of N5.58, and -10.00% to close the day at N45.00 respectively.
For more detailed analysis,
- On InfoWARE Market Data Terminal <TOPG> <GO>
- On InfoWARE Finance Mobile App ( Android, iPhone & iPad and Windows 10) , "Top Gainers & Losers"
Currency Market
In the currency market, the Naira appreciated 0.22%(3.11) against the Dollar to settle at 1 to 1NSE: Bull Signal - Price crossed above 15 Day MA
This signal implies these stocks are under buying pressure and the price might continue to rise and therefore positions should be monitored closely. Further suggested analysis include looking at the overall market (ASI) to see if the uptrend is market wide, sector wide or specific to the stock. Portfolio managers tend to use this as a signal to do more research to add to their positions or lock in some profits. Typically further analysis should be done using commands like PC and RV on the InfoWARE Market Data Terminal. Another command is ALERTS to set price triggers for possible exit or entry as necessary
For more detailed analysis,
- On InfoWARE Market Data Terminal <NSEPERF> <GO>
- On InfoWARE Finance Mobile App ( Android , iPhone & iPad and Windows 10) , "Top Gainers & Losers"
| Symbol | Price | %Chg | 15DMA | PE | EPS | DivY | MktCap | Vol | Trades | Value | LstTradeTime |
|---|---|---|---|---|---|---|---|---|---|---|---|
| VETGRIF30 | 59.40 | 9.09 | 55.93 | 0.00 | 0.00 | 12.47K | 41.00 | 679.09K | 05-Nov-2025 14:31:17.177 | ||
| MERVALUE | 214.00 | 8.88 | 205.13 | 0.00 | 0.00 | 4.25K | 8.00 | 829.68K | 05-Nov-2025 14:31:17.060 | ||
| LEGENDINT | 5.84 | 8.39 | 5.80 | 0.00 | 0.00 | 584.97K | 40.00 | 3.34M | 05-Nov-2025 14:30:17.203 | ||
| LINKASSURE | 2.00 | 7.50 | 1.99 | 59.89 | 0.02 | 5.56 | 28.00B | 2.34M | 124.00 | 4.30M | 05-Nov-2025 14:31:10.387 |
NSE: BEAR Signal - Price crossed below 15 Day MA
This signal implies these stocks are under selling pressure and the price might continue to slide and therefore positions should be monitored closely. Further suggested analysis include looking at the overall market (ASI) to see if the downtrend is market wide, sector wide or specific to the stock. If the overal market trend is upwards, then since these stocks are heading in the opposite direction, then further analysis should be done using commands like PC and RV on the InfoWARE Market Data Terminal. Another command is ALERTS to set price triggers for possible exit is necessar
For more detailed analysis,
- On InfoWARE Market Data Terminal <BEARM> <GO>
- On InfoWARE Finance Mobile App ( Android , iPhone & iPad and Windows 10)
| Symbol | Price | %Chg | 15DMA | PE | EPS | DivY | MktCap | Vol | Trades | Value | LstTradeTime |
|---|---|---|---|---|---|---|---|---|---|---|---|
| NGXPENBRD | 2,822.87 | -1.08 | 2,851.68 | 348.78 | 389.18 | 0.00 | 0.00 | 379.27M | 21,155.00 | 13.82B | 05-Nov-2025 14:31:23.070 |
| NGX30 | 5,526.95 | -1.31 | 5,593.10 | 575.61 | 329.08 | 0.00 | 0.00 | 293.59M | 14,736.00 | 11.67B | 05-Nov-2025 14:30:38.040 |
| NGXLOTUSISLM | 13,328.51 | -1.68 | 13,432.11 | 1,270.93 | 62.77 | 0.00 | 0.00 | 10.56M | 4,968.00 | 2.01B | 05-Nov-2025 14:30:38.807 |
| NGXPREMIUM | 15,285.24 | -2.37 | 15,498.50 | 2,048.74 | 238.70 | 0.00 | 0.00 | 120.23M | 7,022.00 | 6.75B | 05-Nov-2025 14:30:39.327 |
| AFRIPRUD | 14.35 | -2.44 | 14.49 | 19.57 | 0.61 | 1.27 | 28.70B | 697.19K | 95.00 | 10.06M | 05-Nov-2025 14:30:12.817 |
| WEMABANK | 19.70 | -3.81 | 20.05 | 216.91 | 0.04 | 5.81 | 253.31B | 6.88M | 348.00 | 132.26M | 05-Nov-2025 14:31:16.847 |
| DEAPCAP | 1.65 | -6.06 | 1.73 | 188.84 | 0.01 | 13.76 | 2.48B | 853.99K | 52.00 | 1.42M | 05-Nov-2025 14:30:14.390 |
| MTNN | 489.20 | -6.32 | 503.70 | 16,715.80 | 0.01 | 3.29 | 9,957.43B | 2.20M | 2,035.00 | 1.08B | 05-Nov-2025 14:31:17.747 |
| WAPCO | 130.00 | -7.69 | 139.73 | 24.60 | 2.87 | 2.70 | 2,094.01B | 2.11M | 374.00 | 276.89M | 05-Nov-2025 14:31:18.013 |
| RTBRISCOE | 3.18 | -11.01 | 3.43 | 0.00 | 0.00 | 4.35 | 3.74B | 987.16K | 32.00 | 3.17M | 05-Nov-2025 14:30:24.873 |
| CILEASING | 5.58 | -11.11 | 6.12 | 6.50 | 0.64 | 1.20 | 4.36B | 283.51K | 26.00 | 1.60M | 05-Nov-2025 14:30:13.763 |
| TRANSCORP | 45.00 | -11.11 | 48.23 | 0.00 | 0.00 | 0.23 | 1,829.16B | 1.81M | 228.00 | 81.97M | 05-Nov-2025 14:30:25.660 |
| FGS202882 | 100.00 | -35.00 | 130.33 | 0.00 | 0.00 | 8.00 | 1.00 | 8.00K | 05-Nov-2025 14:30:35.810 |
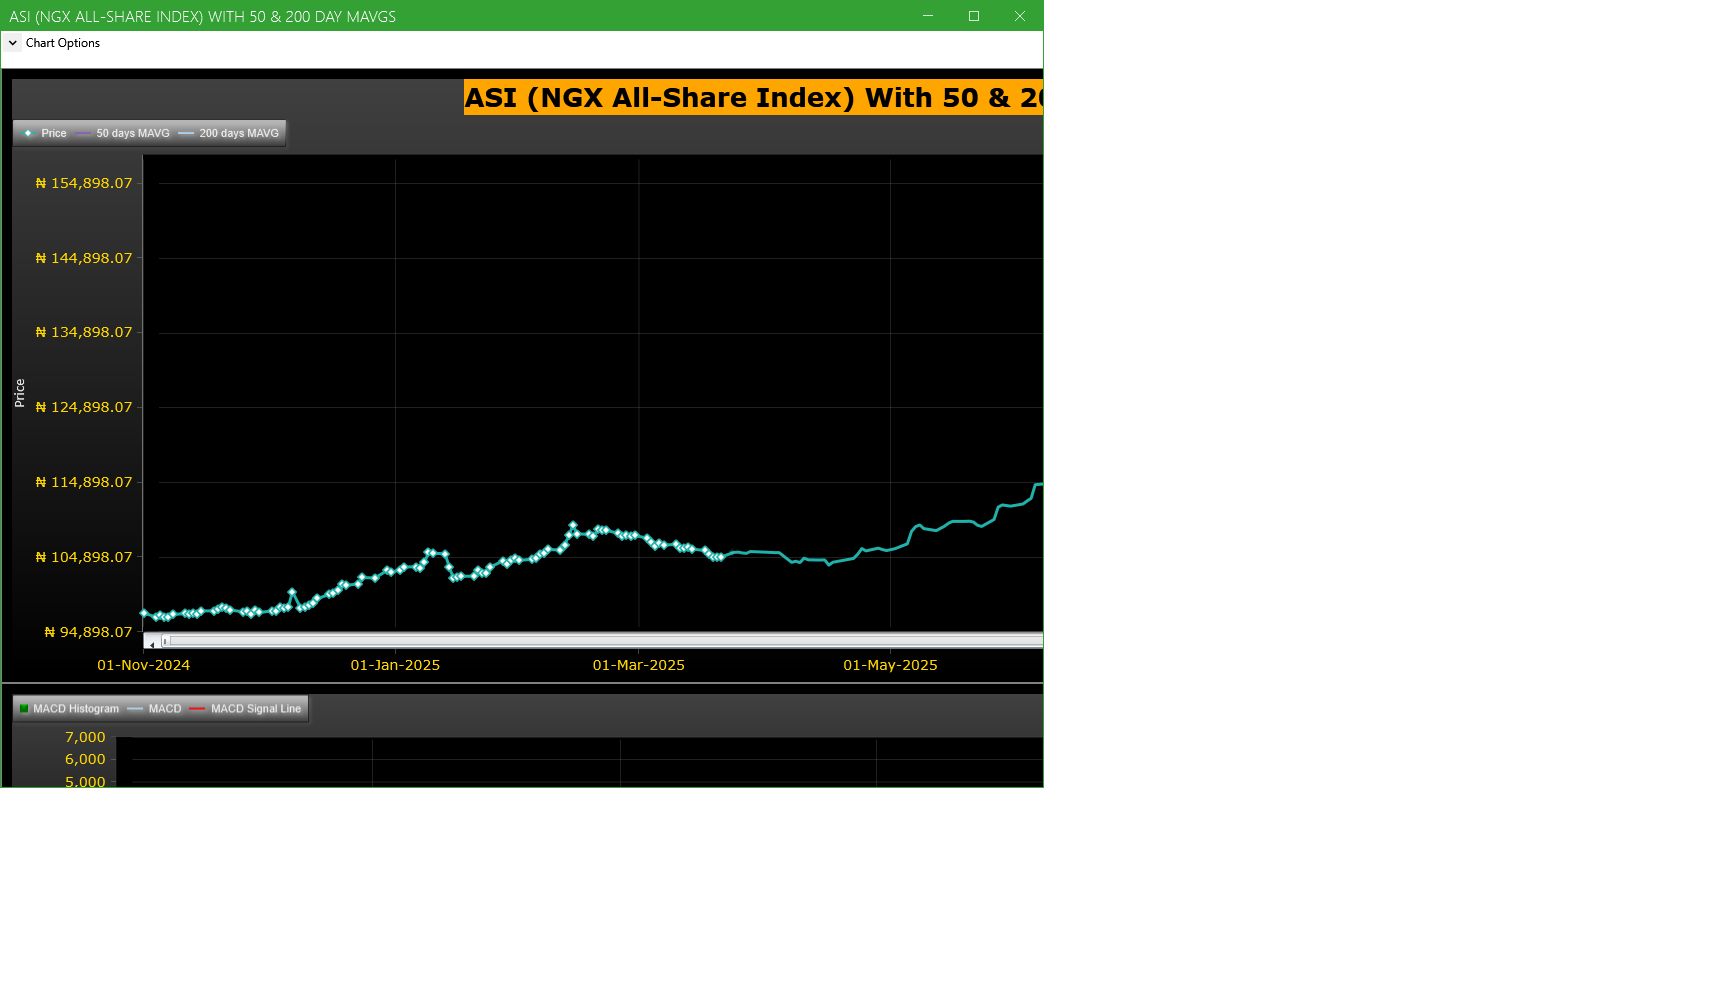
Market Trend - ASI (NGX All-Share-Index) With 50 & 200 Day MAvgs Chart
Technical traders typically use the 50 & 200 day moving averages to aid in choosing
where to enter or exit a position, which then causes these levels to act as strong
support or resistance. As a general guideline, if the price is above a moving average,
the trend is up. If the price is below a moving average, the trend is down.
It is important to note that critics of technical analysis say that moving averages act
as support and resistance because so many traders use these indicators to inform their
trading decisions. Also moving averages tend to work quite well in strong trending conditions
but poorly in choppy or ranging conditions.
Trading Strategies: Crossovers
Crossovers are one of the main moving average strategies. The first type is a price crossover,
which is when the price crosses above or below a moving average to signal a potential change
in trend. Another strategy is to apply two moving averages to a chart: one longer and one
shorter. When the shorter-term MA crosses above the longer-term MA, it is a buy signal, as
it indicates that the trend is shifting up. This is known as a golden cross. Meanwhile, when
the shorter-term MA crosses below the longer-term MA, it is a sell signal, as it indicates that
the trend is shifting down. This is known as a dead/death cross
For more detailed analysis,
- On InfoWARE Market Data Terminal <CI> <GO>
- On InfoWARE Finance Mobile App ( Android , iPhone & iPad and Windows 10) , "Research"
Unusual Volume: Volume traded is more than double the 90 day moving average (All exchanges; ASI & ASem). For more detailed analysis,
- On InfoWARE Market Data Terminal <UV> <GO>
- On InfoWARE Finance Mobile App ( Android , iPhone & iPad and Windows 10)
| Symbol | Name | Volume | 90DAvgVol | %VolChg | Price | LClose | %Chg | Trades | Value |
|---|---|---|---|---|---|---|---|---|---|
| STERLINGNG | STERLING FINANCIAL HOLDINGS COMPANY PLC | 81.66M | 25.45M | 220.90 | 7.90 | 8.00 | -1.25 | 452 | 628.47M |
| ZENITHBANK | ZENITH INTERNATIONAL BANK PLC | 53.67M | 23.71M | 126.36 | 60.80 | 61.55 | -1.22 | 1,755 | 3.28B |
| NSLTECH | SECURE ELECTRONIC TECHNOLOGY PLC | 22.43M | 10.67M | 110.34 | 0.80 | 0.82 | -2.44 | 143 | 17.07M |
| ASOSAVINGS | ASO SAVINGS AND LOANS PLC | 21.87M | 5.68M | 284.90 | 0.96 | 1.06 | -9.43 | 415 | 21.52M |
| UACN | U A C N PLC. | 8.00M | 2.92M | 173.90 | 60.00 | 65.00 | -7.69 | 186 | 480.33M |
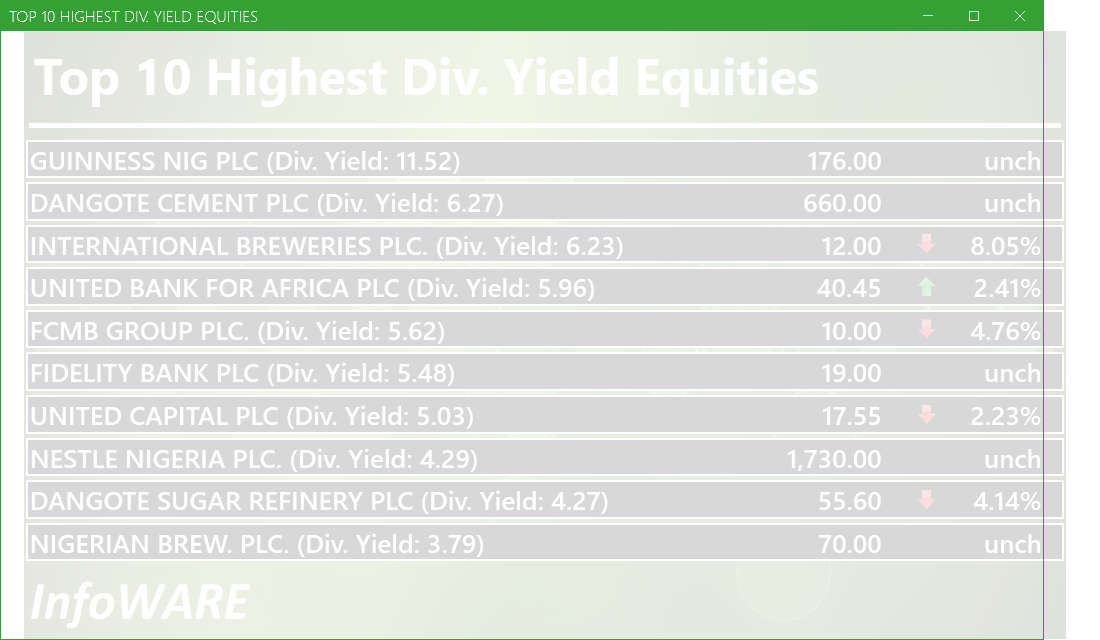
Investment Insights - High Div. Stocks
Dividend stocks distribute a portion of the company earnings to investors on a regular basis and they can a great choice for investors looking for regular income. As an investment or trading strategy, high dividend yield equities provide annual cash payments as against mostly capital gains in the price of a stock. The list in the table below represent the highest dividend paying stocks from the list of the most liquid stocks in the NSE top 30.
For more detailed analysis,
- On InfoWARE Market Data Terminal <HYIELD> <GO>
- On InfoWARE Finance Mobile App ( Android , iPhone & iPad and Windows 10) , "Research"
Investment Insights - Stocks outperforming the ASI but with approximately the same risk
These list of stocks represent equities that are less risky than the ASI but doing better than the ASI (All Shares Index) using the YTD (Year to Date) returns as the measure. The risk is measured by Beta. Beta is an assessment of a stock's tendency to undergo price changes, (its volatility), as well as its potential returns compared to the ASI. It is expressed as a ratio, where a score of 1 represents performance comparable to the ASI, and returns above or below the market may receive scores greater or lower than 1.
For a full list of both positively and negatively corelated stocks visit InfoWARE Market Data Terminal
- On InfoWARE Market Data Terminal <BANL> <GO>
- On InfoWARE Finance Mobile App ( Android , iPhone & iPad and Windows 10)
| Symbol | DivYield | PE | EPS | Beta | %ChgYTD | ASIYTDReturn | BetaDiff |
|---|---|---|---|---|---|---|---|
| HONYFLOUR | 1.40 | 16.28 | 0.31 | 0.99 | 202.02 | 46.17 | 0.01 |
| CAVERTON | 5.52 | 1.15 | 1.57 | 0.98 | 98.04 | 46.17 | 0.02 |
| ROYALEX | 7.81 | 0.00 | 0.00 | 0.96 | 76.36 | 46.17 | 0.04 |
| CORNERST | 5.28 | 8.62 | 0.35 | 0.93 | 56.06 | 46.17 | 0.07 |
| UNIVINSURE | 0.00 | 0.00 | 0.00 | 0.83 | 62.50 | 46.17 | 0.17 |
| FTNCOCOA | 1.60 | 0.00 | 0.00 | 0.79 | 155.32 | 46.17 | 0.21 |
| NB | 3.79 | 16.95 | 1.60 | 0.79 | 118.75 | 46.17 | 0.21 |
| MAYBAKER | 3.75 | 58.94 | 0.14 | 0.78 | 87.77 | 46.17 | 0.22 |
| UNILEVER | 2.81 | 67.09 | 0.40 | 0.75 | 104.72 | 46.17 | 0.25 |
| VETGOODS | 0.00 | 0.71 | 115.12 | 46.17 | 0.29 |
African Markets
| Name | LClose | Change | %Chg |
|---|---|---|---|
| BRVM Stock Exchange | 337.20 | -1.93 | -0.57 |
| Botswana Stock Exchange | 10,577.83 | 0.00 | 0.00 |
| Egyptian Exchange | 39,065.73 | 444.15 | 1.15 |
| Johannesburg Stock Exchange | 107,381.90 | -1,701.70 | -1.56 |
| Lusaka Stock Exchange | 25,398.32 | -5.08 | -0.02 |
| Casablanca Stock Exchange | 19,561.84 | -147.82 | -0.75 |
| Malawi Stock Exchange | 614,030.23 | -1,292.18 | -0.21 |
| Nigeria Stock Exchange | 152,629.60 | -1,106.90 | -0.72 |
| Nairobi Securities Exchange | 189.08 | -1.06 | -0.56 |
| Namibian Stock Exchange | 1,959.54 | -26.01 | -1.31 |
| Rwanda Stock Exchange | 179.09 | 0.00 | 0.00 |
| Uganda Securities Exchange | 1,535.32 | 16.70 | 1.10 |
Nigeria Market Indexes
| Symbol | LClose | %Chg | WTD% | MTD% | QTD% | YTD% | MktCap | Trades |
|---|---|---|---|---|---|---|---|---|
| ASI | 150,813.42 | -1.19 | -1.90 | -1.90 | 5.48 | 46.17 | 25,561 | |
| NGX30 | 5,526.95 | -1.29 | -1.97 | -1.97 | 5.92 | 44.88 | 14,736 | |
| NGXAFRBVI | 3,232.16 | 0.39 | -2.60 | -2.60 | -8.94 | 30.29 | 5,572 | |
| NGXAFRHDYI | 21,019.74 | -2.00 | -3.57 | -3.57 | -5.57 | 23.45 | 7,035 | |
| NGXASEM | 1,392.88 | 0.00 | 0.00 | 0.00 | -9.44 | -12.05 | 5 | |
| NGXBNK | 1,430.43 | -0.19 | -2.24 | -2.24 | -5.69 | 31.54 | 5,732 | |
| NGXCG | 3,975.24 | -0.96 | -2.75 | -2.75 | -1.87 | 40.51 | 13,878 | |
| NGXCNSMRGDS | 3,462.98 | -1.02 | -2.50 | -2.50 | 2.37 | 99.67 | 3,334 | |
| NGXCOMMDTY | 1,210.42 | 0.22 | 0.22 | 0.22 | 7.90 | 21.04 | ||
| NGXGROWTH | 15,606.29 | 0.00 | 0.63 | 0.63 | 3.55 | 101.04 | 309 | |
| NGXINDUSTR | 5,885.55 | -1.16 | -1.18 | -1.18 | 16.14 | 64.79 | 2,016 | |
| NGXINS | 1,166.42 | -0.08 | -3.84 | -3.84 | -2.48 | 48.36 | 1,737 | |
| NGXLOTUSISLM | 13,328.51 | -1.65 | -2.08 | -2.08 | 12.28 | 91.29 | 4,968 | |
| NGXMAINBOARD | 7,220.49 | -0.57 | -1.48 | -1.48 | 2.50 | 44.30 | 18,230 | |
| NGXMERIGRW | 10,022.62 | -1.50 | -2.88 | -2.88 | 1.21 | 53.64 | 3,608 | |
| NGXMERIVAL | 12,768.32 | -0.44 | -2.01 | -2.01 | -4.49 | 22.41 | 7,350 | |
| NGXOILGAS | 2,782.19 | 0.22 | -0.57 | -0.57 | 10.14 | 2.62 | 422 | |
| NGXPENBRD | 2,822.87 | -1.07 | -1.69 | -1.69 | 6.48 | 54.12 | 21,155 | |
| NGXPENSION | 6,798.21 | -1.10 | -2.24 | -2.24 | 0.90 | 49.94 | 16,612 | |
| NGXPREMIUM | 15,285.24 | -2.32 | -2.70 | -2.70 | 11.64 | 57.05 | 7,022 | |
| NGXSOVBND | 668.40 | 0.00 | 0.00 | 0.00 | 1.69 | 11.11 | 0 |
For more detailed analysis,
- On InfoWARE Market Data Terminal <MKTINS> <GO>
- On InfoWARE Finance Mobile App ( Android, iPhone & iPad and Windows 10) , "Market Indexes"
Find the topic interesting? Will like to comment? Contact Us at solutions@infowarelimited.com
Top News

Chart Of The Day - ASI Chart Vs ASI Advance Decline Line (YTD) (05-Nov-2025 15:08:47.129)
InfoWARE AI Analyst Daily Market Report: 05-Nov-2025

[XNSA]>> OFF MARKET TRADE
[VSPBONDETF]>> DAILY INDICATIVE PRICES
[LOTUSHAL15]>> DAILY INDICATIVE PRICES
[XNSA]>> CORDROS MILESTONE FUNDS' BID & OFFER PRICES
[XNSA]>> NGX FIXED INCOME INDICATIVE PRICE LIST FOR NOV 05, 2025
[XNSA]>> H2 2025 BC/DR TEST
[XNSA]>> AELP CAPACITY BUILDING & ASSDA FORUM
[XNSA]>> NOTIFICATION OF PRICE ADJUSTMENT
Chart Of The Day - ASI Chart Vs ASI Advance Decline Line (YTD) (04-Nov-2025 15:07:17.787)
InfoWARE AI Analyst Daily Market Report: 04-Nov-2025
[VSPBONDETF]>> DAILY INDICAIVE PRICES
[LOTUSHAL15]>> DAILY INDICATIVE PRICES
[XNSA]>> CORDROS MILESTONE FUNDS' BID & OFFER PRICES
[XNSA]>> NGX FIXED INCOME INDICATIVE PRICE LIST FOR NOV 04, 2025
[XNSA]>> H2 2025 BC/DR TEST
[XNSA]>> AELP CAPACITY BUILDING & ASSDA FORUM
[XNSA]>> SUPPLEMENTARY LISTINGS
[SIAMLETF40]>> DAILY INDICATIVE PRICES
Chart Of The Day - ASI Chart Vs ASI Advance Decline Line (YTD) (03-Nov-2025 15:08:42.435)
InfoWARE AI Analyst Daily Market Report: 03-Nov-2025
[STANBICETF30]>> DAILY INDICATIVE PRICES
[LOTUSHAL15]>> DAILY INDICATIVE PRICES
[VETBANK]>> DAILY INDICATIVE PRICES
[XNSA]>> DAILY FUND PRICE SUBMISSION - FCMB ASSET MANAGEMENT LIMITED
[XNSA]>> ACTIVATION OF CODE FOR TRADING IN TRANS-NATIONWIDE EXPRESS PLC's RIGHTS
[XNSA]>> LISTING OF ELEKTRON FINANCE SPV PLC's BOND
[XNSA]>> NGX FIXED INCOME INDICATIVE PRICE LIST FOR NOV 03, 2025
[XNSA]>> H2 2025 BC/DR TEST
Get IDIA - the stock trading app for the modern investor
Solutions by Business
Product Suites
Company
Contacts
- 8th Floor,
- South Atlantic Petroleum Towers,
- 1 Adeola Odeku Street,
- Victoria Island,
- Lagos, Nigeria.
- Email: solutions@infowarelimited.com
Follow Us
 |
 |
 |
 |