


InfoWARE AI Analyst Daily Market Report: 19-Nov-2025 | InfoWARE Finance
Get IDIA - the stock trading app for the modern investor


InfoWARE AI Analyst Daily Market Report: 19-Nov-2025
(Source: InfoWARE Terminal, Date: 19-Nov-2025)
Dear Investor,
NGX Market Summary – Wednesday, November 19, 2025
The NGX All Share Index (ASI) eased by -0.23% today to close at 144,986.51. Despite the marginal pullback, YTD performance remains a robust 40.19%. The market breadth skewed negative at 0.51x, with 21 advancers against 41 decliners. Volumes and turnover were noticeably lighter: total volume slipped -29% compared to the previous session, while value traded dropped -19.06% to ₦5.66 billion. Major institutional flows dominated the session, especially in banking and financials, as high-beta stocks and ETFs drove price action and volatility. Notably, unusually high volumes in key financials like ACCESSCORP signal possible rotation or institutional rebalancing, while select ETFs surged on renewed investor interest.
Significant Market Breadth & Trends
- Market Breadth: 0.51x (21 advancers vs. 41 decliners) indicating heavy selling pressure and declining appetite for risk assets.
- Turnover: Value traded fell -19.06% to ₦5.66bn, consistent with broad declines, but also suggest investors may be waiting for clearer signals or rebalancing after a stellar YTD rally.
- Volume: Only 69 stocks experienced higher volume, versus 72 declines – pointing toward thin liquidity except for stocks with specific institutional or momentum-driven interest.
- Currency Pressure: Naira weakened -0.29% to 1,445/$—persistent FX headwinds could further dampen foreign investor sentiment.
- Top Unusual Volume: ACCESSCORP, TANTALIZER, JAPAULGOLD, LINKASSURE, and CAVERTON registered volumes above 2x their 90-day averages—marking them out for close watch in coming sessions.
Top Gainers & Losers – Highlights
| Stock | Price | % Change | RSI | MACD | Sector | Notables |
|---|---|---|---|---|---|---|
| VETGRIF30 | 60.61 | 10.00% | 51.0 | 0.38 | ETF | Flashed bullish breakout; also bullish 15DMA crossover. |
| NCR | 34.00 | 9.85% | 98.2 | 3.07 | Tech | Year's biggest 5-day gainer; RSI at extreme overbought—risk for reversal is high. |
| CAVERTON | 5.65 | 9.71% | 45.1 | -0.43 | Logistics | Unusual volume; in YTD top 5 gainers list; profit-taking likely soon. |
| SIAMLETF40 | 600.00 | 9.53% | 75.6 | 5.34 | ETF | Strong ETF inflow; momentum play, but RSI >70 warns of speculative excess. |
| STANBICETF30 | 894.80 | 9.34% | 81.6 | 68.46 | ETF | Momentum leader, but rapid RSI--> overbought territory. |
| UNIVINSURE | 1.17 | -10.00% | 65.1 | 0.015 | Insurance | Dropped on very thin volume, not a broad signal. |
| ABCTRANS | 3.44 | -9.95% | 22.4 | -0.072 | Transport | RSI deep oversold; in YTD top losers and high-volume signals possible bottoming soon. |
- ETF Surge: Both VETGRIF30 and SIAMLETF40, along with STANBICETF30, posted strong double-digit moves with high RSI & MACD positive crossovers, showing heavy speculative inflows. But technical over-extension is clear, especially with RSIs above 75/80 (caution warranted).
- NCR: Massive 5-day gain (+32.8%), year-to-date return at a staggering 518.18% —but with RSI at 98.2, it is extremely overbought. Caution: risk of hard reversal ahead.
- CAVERTON: Up +9.71% today, featured among top gainers YTD 121.57%, and saw +122% surge in traded volume; but with MACD slightly negative, some divergence emerging.
- UNIVINSURE: Top loser, but with relatively firm RSI; attention may shift if price stabilizes in the coming sessions.
- ABCTRANS: RSI at 22.4 (oversold), largest single-day loser and among YTD worst (+179.7% YTD, making it a volatile rebound/flush candidate). Bearish but nearing a potential bounce zone.
Momentum & Sector Heatmap
Bullish Signals (Price crossed above 15DMA):
| Stock | Price | % Chg | Sector | RSI | Div Yield | Notes |
|---|---|---|---|---|---|---|
| VETGRIF30 | 60.61 | 9.09% | ETF | 51.0 | 0.00 | Bullish 15DMA cross; best gainer |
| MBENEFIT | 3.64 | 7.14% | Insurance | -- | 3.28 | Strong upward momentum in high-yield Insurance |
| NESTLE | 1,780.00 | 2.81% | Food Products | -- | 4.29 | Consumer defensives see safe haven flow |
| OANDO | 42.90 | 2.33% | Oil & Gas | -- | 1.15 | Energy names react to oil price uptick |
Bearish Signals (Price crossed below 15DMA):
| Stock | Price | % Chg | Sector | RSI | Div Yield | Notes |
|---|---|---|---|---|---|---|
| WEMABANK | 19.70 | -0.51% | Banking | -- | 5.81 | Banking sector rotation out; yield still attractive for defensives |
| INTENEGINS | 2.60 | -4.62% | Insurance | -- | 3.40 | Small cap, excess volatility |
| ROYALEX | 1.85 | -10.81% | Finance | -- | 7.81 | Deep sell-off, high yield may attract bargain hunters soon |
Sector Performance: (% Price Change, Color-coded: Green for positive, Red for negative today; sparklines show 15DMA to 50DMA relationship)
| Sector | % 1Dy Chg | % Chg5Dys | 15DMA vs 50DMA | Sample Stock |
|---|---|---|---|---|
| ETF | +10.0% | +20.2% | 📈 ↑ | VETGRIF30 |
| Tech/IT | +9.85% | +32.8% | 📈 ↑ | NCR |
| Transport | -9.95% | -9.95% | 📉 ↓ | ABCTRANS |
| Financials | -1.59% | -5.87% | 📉 ↓ | ACCESSCORP |
| Insurance | -8.97% | -7.50% | 📉 ↓ | SOVRENINS |
Year-To-Date Top Gainers and Losers (Nov 19, 2025)
| Gainer | YTD % | 5d % Chg | RSI | MACD | 15DMA vs 50DMA |
|---|---|---|---|---|---|
| NCR | +518.2% | +32.8% | 98.2 | 3.08 | 📈 ↑ |
| CAVERTON | +121.6% | +20.2% | 45.1 | -0.43 | 📈 ↑ |
| UACN | +107.3% | +13.8% | 46.3 | -2.49 | 📈 ↑ |
| STANBICETF30 | +142.5% | +20.3% | 81.58 | 68.46 | 📈 ↑ |
| SIAMLETF40 | -24.99% | +20.5% | 75.58 | 5.34 | 📈 ↑ |
| Loser | YTD % | 5d % Chg | RSI | MACD | 15DMA vs 50DMA |
| LIVINGTRUST | -23.3% | -18.8% | 30.4 | -0.18 | 📉 ↓ |
| DANGCEM | +11.7% | -10.0% | 26.0 | -5.52 | 📉 ↓ |
| ENAMELWA | +109.8% | -10.0% | 29.5 | 0.34 | 📉 ↓ |
| ABCTRANS | +179.7% | -9.9% | 22.4 | -0.07 | 📉 ↓ |
| CHELLARAM | +295.9% | -9.8% | 68.8 | 0.20 | 📉 ↓ |
- Several of today’s YTD top gainers (e.g., NCR, CAVERTON, STANBICETF30) are also among the day’s biggest movers, confirming a strong momentum effect—however, the cluster of high RSIs means short-term reversal risk is elevated.
- ABCTRANS, a YTD high-beta winner, is now deeply oversold, creating a setup for a contrarian bounce. Watch for bottoming signals if buyers emerge.
- Bearish momentum remains clear for LIVINGTRUST, DANGCEM, and ENAMELWA—RSIs near or below 30, with continued rejection of the 15DMA.
Contrarian Signals
- NCR: RSI at 98.2—massive overbought, yet price action remains strongly upward. MACD is bullish. Such divergence often appears at exhaustion tops and suggests trailing stops are prudent for momentum traders.
- SIAMLETF40 & STANBICETF30: Both ETFs are at technically overbought readings (RSI > 75/80), but momentum and MACD remain positive. Contrarians may start watching for profit-taking signals even as trend followers pile in.
- ABCTRANS: YTD large percentage gain but today’s deep sell-off with RSI below 25 – early signs of a potential reversal for aggressive value/momentum traders if short-term volume stabilizes.
Dividend-Beta Matrix: Defensive Opportunities
| Stock | Dividend Yield (%) | Beta | Momentum Table | Comment |
|---|---|---|---|---|
| MBENEFIT | 3.28 | 1.27 | Bullish (15DMA cross) | Yield plus momentum – good for total return seekers. |
| NASCON | 3.09 | 1.24 | Bullish (15DMA cross) | Defensive consumer play, yield plus uptrend. |
| WEMABANK | 5.81 | 1.25 | Bearish (15DMA downcross) | High yield, but technicals show caution needed short-term. |
| ROYALEX | 7.81 | 0.96 | Bearish (downcross) | High yield, but falling knife risk; bargain-hunting only for aggressive. |
Institutional Clustering Alerts
- ACCESSCORP captured 51.6% of institutional trade value—by far the dominant focus for "smart money" today, as its volume spiked to 1372% of its 90-day average.
- ZENITHBANK remains a key institutional interest (trade value 20.17%)—though price action is negative, keep on radar for potential support zones appeals to portfolio managers.
- ARADEL and GTCO also saw large institutional volumes, possibly indicating sector realignment or block trades underpinning activity.
Market Activity – Retail vs Institutional Trading Patterns
| Investor Type | Trade Count | Total Volume | Trade Value (₦) | % by Trade Count | % by Volume | % by Value |
|---|---|---|---|---|---|---|
| Institutional | 1,080 | 658.7M | 19.13B | 35.16% | 86.75% | 94.17% |
| Retail | 15,696 | 100.6M | 1.18B | 64.84% | 13.25% | 5.83% |
- Institutional trades overwhelmingly dominated volume and value with only 1k trades representing nearly 87% of volume and more than 94% of value—top names traded: ACCESSCORP, ARADEL, ZENITHBANK, GTCO, ELLAHLAKES.
- Retail activity is diffuse, heavily focused on perennial large caps like ZENITHBANK (923 trades), GTCO (620), ACCESSCORP (754).
- ACCESSCORP was the main magnet for both institutional and retail flow today, reflecting either a large program or block trades with aggressive retail piggybacking.
- Unusual volume spikes generally lined up with names with notable price moves (CAVERTON and TANTALIZER); these may attract more retail attention in coming days.
Trade Recommendations & Strategic Takeaways
- Momentum Traders: Existing strong-run gainers (NCR, STANBICETF30, SIAMLETF40, CAVERTON) are technically extended; trail stops closely and prepare for reversals as overbought readings build.
- Contrarian/Value: Monitor ABCTRANS and LIVINGTRUST—RSIs now in deep oversold; big YTD returns but short-term pain could be a springboard for sharp bounce if volumes come back.
- Yield Seekers: MBENEFIT, NASCON combine attractive dividends with bullish technicals; WEMABANK and ROYALEX yield is very high but technical downtrend makes them speculative for now.
- Institutional Watch: ACCESSCORP is the flow leader; when volumes spike this much, short-term overshoots common but also watch for institutional follow-through in coming days.
- Sector Rotation: Defensive sectors (consumer foods and insurance) are seeing bullish setups. Banks and small-caps are under pressure—wait for reversal patterns or stabilization before acting.
- General Caution: Falling volume and breadth, plus overbought conditions in leaders, point to a rising risk of correction or profit-taking.
Hidden Insights / Not-So-Obvious Patterns
- Multiple top gainers also appeared on the unusual volume list and in bullish technical breakouts (VETGRIF30, CAVERTON)—these overlaps tend to precede multi-day rallies, but also watch closely for exhaustion signals.
- ETF performance dominance today (VETGRIF30, SIAMLETF40, STANBICETF30) may indicate shifting institutional demand for broad market exposure or sector plays as opposed to single-stock risk.
- Many high dividend names are appearing in both bullish (MBENEFIT) and bearish (ROYALEX) lists—a classic barbell positioning signal, with investors seeking yield but also rotating between offense and defense as volatility rises.
- Institutional dominance in ACCESSCORP hints at potential corporate action, index inclusion, or major cross trades that might not be obvious to retail investors—closely monitor news flow around such stocks.
In Summary
Today’s market saw light volume and negative breadth, but significant momentum and volatility in financials and ETFs. Leadership remains concentrated in a handful of high-momentum gainers, many now in overbought territory—expect a potential "mean reversion" pullback soon, especially if turnover continues to contract. Defensive and yield stocks are gaining traction, but selectivity will be critical. Increased institutional clustering further emphasizes the importance of following money flow for short-term tactical moves.
|
Top ASI Gainers Over Last 5 Trading Days
|
Top ASI Losers Over Last 5 Trading Days
|
For more detailed analysis, on InfoWARE Market Data Terminal <NSEPERF> <GO>
On InfoWARE Finance Mobile App (Android, iPhone & iPad, Windows Phone and Windows 8/10), "Top Gainers & Losers"
VETIVA GRIFFIN 30 ETF (VETGRIF30) topped the advancers list closing at N60.61 with a gain of 10.00% followed by NCR (NIGERIA) PLC. (NCR) which closed at N34.00 with a gain of 9.85%.
On the flip side UNIVERSAL INSURANCE COMPANY PLC (UNIVINSURE) and LOTUS HALAL EQUITY ETF (LOTUSHAL15) topped the decliners log with a loss of -10.00% at a close of N1.17, and -9.99% to close the day at N76.70 respectively.
| Symbol | LClose | %Chg |
|---|---|---|
| VETGRIF30 | 60.61 | 10.00 |
| NCR | 34.00 | 9.85 |
| CAVERTON | 5.65 | 9.71 |
| SIAMLETF40 | 600.00 | 9.53 |
| STANBICETF30 | 894.80 | 9.34 |
| Symbol | LClose | %Chg |
|---|---|---|
| UNIVINSURE | 1.17 | -10.00 |
| LOTUSHAL15 | 76.70 | -9.99 |
| ABCTRANS | 3.44 | -9.95 |
| LIVINGTRUST | 3.36 | -9.92 |
| CHELLARAM | 14.65 | -9.85 |
For more detailed analysis,
- On InfoWARE Market Data Terminal <TOPG> <GO>
- On InfoWARE Finance Mobile App ( Android, iPhone & iPad and Windows 10) , "Top Gainers & Losers"
Currency Market
In the currency market, the Naira fell 0.29%(-4.18) against the Dollar to settle at 1 to 1NSE: Bull Signal - Price crossed above 15 Day MA
This signal implies these stocks are under buying pressure and the price might continue to rise and therefore positions should be monitored closely. Further suggested analysis include looking at the overall market (ASI) to see if the uptrend is market wide, sector wide or specific to the stock. Portfolio managers tend to use this as a signal to do more research to add to their positions or lock in some profits. Typically further analysis should be done using commands like PC and RV on the InfoWARE Market Data Terminal. Another command is ALERTS to set price triggers for possible exit or entry as necessary
For more detailed analysis,
- On InfoWARE Market Data Terminal <NSEPERF> <GO>
- On InfoWARE Finance Mobile App ( Android , iPhone & iPad and Windows 10) , "Top Gainers & Losers"
| Symbol | Price | %Chg | 15DMA | PE | EPS | DivY | MktCap | Vol | Trades | Value | LstTradeTime |
|---|---|---|---|---|---|---|---|---|---|---|---|
| FGSUK2031S4 | 95.96 | 19.72 | 85.29 | 0.00 | 0.00 | 2.00 | 2.00 | 1.92K | 19-Nov-2025 14:30:58.283 | ||
| FGS202892 | 100.00 | 11.21 | 92.85 | 0.00 | 0.00 | 450.00 | 1.00 | 450.00K | 19-Nov-2025 14:30:29.423 | ||
| VETGRIF30 | 60.61 | 9.09 | 55.68 | 0.00 | 0.00 | 10.71K | 14.00 | 600.05K | 19-Nov-2025 14:30:55.250 | ||
| MBENEFIT | 3.64 | 7.14 | 3.61 | 5.43 | 0.11 | 3.28 | 73.02B | 4.03M | 91.00 | 13.91M | 19-Nov-2025 14:30:18.470 |
| NESTLE | 1,780.00 | 2.81 | 1,770.33 | 20.58 | 41.31 | 4.29 | 1,410.93B | 751.71K | 121.00 | 1.34B | 19-Nov-2025 14:30:21.860 |
| WAPIC | 2.88 | 2.43 | 2.86 | 72.55 | 0.02 | 2.56 | 69.10B | 876.66K | 66.00 | 2.47M | 19-Nov-2025 14:30:25.580 |
| OANDO | 42.90 | 2.33 | 42.59 | 24.10 | 2.53 | 1.15 | 533.31B | 2.17M | 425.00 | 88.55M | 19-Nov-2025 14:30:22.170 |
| INTBREW | 12.10 | 1.24 | 11.96 | 0.00 | 0.00 | 6.23 | 325.03B | 940.83K | 72.00 | 11.51M | 19-Nov-2025 14:30:18.070 |
| NGXCNSMRGDS | 3,461.84 | 0.09 | 3,461.04 | 30.19 | 55.24 | 0.00 | 0.00 | 5.14M | 1,287.00 | 411.17M | 19-Nov-2025 14:30:29.930 |
| NASCON | 103.60 | 0.00 | 102.98 | 24.28 | 1.33 | 3.09 | 274.48B | 53.72K | 59.00 | 5.27M | 19-Nov-2025 14:30:18.727 |
| PZ | 39.60 | 0.00 | 39.59 | 44.17 | 0.50 | 4.59 | 157.23B | 553.40K | 132.00 | 21.90M | 19-Nov-2025 14:30:22.693 |
NSE: BEAR Signal - Price crossed below 15 Day MA
This signal implies these stocks are under selling pressure and the price might continue to slide and therefore positions should be monitored closely. Further suggested analysis include looking at the overall market (ASI) to see if the downtrend is market wide, sector wide or specific to the stock. If the overal market trend is upwards, then since these stocks are heading in the opposite direction, then further analysis should be done using commands like PC and RV on the InfoWARE Market Data Terminal. Another command is ALERTS to set price triggers for possible exit is necessar
For more detailed analysis,
- On InfoWARE Market Data Terminal <BEARM> <GO>
- On InfoWARE Finance Mobile App ( Android , iPhone & iPad and Windows 10)
| Symbol | Price | %Chg | 15DMA | PE | EPS | DivY | MktCap | Vol | Trades | Value | LstTradeTime |
|---|---|---|---|---|---|---|---|---|---|---|---|
| WEMABANK | 19.70 | -0.51 | 19.76 | 216.91 | 0.04 | 5.81 | 253.31B | 1.88M | 197.00 | 36.06M | 19-Nov-2025 14:30:25.617 |
| NEM | 29.05 | -2.58 | 29.13 | 24.99 | 0.37 | 6.52 | 145.73B | 1.27M | 62.00 | 35.68M | 19-Nov-2025 14:30:21.780 |
| CUTIX | 3.31 | -2.72 | 3.32 | 8.81 | 0.26 | 6.52 | 11.66B | 2.67M | 144.00 | 9.13M | 19-Nov-2025 14:30:16.877 |
| MAYBAKER | 16.80 | -4.46 | 17.39 | 58.94 | 0.14 | 3.75 | 28.98B | 2.29M | 98.00 | 36.78M | 19-Nov-2025 14:30:18.437 |
| INTENEGINS | 2.60 | -4.62 | 2.69 | 0.52 | 2.85 | 3.40 | 3.34B | 444.48K | 19.00 | 1.13M | 19-Nov-2025 14:30:18.110 |
| TIP | 11.10 | -4.95 | 11.36 | 0.00 | 9.88B | 3.70M | 194.00 | 41.41M | 19-Nov-2025 14:30:57.350 | ||
| FGSUK2027S3 | 89.00 | -6.66 | 93.41 | 0.00 | 0.00 | 222.00 | 3.00 | 191.01K | 19-Nov-2025 14:30:58.273 | ||
| SOVRENINS | 3.12 | -8.97 | 3.27 | 27.95 | 0.03 | 3.75 | 35.46B | 3.33M | 107.00 | 10.56M | 19-Nov-2025 14:30:23.340 |
| ROYALEX | 1.85 | -10.81 | 1.95 | 0.00 | 0.00 | 7.81 | 9.52B | 1.55M | 54.00 | 2.93M | 19-Nov-2025 14:30:22.847 |
| LOTUSHAL15 | 76.70 | -11.10 | 82.03 | 0.00 | 0.00 | 56.59K | 37.00 | 4.40M | 19-Nov-2025 14:30:58.077 |
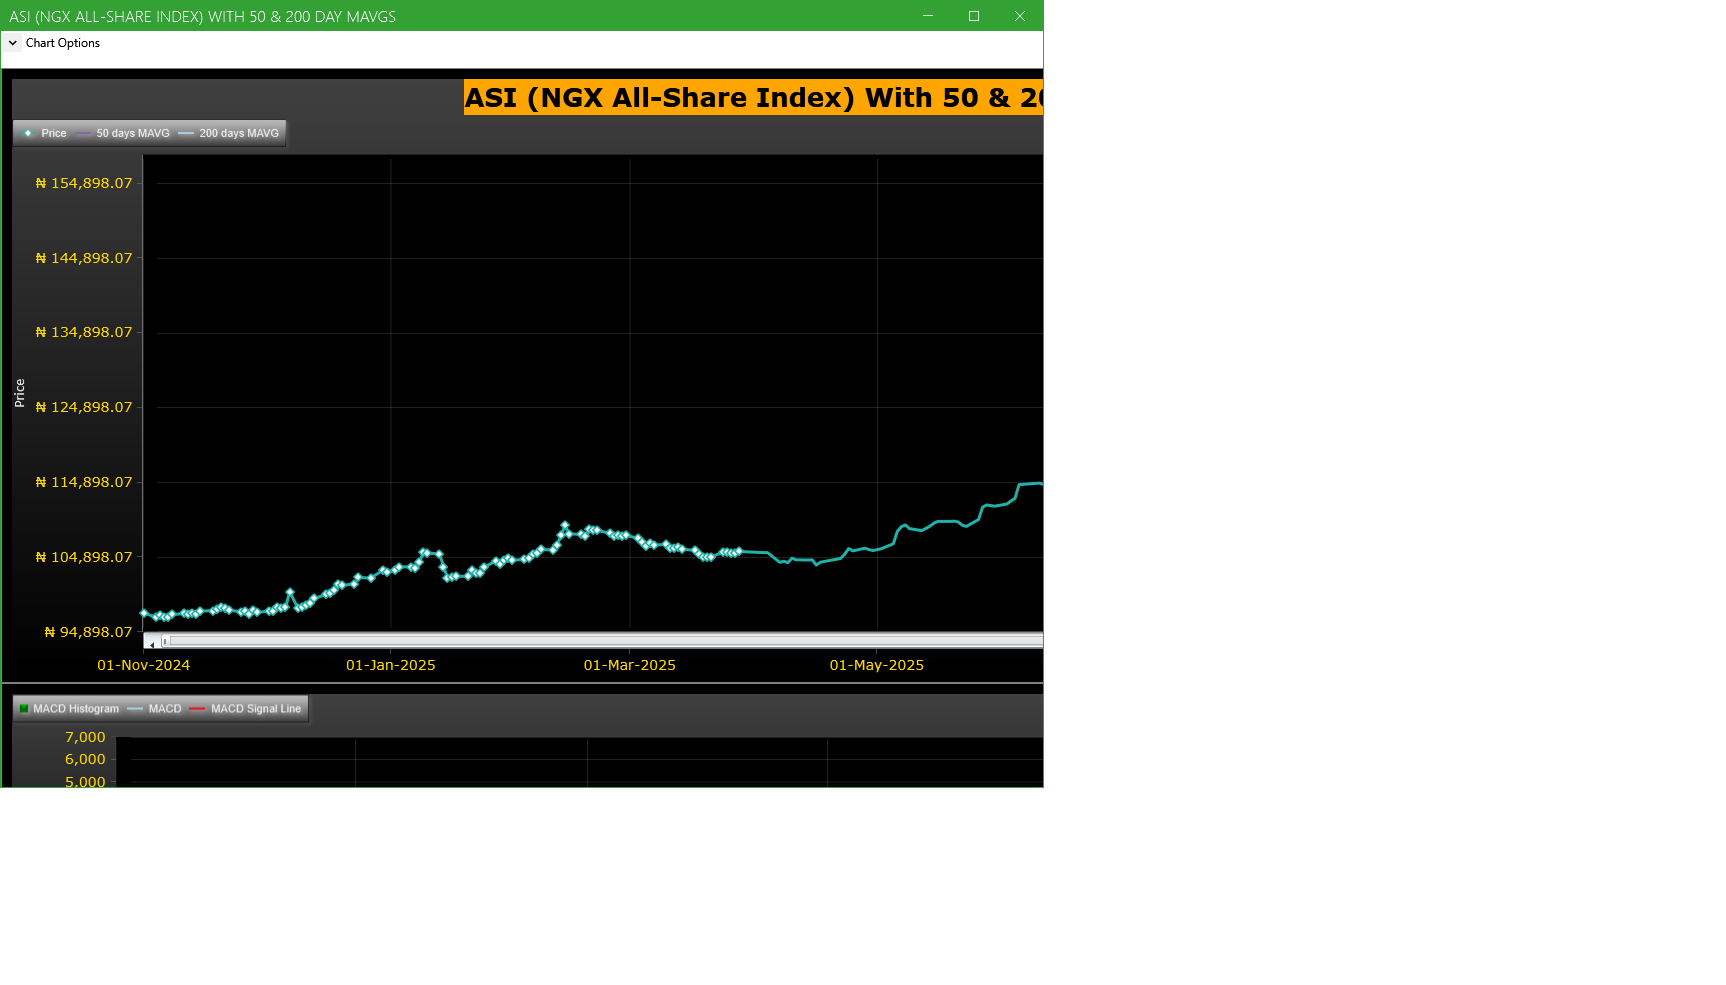
Market Trend - ASI (NGX All-Share-Index) With 50 & 200 Day MAvgs Chart
Technical traders typically use the 50 & 200 day moving averages to aid in choosing
where to enter or exit a position, which then causes these levels to act as strong
support or resistance. As a general guideline, if the price is above a moving average,
the trend is up. If the price is below a moving average, the trend is down.
It is important to note that critics of technical analysis say that moving averages act
as support and resistance because so many traders use these indicators to inform their
trading decisions. Also moving averages tend to work quite well in strong trending conditions
but poorly in choppy or ranging conditions.
Trading Strategies: Crossovers
Crossovers are one of the main moving average strategies. The first type is a price crossover,
which is when the price crosses above or below a moving average to signal a potential change
in trend. Another strategy is to apply two moving averages to a chart: one longer and one
shorter. When the shorter-term MA crosses above the longer-term MA, it is a buy signal, as
it indicates that the trend is shifting up. This is known as a golden cross. Meanwhile, when
the shorter-term MA crosses below the longer-term MA, it is a sell signal, as it indicates that
the trend is shifting down. This is known as a dead/death cross
For more detailed analysis,
- On InfoWARE Market Data Terminal <CI> <GO>
- On InfoWARE Finance Mobile App ( Android , iPhone & iPad and Windows 10) , "Research"
Unusual Volume: Volume traded is more than double the 90 day moving average (All exchanges; ASI & ASem). For more detailed analysis,
- On InfoWARE Market Data Terminal <UV> <GO>
- On InfoWARE Finance Mobile App ( Android , iPhone & iPad and Windows 10)
| Symbol | Name | Volume | 90DAvgVol | %VolChg | Price | LClose | %Chg | Trades | Value |
|---|---|---|---|---|---|---|---|---|---|
| ACCESSCORP | Access Holdings PLC | 488.36M | 33.16M | 1,372.91 | 21.65 | 22.00 | -1.59 | 999 | 10.57B |
| TANTALIZER | TANTALIZERS PLC | 70.91M | 7.60M | 833.52 | 2.77 | 2.58 | 7.36 | 707 | 195.28M |
| JAPAULGOLD | JAPAUL GOLD & VENTURES PLC | 54.05M | 17.07M | 216.62 | 2.18 | 2.23 | -2.24 | 116 | 117.35M |
| LINKASSURE | LINKAGE ASSURANCE PLC | 10.46M | 5.07M | 106.20 | 1.99 | 1.85 | 7.57 | 90 | 20.67M |
| CAVERTON | CAVERTON OFFSHORE SUPPORT GRP PLC | 4.40M | 1.98M | 122.08 | 5.65 | 5.15 | 9.71 | 138 | 24.67M |
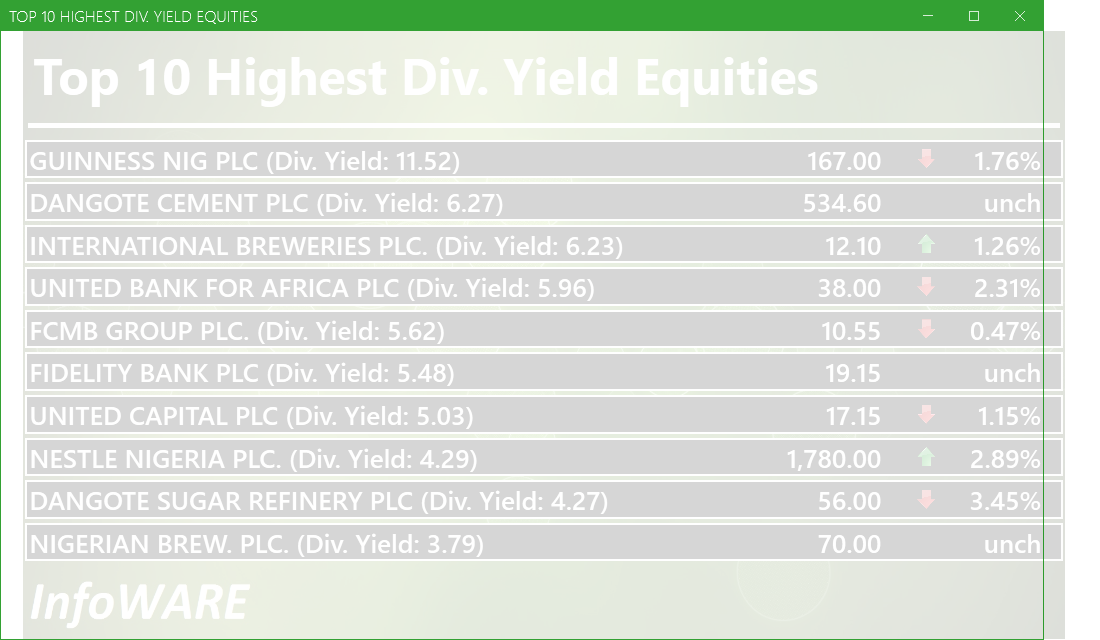
Investment Insights - High Div. Stocks
Dividend stocks distribute a portion of the company earnings to investors on a regular basis and they can a great choice for investors looking for regular income. As an investment or trading strategy, high dividend yield equities provide annual cash payments as against mostly capital gains in the price of a stock. The list in the table below represent the highest dividend paying stocks from the list of the most liquid stocks in the NSE top 30.
For more detailed analysis,
- On InfoWARE Market Data Terminal <HYIELD> <GO>
- On InfoWARE Finance Mobile App ( Android , iPhone & iPad and Windows 10) , "Research"
Investment Insights - Stocks outperforming the ASI but with approximately the same risk
These list of stocks represent equities that are less risky than the ASI but doing better than the ASI (All Shares Index) using the YTD (Year to Date) returns as the measure. The risk is measured by Beta. Beta is an assessment of a stock's tendency to undergo price changes, (its volatility), as well as its potential returns compared to the ASI. It is expressed as a ratio, where a score of 1 represents performance comparable to the ASI, and returns above or below the market may receive scores greater or lower than 1.
For a full list of both positively and negatively corelated stocks visit InfoWARE Market Data Terminal
- On InfoWARE Market Data Terminal <BANL> <GO>
- On InfoWARE Finance Mobile App ( Android , iPhone & iPad and Windows 10)
| Symbol | DivYield | PE | EPS | Beta | %ChgYTD | ASIYTDReturn | BetaDiff |
|---|---|---|---|---|---|---|---|
| HONYFLOUR | 1.40 | 16.28 | 0.31 | 0.99 | 166.62 | 40.19 | 0.01 |
| CAVERTON | 5.52 | 1.15 | 1.57 | 0.98 | 121.57 | 40.19 | 0.02 |
| ROYALEX | 7.81 | 0.00 | 0.00 | 0.96 | 68.18 | 40.19 | 0.04 |
| CORNERST | 5.28 | 8.62 | 0.35 | 0.93 | 54.04 | 40.19 | 0.07 |
| DEAPCAP | 13.76 | 188.84 | 0.01 | 0.89 | 45.00 | 40.19 | 0.11 |
| UNIVINSURE | 0.00 | 0.00 | 0.00 | 0.83 | 62.50 | 40.19 | 0.17 |
| FTNCOCOA | 1.60 | 0.00 | 0.00 | 0.79 | 180.32 | 40.19 | 0.21 |
| NB | 3.79 | 16.95 | 1.60 | 0.79 | 118.75 | 40.19 | 0.21 |
| MAYBAKER | 3.75 | 58.94 | 0.14 | 0.78 | 78.72 | 40.19 | 0.22 |
| UNILEVER | 2.81 | 67.09 | 0.40 | 0.75 | 102.78 | 40.19 | 0.25 |
African Markets
| Name | LClose | Change | %Chg |
|---|---|---|---|
| BRVM Stock Exchange | 340.16 | -0.27 | -0.08 |
| Botswana Stock Exchange | 10,639.74 | 0.00 | 0.00 |
| Egyptian Exchange | 40,501.28 | -562.57 | -1.37 |
| Ghana Stock Exchange | 8,420.94 | 6.73 | 0.08 |
| Johannesburg Stock Exchange | 110,391.90 | -1,920.54 | -1.71 |
| Lusaka Stock Exchange | 25,882.06 | -15.54 | -0.06 |
| Malawi Stock Exchange | 636,566.62 | 0.00 | 0.00 |
| Nigeria Stock Exchange | 144,986.51 | -174.19 | -0.12 |
| Nairobi Securities Exchange | 187.69 | -0.17 | -0.09 |
| Namibian Stock Exchange | 1,976.95 | -43.64 | -2.16 |
| Rwanda Stock Exchange | 179.12 | -0.04 | -0.02 |
| Tunis Stock Exchange | 13,140.57 | 32.77 | 0.25 |
| Uganda Securities Exchange | 1,571.96 | -2.68 | -0.17 |
Nigeria Market Indexes
| Symbol | LClose | %Chg | WTD% | MTD% | QTD% | YTD% | MktCap | Trades |
|---|---|---|---|---|---|---|---|---|
| ASI | 144,646.01 | -0.23 | -0.35 | -5.91 | 1.17 | 40.19 | 10,851 | |
| NGX30 | 5,290.10 | -0.30 | -0.39 | -6.17 | 1.38 | 38.67 | 6,396 | |
| NGXAFRBVI | 3,114.03 | -1.76 | -3.12 | -6.16 | -12.27 | 25.53 | 2,234 | |
| NGXAFRHDYI | 20,519.19 | -1.17 | -2.13 | -5.86 | -7.82 | 20.51 | 2,859 | |
| NGXASEM | 1,392.88 | 0.00 | 0.00 | 0.00 | -9.44 | -12.05 | 3 | |
| NGXBNK | 1,383.41 | -1.22 | -2.11 | -5.45 | -8.79 | 27.22 | 3,003 | |
| NGXCG | 3,854.64 | -0.81 | -1.36 | -5.70 | -4.84 | 36.24 | 5,442 | |
| NGXCNSMRGDS | 3,461.84 | 0.09 | 0.06 | -2.53 | 2.34 | 99.60 | 1,287 | |
| NGXCOMMDTY | 1,182.74 | -0.18 | -0.18 | -2.07 | 5.43 | 18.27 | 781 | |
| NGXGROWTH | 13,925.92 | -2.24 | -3.33 | -10.20 | -7.60 | 79.39 | 205 | |
| NGXINDUSTR | 5,234.86 | 0.00 | 0.00 | -12.10 | 3.30 | 46.57 | 959 | |
| NGXINS | 1,152.26 | -1.35 | -1.22 | -5.01 | -3.67 | 46.56 | 575 | |
| NGXLOTUSISLM | 12,860.39 | -0.20 | -0.21 | -5.52 | 8.33 | 84.57 | 2,369 | |
| NGXMAINBOARD | 7,080.15 | -0.13 | -0.10 | -3.39 | 0.50 | 41.49 | 7,471 | |
| NGXMERIGRW | 10,026.60 | -0.46 | -0.74 | -2.84 | 1.25 | 53.71 | 1,590 | |
| NGXMERIVAL | 12,390.90 | -1.32 | -2.61 | -4.91 | -7.31 | 18.80 | 2,342 | |
| NGXOILGAS | 2,734.60 | -0.18 | -0.22 | -2.27 | 8.26 | 0.86 | 682 | |
| NGXPENBRD | 2,706.86 | -0.28 | -0.40 | -5.73 | 2.10 | 47.78 | 8,759 | |
| NGXPENSION | 6,613.71 | -0.69 | -0.98 | -4.90 | -1.84 | 45.87 | 6,863 | |
| NGXPREMIUM | 14,089.22 | -0.40 | -0.80 | -10.32 | 2.90 | 44.76 | 3,047 | |
| NGXSOVBND | 669.17 | 0.00 | 0.00 | 0.12 | 1.81 | 11.24 | 1 |
For more detailed analysis,
- On InfoWARE Market Data Terminal <MKTINS> <GO>
- On InfoWARE Finance Mobile App ( Android, iPhone & iPad and Windows 10) , "Market Indexes"
Find the topic interesting? Will like to comment? Contact Us at solutions@infowarelimited.com
Top News

Chart Of The Day - ASI Chart Vs ASI Advance Decline Line (YTD) (19-Nov-2025 15:07:23.291)
InfoWARE AI Analyst Daily Market Report: 19-Nov-2025

[XNSA]>> CORDROS MILESTONE FUNDS' BID & OFFER PRICES
[MERGROWTH]>> DAILT INDICATIVE PRICES
[XNSA]>> NGX FIXED INCOME INDICATIVE PRICE LIST FOR NOV 19, 2025
[VETGOODS]>> DAILY INDICATIVE PRICES
[XNSA]>> AELP CAPACITY BUILDING & ASSDA FORUM
[XNSA]>>GO-LIVE NOTIFICATION: TRANSITION TO T+2 SETTLEMENT CYCLE
[STANBICETF]>> DAILY INDICATIVE PRICES
Chart Of The Day - ASI Chart Vs ASI Advance Decline Line (YTD) (18-Nov-2025 15:22:22.218)
InfoWARE AI Analyst Daily Market Report: 18-Nov-2025
[MERVALUE]>> DAILY INDICATIVE PRICES
[XNSA]>> OFF MARKET TRADE
[LOTUSHAL15]>> DAILY INDICATIVE PRICES
[VSPBONDETF]>> DAILY INDICATIVE PRICES
[XNSA]>> DAILY FUND PRICE SUBMISSION - FCMB ASSET MANAGEMENT LIMITED
[XNSA]>> H2 2025 BC/DR TEST
[XNSA]>> AELP CAPACITY BUILDING & ASSDA FORUM
[XNSA]>> NGX FIXED INCOME INDICATIVE PRICE LIST FOR NOV 18, 2025
[SIAMLETF40]>> DAILY INDICATIVE PRICES
[XNSA]>>GO-LIVE NOTIFICATION: TRANSITION TO T+2 SETTLEMENT CYCLE
[XNSA]>> CORDROS MILESTONE FUNDS' BID & OFFER PRICES
Chart Of The Day - ASI Chart Vs ASI Advance Decline Line (YTD) (17-Nov-2025 15:20:25.906)
InfoWARE AI Analyst Daily Market Report: 17-Nov-2025
[MERGROWTH]>> DAILY INDICATIVE PRICES
[VETINDETF]>> DAILY INDICATIVE PRICES
[LOTUSHAL15]>> DAILY INDICATIVE PRICES
[XNSA]>> NGX FIXED INCOME INDICATIVE PRICE LIST FOR NOV 17, 2025
[XNSA]>> H2 2025 BC/DR TEST
[XNSA]>> AELP CAPACITY BUILDING & ASSDA FORUM
Get IDIA - the stock trading app for the modern investor
Solutions by Business
Product Suites
Company
Contacts
- 8th Floor,
- South Atlantic Petroleum Towers,
- 1 Adeola Odeku Street,
- Victoria Island,
- Lagos, Nigeria.
- Email: solutions@infowarelimited.com
Follow Us
 |
 |
 |
 |