


InfoWARE AI Analyst Daily Market Report: 21-Nov-2025 | InfoWARE Finance
Get IDIA - the stock trading app for the modern investor


InfoWARE AI Analyst Daily Market Report: 21-Nov-2025
(Source: InfoWARE Terminal, Date: 21-Nov-2025)
Dear Investor,
NGX Market Close: Friday, November 21, 2025
The Nigerian stock market took a breather today, with the NGX All Share Index (ASI) losing -0.27% to close at 144,187.03. Despite the dip, the ASI's year-to-date (YTD) return remains robust at 39.36%. Market turnover soared to ₦24.86 billion—a massive +190.14% increase—on volume of 638.20 million shares (up from 337.92 million yesterday). However, breadth was bearish with just 17 advancers against 47 decliners (market breadth ratio: 0.36x), as select stocks powered unusually high volumes amid broad-based selling pressure. Meanwhile, the Naira weakened against the Dollar, closing at 1,452 (-0.36%).
Market Breadth & Key Trends
- Breadth Remains Weak: Just 17 gainers versus 47 losers signals a strong risk-off sentiment; the market’s upward momentum from earlier this week is stalling.
- Turnover Surged: Despite a negative overall close, turnover saw a dramatic jump (+190.14%), primarily driven by large institutional block trades in the banking and financial sectors.
- Volume Spike: 66 companies posted higher volume today (vs. 75 down), but most price action slanted to the downside—suggesting that sellers dominated flows.
Top Gainers & Losers
| Gainer | Price | % Change | RSI | Insight |
|---|---|---|---|---|
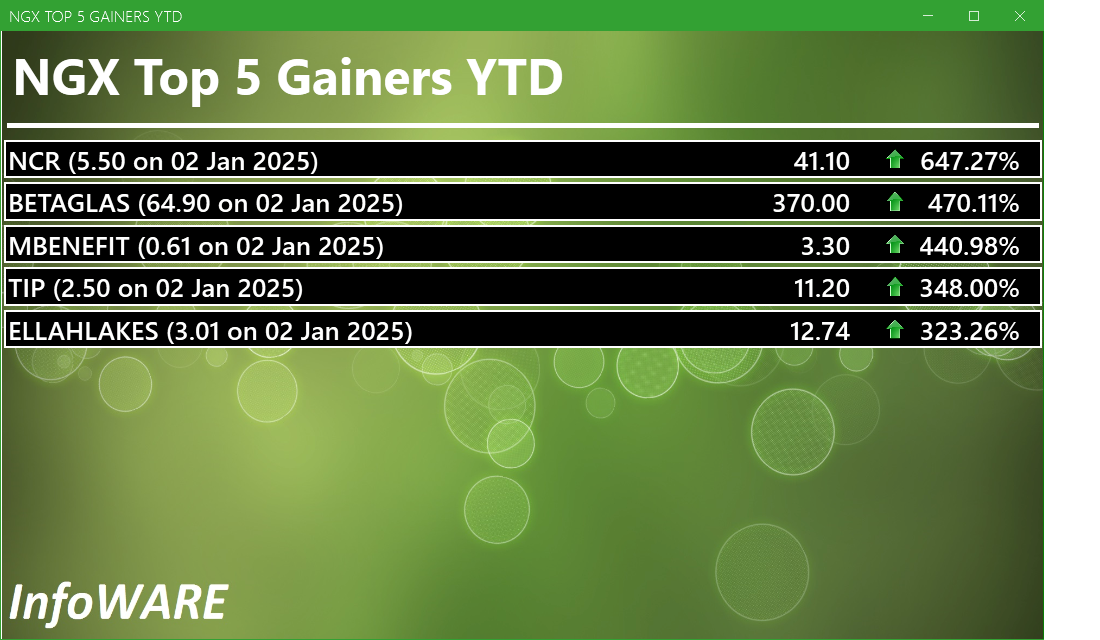
| NCR | 41.10 | +9.89% | 98.85 | Extreme overbought—RSI & MACD signal potential climactic bullishness. Up +647.3% YTD, riding rapid momentum, but caution is warranted at these levels. |
| NEIMETH | 5.40 | +9.09% | 34.02 | Returned to bullish territory; closed above 15DMA, signaling a possible turnaround after recent weakness. Watch for sustained follow-through. |
| MAYBAKER | 17.05 | +8.60% | 37.65 | Bounced with low RSI—potential early reversal after oversold period. |
| Loser | Price | % Change | RSI | Insight |
| RTBRISCOE | 3.15 | -10.00% | 54.66 | Broke below 15DMA. Not oversold yet, but momentum rolling over. Volatility remains high; traders should be cautious. |
| LEGENDINT | 5.26 | -9.93% | 53.43 | Both 1-day loss and YTD down (-15.16%); crossed below short-term MA. Bearish momentum persists. |
| NAHCO | 99.15 | -9.78% | 51.04 | Bearish price/MACD breakdown. High dividend (6.66%), but technicals weak. |
Market & Stock-Specific Insights
-
Turnover Implications:
- Institutional Clustering: 94.5% of daily value came from institutional trades—indicative of portfolio rebalancing or profit booking heading into the weekend.
- Caution: Such spikes are often seen at inflection points—watch for possible short-term mean reversion.
-
Advancers vs Decliners:
- A heavily lopsided breadth often foreshadows further volatility. The low advancers to decliners ratio signals continued caution.
-
Unusual Volume Standouts:
- UACN: Traded over 22x its average volume, up 2.49%; watch for renewed institutional positioning.
- ZENITHBANK & ACCESSCORP: Block trades by institutions (255% and 218% volume surge, respectively), both with negative short-term price moves and fragile technicals. This may be profit-taking or early repositioning.
-
YTD Top Gainers:
- NCR headlines with +647% YTD and a blistering RSI of 98.9. High risk of near-term pullback, though momentum remains fierce.
- CAVERTON and UACN (YTD: +115.7% and +112.4% respectively) both traded on surging volumes—indicative of institutional rotation into secular outperformers.
-
YTD Top Losers:
- INTENEGINS, LEGENDINT, LINKASSURE, and ROYALEX all feature in both daily, weekly, and YTD loser lists, with continuing price/MACD breakdowns, indicating persistent structural weakness.
-
Bullish & Bearish Momentum:
- NEIMETH & JBERGER signaled bullish cross above 15DMA, but only NEIMETH enjoyed outperformance (up 9.09%). NEIMETH’s RSI is below 40—bullish divergence forming.
- Bearish breakdowns (below 15DMA): NAHCO, LEGENDINT, RTBRISCOE, LINKASSURE, all present in both loss tables and bearish momentum, confirming a strong trend lower.
Contrarian Signals (Conflicting Indicators)
- NCR: While price and RSI are strongly overbought, the MACD remains bullish, yet at such elevated RSI, mean reversion is increasingly likely.
- RTBRISCOE: Despite a -10% daily loss and bearish breakdown below 15DMA, RSI sits neutral (54.66), not yet signaling "oversold"; potential for a short-term technical bounce exists.
- NAHCO: Price fell sharply, crossed below 15DMA & MACD negative, but still offers a high dividend yield (6.66%)—some value-oriented investors might start building positions even as technicals warn of further downside.
- LEGENDINT: Strongly negative YTD and today, but MACD histogram positive and RSI not oversold (53.43) suggests trend exhaustion could be near.
Sector Heatmap & Technical Trends
| Sector | Turnover (%) | Key Movers | Avg % Chg | Momentum |
|---|---|---|---|---|
| Banking | 58% | ZENITHBANK, GTCO, ACCESSCORP, UBA | -1.1% | Bearish – heavy block trading, larger declines. |
| Insurance | 7% | MBENEFIT, NEIMETH, LINKASSURE | -4.7% | Bearish – several names below 15DMA, most with soft RSI. |
| Diversified Industries | 21% | UACN, NCR | +5.6% | Bullish momentum in select stocks (NCR, UACN) |
| Transport/Logistics | 5% | NAHCO | -9.8% | Bearish breakdown |
| Telecom | 3% | MTNN | -1.06% | Neutral to negative, mixed signals |
Dividend-Beta Matrix – Defensive Picks
| Stock | Div. Yield (%) | Beta | Insight |
|---|---|---|---|
| AFRIPRUD | 1.27 | 0.64 | Classic defensive: modest yield, sub-market risk. |
| NAHCO | 6.66 | 0.65 | High yield, low beta, but near-term negative momentum. |
| NEIMETH | 3.38 | 0.25 | Low beta, decent yield, gaining bullish momentum now. |
| ZENITHBANK | 2.25 | 1.20 | Leader for income, higher beta tied to big bank swings. |
Institutional Clustering Alerts
- ZENITHBANK: 20.17% of institutional value trade today (₦5.45B), amid bearish technicals; potential smart money reallocation or sector rotation.
- UACN: Over 22x average volume, strong move up, points to new institutional inflows and signals renewed interest in diversified industries.
High-Yield Stocks in Momentum Tables
- NAHCO: Appears in both bearish momentum and high dividend yield; while the yield is attractive, technicals suggest waiting for stabilization before new entries.
- NEIMETH: Back in bullish table with improving technicals and a 3.38% yield; could see defensive/income-oriented buying resume.
- LINKASSURE & ROYALEX: Both have fallen sharply, broken below moving averages, yet offer attractive yields. These may serve as watchlist names for contrarians looking for reversion if selling abates.
Suggestions for Traders
- For Momentum Traders: Watch NCR for an imminent reversal signal after an outsized run-up (RSI far above 90).
- Bargain Hunters: Stocks like INTENEGINS, LEGENDINT, LINKASSURE, ROYALEX are deep in the red YTD, technicals are challenged—wait for basing action before attempting "bottom-fishing.”
- Income Seekers: NEIMETH and NAHCO offer strong yield, but assess entry carefully—ideally wait for trend reversal/bottom confirmation.
- Sector Rotators: More money is moving into Diversified Industries (UACN), while major banks are experiencing both heavy volumes and profit booking.
- Diversify Positions: Defensive names with lower betas and positive momentum (e.g., NEIMETH, AFRIPRUD) may help buffer volatility seen in banking/insurance.
Market Activity Analysis
| Investor Type | Trade Count | Volume | Gross Value | Trade Count % | Volume % | Value % |
|---|---|---|---|---|---|---|
| Institutional | 1,725 | 535.06M | ₦24.18B | 35.3% | 81.5% | 94.5% |
| Retail | 17,234 | 121.88M | ₦1.42B | 64.7% | 18.5% | 5.5% |
- Institutional investors dominated trading by value and volume, despite comprising only ~35% of trade counts; expect "smart money" moves to drive near-term price action, especially in heavily-traded stocks like ZENITHBANK and UACN.
- Among institutions, the top traded symbols were ZENITHBANK, GTCO, ACCESSCORP, MTNN, and ARADEL—pointing to focus on liquid, blue-chip names and block trades. Many had high volume but negative-to-neutral price action; look for volatility ahead.
- Retail activity was more scattered, with ACCESSCORP, ZENITHBANK, MTNN, GTCO, and UBA as most traded—overlap exists, but retail is likely following liquidity rather than leading price trends.
- Pattern: Banks remain the ground zero for both institutional and retail trades, but with clear profit-taking or rotation underway.
Hidden & Subtle Insights
- Volatility Alert: Major block trades in the banking sector with stagnant or slumping prices (e.g., ZENITHBANK, ACCESSCORP) point to institutional rotation and could presage a sector pullback or shift to more defensive/industrial names.
- Momentum Extremes: Stocks posting RSI readings above 90 (NCR) almost always revert in the short-term—tighten stops or scale profits on overbought names.
- Overlap Watch: Several names (LEGENDINT, NAHCO, RTBRISCOE) are concurrently in daily, weekly, YTD losers and bearish technical tables—these are "momentum traps” to avoid until firm reversal signals manifest.
- Unusual Volume as Smart Money Signal: Surges in UACN and ZENITHBANK volume—first upward, second downward—could mark incipient sector or stock-specific leadership change post week’s end.
- Defensive Rotation: Expect continued flows into low-beta, high-yield names as macro volatility persists.
|
Top ASI Gainers Over Last 5 Trading Days
|
Top ASI Losers Over Last 5 Trading Days
|
For more detailed analysis, on InfoWARE Market Data Terminal <NSEPERF> <GO>
On InfoWARE Finance Mobile App (Android, iPhone & iPad, Windows Phone and Windows 8/10), "Top Gainers & Losers"
NCR (NIGERIA) PLC. (NCR) topped the advancers list closing at N41.10 with a gain of 9.89% followed by IKEJA HOTEL PLC (Ikejahotel) which closed at N20.85 with a gain of 9.74%.
On the flip side R T BRISCOE PLC. (RTBRISCOE) and LEGEND INTERNET PLC (LEGENDINT) topped the decliners log with a loss of -10.00% at a close of N3.15, and -9.93% to close the day at N5.26 respectively.
| Symbol | LClose | %Chg |
|---|---|---|
| NCR | 41.10 | 9.89 |
| Ikejahotel | 20.85 | 9.74 |
| NEIMETH | 5.40 | 9.09 |
| MAYBAKER | 17.05 | 8.60 |
| REGALINS | 1.13 | 6.60 |
| Symbol | LClose | %Chg |
|---|---|---|
| RTBRISCOE | 3.15 | -10.00 |
| LEGENDINT | 5.26 | -9.93 |
| INTENEGINS | 2.12 | -9.79 |
| NAHCO | 99.15 | -9.78 |
| LINKASSURE | 1.68 | -9.68 |
For more detailed analysis,
- On InfoWARE Market Data Terminal <TOPG> <GO>
- On InfoWARE Finance Mobile App ( Android, iPhone & iPad and Windows 10) , "Top Gainers & Losers"
Currency Market
In the currency market, the Naira fell 0.36%(-5.14) against the Dollar to settle at 1 to 1Investment Insights - Top 5 Gainers YTD
These stocks are the best performers whose price has risen faster than the market as a whole with the best returns year to date. Momentum investors believe that stocks that have outperformed the market will often continue to do so because the factors that caused them to outperform will not suddenly disappear. In addition, other investors seeking to benefit from the stock’s outperformance will often purchase the stock, further bidding its price higher and pushing the stock higher still
For more detailed analysis,
- On InfoWARE Market Data Terminal <T5YTD2> <GO>
- On InfoWARE Finance Mobile App ( Android , iPhone & iPad and Windows 10) , "Research"
NSE: Bull Signal - Price crossed above 15 Day MA
This signal implies these stocks are under buying pressure and the price might continue to rise and therefore positions should be monitored closely. Further suggested analysis include looking at the overall market (ASI) to see if the uptrend is market wide, sector wide or specific to the stock. Portfolio managers tend to use this as a signal to do more research to add to their positions or lock in some profits. Typically further analysis should be done using commands like PC and RV on the InfoWARE Market Data Terminal. Another command is ALERTS to set price triggers for possible exit or entry as necessary
For more detailed analysis,
- On InfoWARE Market Data Terminal <NSEPERF> <GO>
- On InfoWARE Finance Mobile App ( Android , iPhone & iPad and Windows 10) , "Top Gainers & Losers"
| Symbol | Price | %Chg | 15DMA | PE | EPS | DivY | MktCap | Vol | Trades | Value | LstTradeTime |
|---|---|---|---|---|---|---|---|---|---|---|---|
| NEIMETH | 5.40 | 8.33 | 5.38 | 125.52 | 0.02 | 3.38 | 23.07B | 1.06M | 112.00 | 5.63M | 21-Nov-2025 14:30:22.503 |
| JBERGER | 147.00 | 5.99 | 140.95 | 16.73 | 10.31 | 1.74 | 235.20B | 283.00K | 107.00 | 40.56M | 21-Nov-2025 14:30:21.133 |
| FGSUK2033S6 | 100.50 | 2.49 | 100.03 | 0.00 | 0.00 | 8.05K | 3.00 | 8.09M | 21-Nov-2025 14:31:09.293 | ||
| TIP | 11.20 | 1.34 | 11.12 | 0.00 | 9.97B | 1.49M | 109.00 | 16.44M | 21-Nov-2025 14:31:07.563 | ||
| NB | 68.50 | 0.00 | 68.44 | 16.95 | 1.60 | 3.79 | 703.92B | 670.00K | 152.00 | 44.11M | 21-Nov-2025 14:30:22.347 |
| WAPCO | 134.00 | 0.00 | 133.86 | 24.60 | 2.87 | 2.70 | 2,158.44B | 776.96K | 181.00 | 102.63M | 21-Nov-2025 14:31:05.760 |
NSE: BEAR Signal - Price crossed below 15 Day MA
This signal implies these stocks are under selling pressure and the price might continue to slide and therefore positions should be monitored closely. Further suggested analysis include looking at the overall market (ASI) to see if the downtrend is market wide, sector wide or specific to the stock. If the overal market trend is upwards, then since these stocks are heading in the opposite direction, then further analysis should be done using commands like PC and RV on the InfoWARE Market Data Terminal. Another command is ALERTS to set price triggers for possible exit is necessar
For more detailed analysis,
- On InfoWARE Market Data Terminal <BEARM> <GO>
- On InfoWARE Finance Mobile App ( Android , iPhone & iPad and Windows 10)
| Symbol | Price | %Chg | 15DMA | PE | EPS | DivY | MktCap | Vol | Trades | Value | LstTradeTime |
|---|---|---|---|---|---|---|---|---|---|---|---|
| UNIVINSURE | 1.16 | -3.45 | 1.17 | 0.00 | 0.00 | 0.00 | 18.56B | 3.69M | 64.00 | 4.35M | 21-Nov-2025 14:30:25.320 |
| GUINEAINS | 1.15 | -5.22 | 1.17 | 66.79 | 0.01 | 1.96 | 7.06B | 1.43M | 39.00 | 1.67M | 21-Nov-2025 14:30:20.397 |
| CWG | 16.05 | -5.61 | 16.36 | 0.00 | 0.00 | 2.46 | 40.52B | 6.99M | 180.00 | 108.69M | 21-Nov-2025 14:30:18.823 |
| DEAPCAP | 1.61 | -8.70 | 1.73 | 188.84 | 0.01 | 13.76 | 2.42B | 2.56M | 34.00 | 4.16M | 21-Nov-2025 14:30:19.127 |
| NSLTECH | 0.80 | -8.75 | 0.81 | 0.00 | 0.00 | 15.87 | 4.51B | 2.15M | 95.00 | 1.76M | 21-Nov-2025 14:30:22.920 |
| ROYALEX | 1.82 | -9.34 | 1.93 | 0.00 | 0.00 | 7.81 | 9.36B | 5.24M | 83.00 | 9.66M | 21-Nov-2025 14:30:23.510 |
| LOTUSHAL15 | 75.00 | -10.53 | 82.88 | 0.00 | 0.00 | 4.78K | 20.00 | 413.68K | 21-Nov-2025 14:31:09.100 | ||
| LINKASSURE | 1.68 | -10.71 | 1.80 | 59.89 | 0.02 | 5.56 | 23.52B | 18.08M | 122.00 | 33.18M | 21-Nov-2025 14:30:21.480 |
| VETINDETF | 56.00 | -10.71 | 58.55 | 0.00 | 0.00 | 4.67K | 8.00 | 277.11K | 21-Nov-2025 14:31:05.523 | ||
| NAHCO | 99.15 | -10.84 | 105.48 | 92.98 | 0.41 | 6.66 | 193.25B | 1.74M | 182.00 | 173.10M | 21-Nov-2025 14:30:22.170 |
| LEGENDINT | 5.26 | -11.03 | 5.53 | 0.00 | 0.00 | 4.92M | 94.00 | 26.77M | 21-Nov-2025 14:30:21.430 | ||
| RTBRISCOE | 3.15 | -11.11 | 3.28 | 0.00 | 0.00 | 4.35 | 3.71B | 4.34M | 89.00 | 13.72M | 21-Nov-2025 14:30:23.557 |
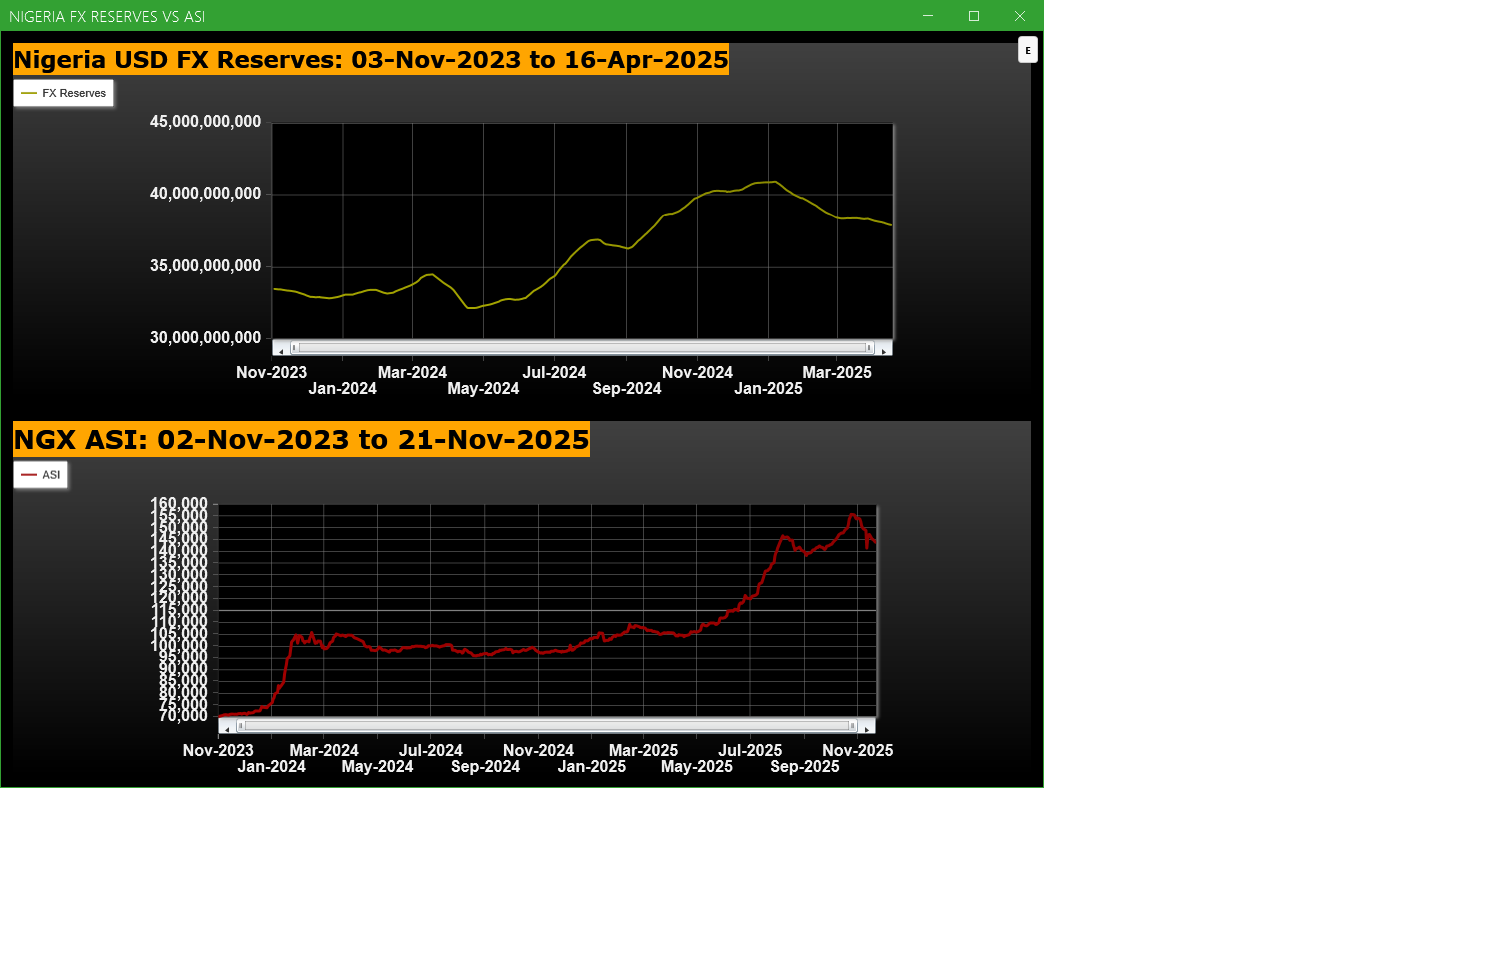
Economic Indicators - Nigeria FX Reserves Vs ASI Chart
Nigeria FX Reserves are assets held on reserve by CBN in foreign currencies. These reserves are used to back liabilities and influence monetary policy. Given the nature of the Nigeria economy, FX Reserves can appear to have an outsize influence on the economy and hence on the capital market. The chart below allows comparison of FX Reserves against the ASI to make investment decisions
For more detailed analysis,
- On InfoWARE Market Data Terminal <CI> <GO>
- On InfoWARE Finance Mobile App ( Android , iPhone & iPad and Windows 10) , "Research"
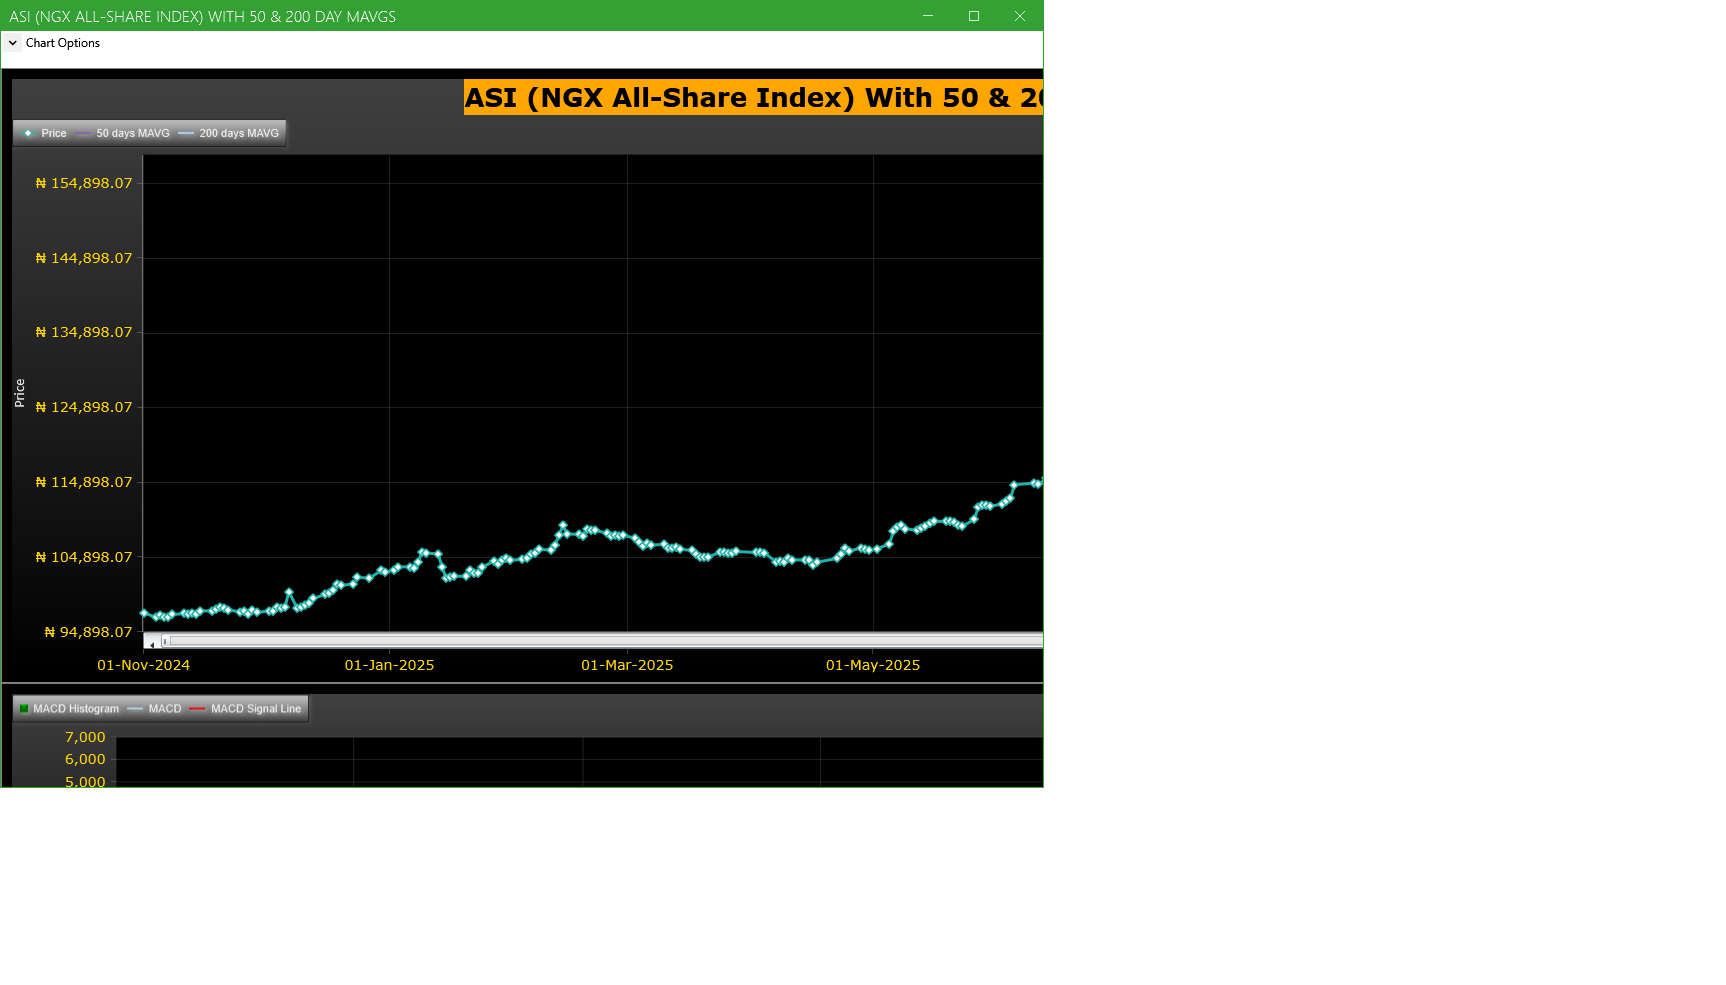
Market Trend - ASI (NGX All-Share-Index) With 50 & 200 Day MAvgs Chart
Technical traders typically use the 50 & 200 day moving averages to aid in choosing
where to enter or exit a position, which then causes these levels to act as strong
support or resistance. As a general guideline, if the price is above a moving average,
the trend is up. If the price is below a moving average, the trend is down.
It is important to note that critics of technical analysis say that moving averages act
as support and resistance because so many traders use these indicators to inform their
trading decisions. Also moving averages tend to work quite well in strong trending conditions
but poorly in choppy or ranging conditions.
Trading Strategies: Crossovers
Crossovers are one of the main moving average strategies. The first type is a price crossover,
which is when the price crosses above or below a moving average to signal a potential change
in trend. Another strategy is to apply two moving averages to a chart: one longer and one
shorter. When the shorter-term MA crosses above the longer-term MA, it is a buy signal, as
it indicates that the trend is shifting up. This is known as a golden cross. Meanwhile, when
the shorter-term MA crosses below the longer-term MA, it is a sell signal, as it indicates that
the trend is shifting down. This is known as a dead/death cross
For more detailed analysis,
- On InfoWARE Market Data Terminal <CI> <GO>
- On InfoWARE Finance Mobile App ( Android , iPhone & iPad and Windows 10) , "Research"
Unusual Volume: Volume traded is more than double the 90 day moving average (All exchanges; ASI & ASem). For more detailed analysis,
- On InfoWARE Market Data Terminal <UV> <GO>
- On InfoWARE Finance Mobile App ( Android , iPhone & iPad and Windows 10)
| Symbol | Name | Volume | 90DAvgVol | %VolChg | Price | LClose | %Chg | Trades | Value |
|---|---|---|---|---|---|---|---|---|---|
| ACCESSCORP | Access Holdings PLC | 128.69M | 40.41M | 218.44 | 20.50 | 21.00 | -2.38 | 1,289 | 2.65B |
| ZENITHBANK | ZENITH INTERNATIONAL BANK PLC | 91.50M | 25.75M | 255.34 | 59.75 | 59.85 | -0.17 | 1,232 | 5.45B |
| UACN | U A C N PLC. | 74.37M | 3.23M | 2,202.54 | 70.00 | 68.30 | 2.49 | 243 | 5.18B |
| GTCO | GUARANTY TRUST HOLDING COMPANY PLC | 48.43M | 21.69M | 123.32 | 84.50 | 84.00 | 0.60 | 883 | 4.07B |
| MBENEFIT | MUTUAL BENEFITS ASSURANCE PLC. | 23.63M | 7.39M | 219.90 | 3.30 | 3.40 | -2.94 | 130 | 77.88M |
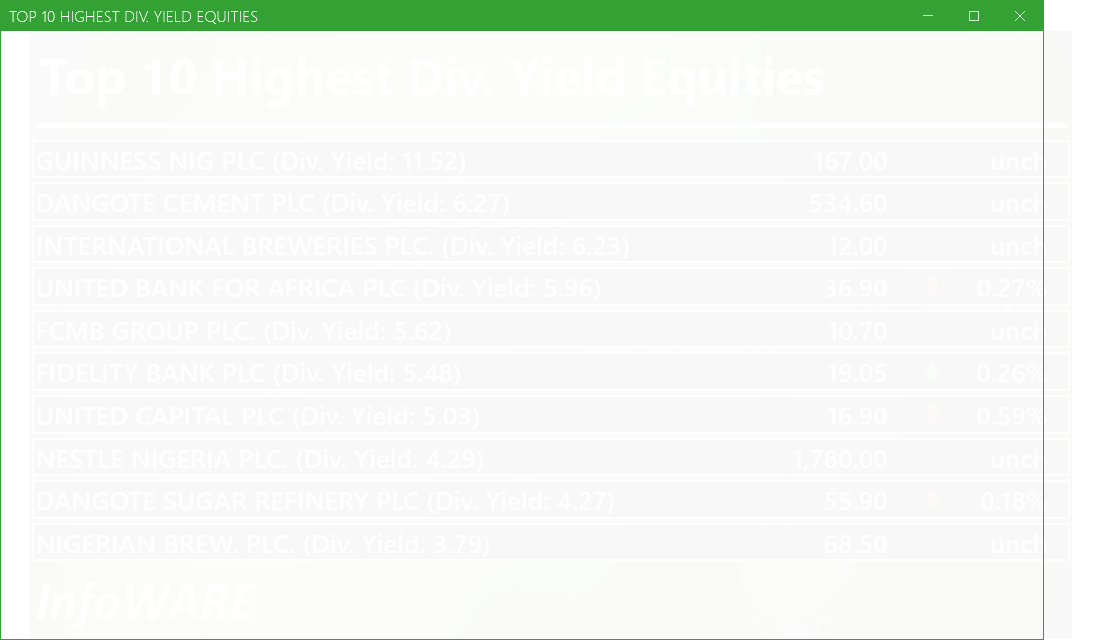
Investment Insights - High Div. Stocks
Dividend stocks distribute a portion of the company earnings to investors on a regular basis and they can a great choice for investors looking for regular income. As an investment or trading strategy, high dividend yield equities provide annual cash payments as against mostly capital gains in the price of a stock. The list in the table below represent the highest dividend paying stocks from the list of the most liquid stocks in the NSE top 30.
For more detailed analysis,
- On InfoWARE Market Data Terminal <HYIELD> <GO>
- On InfoWARE Finance Mobile App ( Android , iPhone & iPad and Windows 10) , "Research"
Investment Insights - Stocks outperforming the ASI but with approximately the same risk
These list of stocks represent equities that are less risky than the ASI but doing better than the ASI (All Shares Index) using the YTD (Year to Date) returns as the measure. The risk is measured by Beta. Beta is an assessment of a stock's tendency to undergo price changes, (its volatility), as well as its potential returns compared to the ASI. It is expressed as a ratio, where a score of 1 represents performance comparable to the ASI, and returns above or below the market may receive scores greater or lower than 1.
For a full list of both positively and negatively corelated stocks visit InfoWARE Market Data Terminal
- On InfoWARE Market Data Terminal <BANL> <GO>
- On InfoWARE Finance Mobile App ( Android , iPhone & iPad and Windows 10)
| Symbol | DivYield | PE | EPS | Beta | %ChgYTD | ASIYTDReturn | BetaDiff |
|---|---|---|---|---|---|---|---|
| HONYFLOUR | 1.40 | 16.28 | 0.31 | 0.99 | 163.01 | 39.36 | 0.01 |
| CAVERTON | 5.52 | 1.15 | 1.57 | 0.98 | 115.69 | 39.36 | 0.02 |
| ROYALEX | 7.81 | 0.00 | 0.00 | 0.96 | 65.45 | 39.36 | 0.04 |
| CORNERST | 5.28 | 8.62 | 0.35 | 0.93 | 50.76 | 39.36 | 0.07 |
| UNIVINSURE | 0.00 | 0.00 | 0.00 | 0.83 | 61.11 | 39.36 | 0.17 |
| FTNCOCOA | 1.60 | 0.00 | 0.00 | 0.79 | 160.64 | 39.36 | 0.21 |
| NB | 3.79 | 16.95 | 1.60 | 0.79 | 114.06 | 39.36 | 0.21 |
| MAYBAKER | 3.75 | 58.94 | 0.14 | 0.78 | 81.38 | 39.36 | 0.22 |
| UNILEVER | 2.81 | 67.09 | 0.40 | 0.75 | 91.67 | 39.36 | 0.25 |
| VETGOODS | 0.00 | 0.71 | 103.49 | 39.36 | 0.29 |
African Markets
| Name | LClose | Change | %Chg |
|---|---|---|---|
| BRVM Stock Exchange | 344.42 | 0.52 | 0.15 |
| Botswana Stock Exchange | 10,646.68 | 0.00 | 0.00 |
| Egyptian Exchange | 40,302.39 | -206.60 | -0.51 |
| Ghana Stock Exchange | 8,496.86 | 73.29 | 0.87 |
| Johannesburg Stock Exchange | 111,896.80 | -123.22 | -0.11 |
| Lusaka Stock Exchange | 25,945.02 | -44.18 | -0.17 |
| Casablanca Stock Exchange | 18,112.94 | -94.68 | -0.52 |
| Malawi Stock Exchange | 636,169.33 | -127.26 | -0.02 |
| Nigeria Stock Exchange | 144,187.03 | -462.88 | -0.32 |
| Nairobi Securities Exchange | 188.26 | 0.09 | 0.05 |
| Namibian Stock Exchange | 1,991.98 | 4.57 | 0.23 |
| Rwanda Stock Exchange | 179.20 | 0.07 | 0.04 |
| Tunis Stock Exchange | 13,193.11 | 40.77 | 0.31 |
| Uganda Securities Exchange | 1,584.07 | 5.37 | 0.34 |
Nigeria Market Indexes
| Symbol | LClose | %Chg | WTD% | MTD% | QTD% | YTD% | MktCap | Trades |
|---|---|---|---|---|---|---|---|---|
| ASI | 143,790.91 | -0.27 | -0.94 | -6.47 | 0.57 | 39.36 | 17,714 | |
| NGX30 | 5,263.68 | -0.20 | -0.89 | -6.64 | 0.88 | 37.98 | 9,705 | |
| NGXAFRBVI | 3,076.61 | -0.24 | -4.28 | -7.29 | -13.32 | 24.02 | 4,347 | |
| NGXAFRHDYI | 20,582.62 | 1.29 | -1.83 | -5.57 | -7.54 | 20.88 | 4,604 | |
| NGXASEM | 1,392.88 | 0.00 | 0.00 | 0.00 | -9.44 | -12.05 | 3 | |
| NGXBNK | 1,372.60 | 0.28 | -2.87 | -6.19 | -9.50 | 26.23 | 4,420 | |
| NGXCG | 3,814.04 | -0.29 | -2.40 | -6.69 | -5.85 | 34.81 | 9,504 | |
| NGXCNSMRGDS | 3,445.10 | -0.16 | -0.42 | -3.00 | 1.84 | 98.64 | 2,249 | |
| NGXCOMMDTY | 1,182.74 | 0.00 | -0.18 | -2.07 | 5.43 | 18.27 | ||
| NGXGROWTH | 14,018.00 | 0.38 | -2.69 | -9.61 | -6.99 | 80.58 | 210 | |
| NGXINDUSTR | 5,234.26 | -0.01 | -0.02 | -12.11 | 3.28 | 46.55 | 1,310 | |
| NGXINS | 1,083.42 | -2.24 | -7.12 | -10.68 | -9.42 | 37.81 | 1,364 | |
| NGXLOTUSISLM | 12,762.83 | -0.76 | -0.96 | -6.23 | 7.51 | 83.17 | 3,026 | |
| NGXMAINBOARD | 7,049.31 | -0.05 | -0.54 | -3.82 | 0.07 | 40.87 | 12,384 | |
| NGXMERIGRW | 9,955.00 | 0.87 | -1.44 | -3.53 | 0.52 | 52.61 | 2,461 | |
| NGXMERIVAL | 12,227.77 | -0.46 | -3.89 | -6.16 | -8.53 | 17.23 | 5,199 | |
| NGXOILGAS | 2,721.38 | -0.08 | -0.71 | -2.74 | 7.74 | 0.38 | 256 | |
| NGXPENBRD | 2,695.36 | -0.14 | -0.82 | -6.13 | 1.67 | 47.16 | 14,475 | |
| NGXPENSION | 6,586.94 | -0.05 | -1.38 | -5.28 | -2.24 | 45.28 | 10,930 | |
| NGXPREMIUM | 14,009.16 | -0.39 | -1.37 | -10.83 | 2.32 | 43.94 | 5,120 | |
| NGXSOVBND | 671.30 | 0.00 | 0.32 | 0.43 | 2.13 | 11.60 | 0 |
For more detailed analysis,
- On InfoWARE Market Data Terminal <MKTINS> <GO>
- On InfoWARE Finance Mobile App ( Android, iPhone & iPad and Windows 10) , "Market Indexes"
Find the topic interesting? Will like to comment? Contact Us at solutions@infowarelimited.com
Top News

InfoWARE AI Analyst Weekly Market Report: 21-Nov-2025
Chart Of The Day - ASI Chart Vs ASI Advance Decline Line (YTD) (21-Nov-2025 15:07:14.650)
InfoWARE AI Analyst Daily Market Report: 21-Nov-2025

[VETINDETF]>> DAILY INDICATIVE PRICES
[XNSA]>> NORRENBERGER MUTUAL FUNDS WEEKLY UPDATE TO NGX
[XNSA]>> H2 2025 BC/DR TEST
[XNSA]>> CORDROS MILESTONE FUNDS' BID & OFFER PRICES
[XNSA]>> NGX FIXED INCOME INDICATIVE PRICE LIST FOR NOV 21, 2025
[STANBICETF30]>> DAILY INDICATIVE PRICES
[XNSA]>> AELP CAPACITY BUILDING & ASSDA FORUM
[XNSA]>>GO-LIVE NOTIFICATION: TRANSITION TO T+2 SETTLEMENT CYCLE
[XNSA]>> NOTIFICATION OF PRICE ADJUSTMENT
Chart Of The Day - ASI Chart Vs ASI Advance Decline Line (YTD) (20-Nov-2025 15:11:12.969)
InfoWARE AI Analyst Daily Market Report: 20-Nov-2025
[MERGROWTH]>> DAILY INDICATIVE PRICES
[VETBANK]>> DAILY INDICATIVE PRICES
[XNSA]>> NGX FIXED INCOME INDICATIVE PRICE LIST FOR NOV 20, 2025
[LOTUSHAL15]>> DAILY INDICATIVE PRICES
[XNSA]>> H2 2025 BC/DR TEST
[XNSA]>> CORDROS MILESTONE FUNDS' BID & OFFER PRICES
[XNSA]>> AELP CAPACITY BUILDING & ASSDA FORUM
[XNSA]>>GO-LIVE NOTIFICATION: TRANSITION TO T+2 SETTLEMENT CYCLE
Chart Of The Day - ASI Chart Vs ASI Advance Decline Line (YTD) (19-Nov-2025 15:07:23.291)
InfoWARE AI Analyst Daily Market Report: 19-Nov-2025
[XNSA]>> CORDROS MILESTONE FUNDS' BID & OFFER PRICES
[MERGROWTH]>> DAILT INDICATIVE PRICES
[XNSA]>> NGX FIXED INCOME INDICATIVE PRICE LIST FOR NOV 19, 2025
[VETGOODS]>> DAILY INDICATIVE PRICES
[XNSA]>> AELP CAPACITY BUILDING & ASSDA FORUM
[XNSA]>>GO-LIVE NOTIFICATION: TRANSITION TO T+2 SETTLEMENT CYCLE
Get IDIA - the stock trading app for the modern investor
Solutions by Business
Product Suites
Company
Contacts
- 8th Floor,
- South Atlantic Petroleum Towers,
- 1 Adeola Odeku Street,
- Victoria Island,
- Lagos, Nigeria.
- Email: solutions@infowarelimited.com
Follow Us
 |
 |
 |
 |