


InfoWARE AI Analyst Daily Market Report: 20-Nov-2025 | InfoWARE Finance
Get IDIA - the stock trading app for the modern investor


InfoWARE AI Analyst Daily Market Report: 20-Nov-2025
(Source: InfoWARE Terminal, Date: 20-Nov-2025)
Dear Investor,
NGX Daily Market Summary – Thursday, November 20, 2025
The NGX All Share Index (ASI) slid -0.32% to close at 144,646.01, reflecting heightened volatility amid a sharp rise in market turnover to 8.57B Naira (+51.3% day-on-day). Despite increased trading activity, the market breadth contracted further, with only 17 advancers vs 41 decliners (breadth ratio: 0.41x), indicating risk-off sentiment and strong sector divergence. Momentum stocks outperformed again, with remarkable surges among specific equities, but losses in key ETFs and high-volume losers suggest underlying caution persists. The Naira also dipped, weakening 0.13% against the Dollar to 1,446.
Key Market Trends
- Market Breadth: Bearish undertone with breadth at 0.41x (17 advancers, 41 decliners). Despite turnover and volume increases, the rally is highly selective, with buying focused in very few names.
- Turnover & Liquidity: Market turnover soared +51.3% to 8.57B Naira, suggesting increased institutional activity and portfolio repositioning, even as overall price action turned soft.
- Volume: 68 stocks saw increased activity but this was countered by volume declines in 73 names, underlining that liquidity is rotating more than broadening.
- Naira Weakness: The currency dropped 0.13%, potentially putting pressure on earnings in sectors exposed to imports or FX volatility.
Top Gainers and Losers – Key Highlights
| Top Gainers | % Chg | RSI | Key Insight |
|---|---|---|---|
| NCR (NIGERIA) PLC (NCR) | +10.0% | 98.57 | Explosive momentum (YTD: +580%), extreme RSI. Overbought, aggressive buyers could attract profit-takers soon. |
| VETIVA GRIFFIN 30 ETF (VETGRIF30) | +9.95% | 64.72 | ETF strength despite market churn, among top 5 YTD gainers, suggesting institutional flow to index proxies. |
| ROYAL EXCHANGE PLC (ROYALEX) | +7.57% | 41.58 | Crossed 15DMA bullish, fresh momentum post consolidation. |
| C & I LEASING PLC (CILEASING) | +6.00% | 32.18 | Bouncing off oversold conditions, but RSI still low; short-term rebound. |
| LIVINGTRUST MORTGAGE BANK PLC (LIVINGTRUST) | +3.87% | 24.02 | Oversold (low RSI), even this gain doesn’t erase its YTD weakness (see below). |
| Top Losers | % Chg | RSI | Key Insight |
|---|---|---|---|
| NEWGOLD EXCHANGE TRADED FUND (NEWGOLD) | -11.05% | 56.31 | YTD still strongly positive, but severe technical gap down on sharp volume. |
| STANBIC IBTC ETF 30 | -10.00% | 84.75 | Deeply overbought ETF suffered a quick correction—signs of institutional unwinding or rebalancing. |
| NEIMETH INT'L PHARMA (NEIMETH) | -10.00% | 45.91 | Bears in control; RSIs not washed out, so more downside possible. |
| OMATEK VENTURES PLC | -10.00% | 49.66 | Breakdown below 15DMA signals technical damage; more pressure likely. |
| TANTALIZERS PLC | -9.75% | 68.07 | Heavy volume sell-off amid prior strong run; early profit-taking? |
Significant Patterns & Trader Insights
- Turnover Surge Implication: Big jump in turnover (to 8.57B Naira) vs price weakness indicates significant institutional rebalancing. Watch for continued rotation, as "distribution days” (high volume selloffs) typically foreshadow further volatility.
- Advancer/Decliner Trend: Decliners outpaced advancers by over 2:1. This confirms a defensive market stance despite select headline gains.
-
Unusual Volumes:
- LIVINGTRUST volume at 7.95M vs 0.98M 90-day average (+710%), rebounding +3.87% off a major YTD low. Possible bottom-fishing or a dead-cat bounce risk.
- TANTALIZER, after its run, now down -9.75% on massive volume (+254% above normal)—clear profit-taking or institutional exit.
- UCAP and TIP also showed major surges in traded volume—investor interest but with mixed near-term direction.
- YTD Top Movers: NCR is up an astronomical +580% YTD (top gainer), but its RSI is a screaming 98.57 and MACD positive, which suggests "euphoria tops.” LIVINGTRUST is still -20.32% YTD, even after today’s high-volume bounce (and RSI 24.02).
- Bullish Momentum Crossovers: ROYAL EXCHANGE (ROYALEX) just broke above 15DMA with a 7.04% gain and +7.57% momentum—keep a close eye for a trend reversal, especially if market breadth improves.
- Bearish Momentum & Breakdown: OMATEK, NEIMETH both broke below their 15DMA, now in technical distress with negative volume flows and lack of support.
- ETF Volatility: NEWGOLD, VETIVA GRIFFIN 30 ETF highlight ETF flows are now a volatility amplifier; passive funds may unwind into price weakness, further exaggerating market moves.
Contrarian Signals – Crosswinds to Watch
| Stock | RSI | MACD | YTD% | 15DMA Trend | Contradiction |
|---|---|---|---|---|---|
| TANTALIZERS PLC | 68.07 | 0.02 | +11.11% | Below | Recent price crash on huge volume, but momentum (RSI, MACD) remains borderline bullish—potential for whipsaw volatility. |
| LIVINGTRUST MB | 24.02 | -0.22 | -20.32% | Above | Oversold bounce with huge volume, but long-term trend remains negative. Contrarian "bottom bounce” risk or value trap? |
| STANBIC ETF 30 | 84.75 | 82.26 | N/A | Below | Massive RSI overbought but price crashing; signals overextension and imminent correction. |
Sector Heatmap Snapshot
| Sector | Performance | Notable Movers | Technical Trend | Retail % | Institutional % |
|---|---|---|---|---|---|
| Banking | Slightly Negative | ZENITHBANK, GTCO, ACCESSCORP | Price declines, High inst. turnover | 25% | Heavy (ZENITHBANK top 2) |
| Insurance | Weak | CORNERST, WAPIC, MBENEFIT | Breaks below 15DMA, Bearish crossovers | High | Low |
| ETF/Index Funds | Mixed (high volatility) | VETGRIF30, NEWGOLD | Mixed (one up, one down), broad money flows | Medium | Medium-High |
| Other Financial Inst. | Strong select names | ROYALEX, UCAP | Bullish surges, Above 15DMA | Medium | Medium |
| Consumer | Soft | NB, TANTALIZER | Broad decline, breakdowns | High | Low |
Dividend-Beta Matrix: Defensive Playbook
| Stock | Dividend Yield | Beta | Sector | Momentum | Comment |
|---|---|---|---|---|---|
| REGALINS | 6.52% | 0.94 | Insurance | Bearish (YTD -32.5%, RSI: 43.49) | High yield, but in a downtrend – defensive but watch for value traps. |
| ABCTRANS | 2.19% | 0.60 | Transport | Bearish (YTD: +179.67%) | Strong YTD gain may draw profit takers, but some safety from low Beta. |
| AFRIPRUD (for example) | 1.27% | 0.64 | Registrar Services | N/A | Low beta & decent yield: attractive for risk-off portfolios if price stabilizes. |
| MAYBAKER | 3.75% | 0.77 | Pharma | Bearish | Defensive quality but suffering heavy price declines. Monitor for reversal. |
Institutional Clustering Alerts
- ZENITHBANK: Institutional trades account for 20.17% of all value in top 5 stocks—watch for further block-trade induced volatility.
- GTCO, ACCESSCORP, MTNN, FCMB: All show dominant institutional flows today. These stocks accounted for the bulk of market liquidity, with institutions participating in >70% of market volume and 85.1% of value traded—largely on the sell-side given price declines.
- Retail flows concentrated disproportionately in MTNN, ZENITHBANK, and ACCESSCORP—all underperformed, possibly indicating crowded retail long positions on the short side of the trade.
High Dividend Stock Overlaps
- Dividend names like REGALINS (6.5% yield, Beta < 1) and MAYBAKER (3.75% yield) are featured among YTD top losers and bearish momentum tables: these typically attract "value" buyers, but persistent price declines warn of "falling knife" risk. Traders should be cautious—only buy if technical reversal is confirmed.
- No bullish momentum names in today's list offered meaningful dividend yield, underscoring the current "growth over income" theme among top movers.
Trader Suggestions & Tactical Opportunities
- Be wary of overbought names: NCR is technically exhausted (RSI: 98.57, MACD maxed) after a meteoric YTD run. Fresh buying here is risky—look for signs of reversal or scale out.
- Monitor ETFs for clues on institutional positioning: Large redemptions or creations in key ETFs (e.g., NEWGOLD, VETGRIF, STANBIC ETF) cause broad price volatility and can act as barometers for overall risk appetite.
- Watch oversold, high-volume rebounds: LIVINGTRUST, TANTALIZER—if these can sustain follow-through buying tomorrow, short-term swing trades may be possible. But set tight stops.
- Skeptical on Defensive Yield Traps: REGALINS and similar high-yielders remain in technical downtrends. Wait until at least a bullish MACD crossover or 15DMA recovery before bottom-fishing.
- Bullish crossovers: ROYALEX just crossed above 15DMA. This is a bullish momentum signal; if volume and price hold, trend followers may want to initiate positions.
Market Activity – Retail vs Institutional Trade Patterns
-
Institutions: Represented 35.3% of trades but accounted for 70.1% of volume and a massive 85.1% of total value—evidence of block trading and larger ticket flows.
- Top Institutional Stocks by Volume: GTCO, ZENITHBANK, ACCESSCORP, MTNN, FCMB
- These are also among the top traded stocks by retail, but price declines point to potential institutional selling into retail bids—a negative signal for short-term direction.
-
Retail: Drove 64.7% of trade count but only 29.9% of total volume (much smaller average trade sizes).
- Top Retail Stocks: MTNN, ACCESSCORP, ZENITHBANK, UBA, GTCO
- Overlap with institutional focus indicates these are battleground names—increase vigilance for whipsaws and fakeouts.
Sparklines – Moving Average Momentum (15D vs 50D)
| Stock | 15D MA | 50D MA | Momentum |
|---|---|---|---|
| NCR | 22.92 | 17.87 | Bullish /⥣⥣⥣/ |
| VETGRIF30 | 56.32 | 53.97 | Bullish /⥣⥣/ |
| ROYAL EXCHANGE | 1.95 | 2.12 | Bullish crossover |
| NEIMETH | 5.37 | 5.87 | Bearish breakdown |
| TANTALIZER | 2.28 | 2.36 | Bearish |
Hidden & Subtle Observations
- Strong divergence between price action of ETFs and individual equities signals the return of macro-driven trades—risk-off/defensive positioning is increasing.
- Overlapping names between YTD losers and today's high volume (e.g., LIVINGTRUST) suggest that bottom-picking is intensifying; however, technicals remain shaky.
- Banks and index big-caps are at the heart of both institutional and retail action—any further move from these could dictate near-term NGX direction.
- Bearish momentum tables are crowded with Insurance, Pharma, and Consumer stocks—structural sectoral weakness.
- Low Beta, high-yield combos underperforming (defensive traps), while current market leadership is from momentum/"breakout” names.
Summary Table: YTD Top 5 Gainers and Losers (Thursday Highlight)
| Top 5 YTD Gainers | ||||
|---|---|---|---|---|
| Name | Price | YTD % | RSI | 5D % |
| NCR (NIGERIA) PLC | 34.00 | +580.00% | 98.57 | +32.86% |
| VETIVA GRIFFIN 30 ETF | 60.6100 | +76.53% | 64.72 | +20.94% |
| SIAML PENSION ETF 40 | 600.00 | -24.99% | 84.01 | +20.48% |
| UACN PLC | 68.30 | +107.28% | 58.65 | +17.56% |
| UPL | 6.00 | +55.84% | 75.36 | +17.65% |
| Top 5 YTD Losers | ||||
|---|---|---|---|---|
| Name | Price | YTD % | RSI | 5D % |
| LIVINGTRUST MB | 3.36 | -20.32% | 24.02 | -15.70% |
| MCNICHOLS | 2.73 | +59.63% | 39.27 | -14.33% |
| INTENEGINS | 2.60 | +25.67% | 41.69 | -13.60% |
| REGALINS | 1.14 | -32.50% | 43.49 | -13.11% |
| NEWGOLD ETF | 57449.00 | +75.59% | 56.32 | -11.05% |
Final Thoughts
- Momentum chasers in NCR, VETGRIF30 must beware of exhaustion signals (RSI, MACD at extremes); fresh entries not advisable without a pullback.
- Fallen angels like LIVINGTRUST are seeing speculative bounces, but risk remains high; only nimble traders should attempt these.
- Institutional dominance means market moves could become "jagged”; retail traders are playing tug-of-war in big names, so volatility and whipsaw risk will persist.
- Sector rotation is ongoing—avoid sectors with multiple names below 15DMA (Insurance, Consumer, Pharma).
- Yield-seekers should monitor for sign of base formation in high-dividend, low Beta stocks, but patience required.
Trade safe: Embrace discipline, hedge if exposed, and follow the flows, especially amidst institutional rebalancing and sector divergence!
|
Top ASI Gainers Over Last 5 Trading Days
|
Top ASI Losers Over Last 5 Trading Days
|
For more detailed analysis, on InfoWARE Market Data Terminal <NSEPERF> <GO>
On InfoWARE Finance Mobile App (Android, iPhone & iPad, Windows Phone and Windows 8/10), "Top Gainers & Losers"
NCR (NIGERIA) PLC. (NCR) topped the advancers list closing at N37.40 with a gain of 10.00% followed by VETIVA GRIFFIN 30 ETF (VETGRIF30) which closed at N66.64 with a gain of 9.95%.
On the flip side NEWGOLD EXCHANGE TRADED FUND (ETF) (NEWGOLD) and NEIMETH INTERNATIONAL PHARMACEUTICALS PLC (NEIMETH) topped the decliners log with a loss of -11.05% at a close of N51,101.01, and -10.00% to close the day at N4.95 respectively.
| Symbol | LClose | %Chg |
|---|---|---|
| NCR | 37.40 | 10.00 |
| VETGRIF30 | 66.64 | 9.95 |
| LOTUSHAL15 | 82.90 | 8.08 |
| ROYALEX | 1.99 | 7.57 |
| CILEASING | 5.30 | 6.00 |
| Symbol | LClose | %Chg |
|---|---|---|
| NEWGOLD | 51,101.01 | -11.05 |
| NEIMETH | 4.95 | -10.00 |
| OMATEK | 1.17 | -10.00 |
| STANBICETF30 | 805.32 | -10.00 |
| TANTALIZER | 2.50 | -9.75 |
For more detailed analysis,
- On InfoWARE Market Data Terminal <TOPG> <GO>
- On InfoWARE Finance Mobile App ( Android, iPhone & iPad and Windows 10) , "Top Gainers & Losers"
Currency Market
In the currency market, the Naira fell 0.13%(-1.87) against the Dollar to settle at 1 to 1NSE: Bull Signal - Price crossed above 15 Day MA
This signal implies these stocks are under buying pressure and the price might continue to rise and therefore positions should be monitored closely. Further suggested analysis include looking at the overall market (ASI) to see if the uptrend is market wide, sector wide or specific to the stock. Portfolio managers tend to use this as a signal to do more research to add to their positions or lock in some profits. Typically further analysis should be done using commands like PC and RV on the InfoWARE Market Data Terminal. Another command is ALERTS to set price triggers for possible exit or entry as necessary
For more detailed analysis,
- On InfoWARE Market Data Terminal <NSEPERF> <GO>
- On InfoWARE Finance Mobile App ( Android , iPhone & iPad and Windows 10) , "Top Gainers & Losers"
| Symbol | Price | %Chg | 15DMA | PE | EPS | DivY | MktCap | Vol | Trades | Value | LstTradeTime |
|---|---|---|---|---|---|---|---|---|---|---|---|
| LOTUSHAL15 | 82.90 | 7.48 | 82.88 | 0.00 | 0.00 | 31.75K | 33.00 | 2.49M | 20-Nov-2025 14:30:59.990 | ||
| FG202029S5 | 110.93 | 7.19 | 103.49 | 0.00 | 0.00 | 35.41K | 1.00 | 39.28M | 20-Nov-2025 14:30:32.623 | ||
| ROYALEX | 1.99 | 7.04 | 1.95 | 0.00 | 0.00 | 7.81 | 10.24B | 2.33M | 70.00 | 4.68M | 20-Nov-2025 14:30:26.050 |
| VFDGROUP | 10.60 | 1.42 | 10.54 | 0.00 | 0.00 | 0.00 | 0.00 | 4.96M | 187.00 | 51.20M | 20-Nov-2025 14:30:27.330 |
| DEAPCAP | 1.75 | 0.57 | 1.74 | 188.84 | 0.01 | 13.76 | 2.63B | 698.82K | 27.00 | 1.21M | 20-Nov-2025 14:30:16.540 |
| FG202033S6 | 119.52 | 0.34 | 119.14 | 0.00 | 0.00 | 4.17K | 1.00 | 4.98M | 20-Nov-2025 14:30:32.680 |
NSE: BEAR Signal - Price crossed below 15 Day MA
This signal implies these stocks are under selling pressure and the price might continue to slide and therefore positions should be monitored closely. Further suggested analysis include looking at the overall market (ASI) to see if the downtrend is market wide, sector wide or specific to the stock. If the overal market trend is upwards, then since these stocks are heading in the opposite direction, then further analysis should be done using commands like PC and RV on the InfoWARE Market Data Terminal. Another command is ALERTS to set price triggers for possible exit is necessar
For more detailed analysis,
- On InfoWARE Market Data Terminal <BEARM> <GO>
- On InfoWARE Finance Mobile App ( Android , iPhone & iPad and Windows 10)
| Symbol | Price | %Chg | 15DMA | PE | EPS | DivY | MktCap | Vol | Trades | Value | LstTradeTime |
|---|---|---|---|---|---|---|---|---|---|---|---|
| NGXCNSMRGDS | 3,450.71 | -0.32 | 3,454.96 | 30.19 | 55.24 | 0.00 | 0.00 | 9.00M | 2,107.00 | 708.21M | 20-Nov-2025 14:30:36.427 |
| CORNERST | 5.97 | -2.18 | 5.98 | 8.62 | 0.35 | 5.28 | 108.45B | 4.04M | 77.00 | 23.09M | 20-Nov-2025 14:30:54.210 |
| NB | 68.50 | -2.19 | 68.64 | 16.95 | 1.60 | 3.79 | 703.92B | 752.79K | 175.00 | 51.44M | 20-Nov-2025 14:30:18.810 |
| WAPIC | 2.72 | -5.88 | 2.85 | 72.55 | 0.02 | 2.56 | 65.26B | 849.08K | 72.00 | 2.32M | 20-Nov-2025 14:30:27.393 |
| OANDO | 40.50 | -5.93 | 42.17 | 24.10 | 2.53 | 1.15 | 503.47B | 2.27M | 422.00 | 93.13M | 20-Nov-2025 14:30:25.490 |
| MBENEFIT | 3.40 | -7.06 | 3.57 | 5.43 | 0.11 | 3.28 | 68.21B | 1.24M | 81.00 | 4.22M | 20-Nov-2025 14:30:18.483 |
| FTNCOCOA | 4.90 | -7.55 | 4.91 | 0.00 | 0.00 | 1.60 | 19.11B | 801.61K | 83.00 | 4.07M | 20-Nov-2025 14:30:17.300 |
| NEIMETH | 4.95 | -11.11 | 5.37 | 125.52 | 0.02 | 3.38 | 21.15B | 2.40M | 120.00 | 12.15M | 20-Nov-2025 14:30:56.643 |
| OMATEK | 1.17 | -11.11 | 1.25 | 6.82 | 0.10 | 0.00 | 3.44B | 1.24M | 38.00 | 1.47M | 20-Nov-2025 14:30:25.620 |
| NEWGOLD | 51,101.01 | -12.42 | 55,976.14 | 0.00 | 0.00 | 0.00 | 0.00 | 6.00 | 3.00 | 306.60K | 20-Nov-2025 14:30:56.933 |
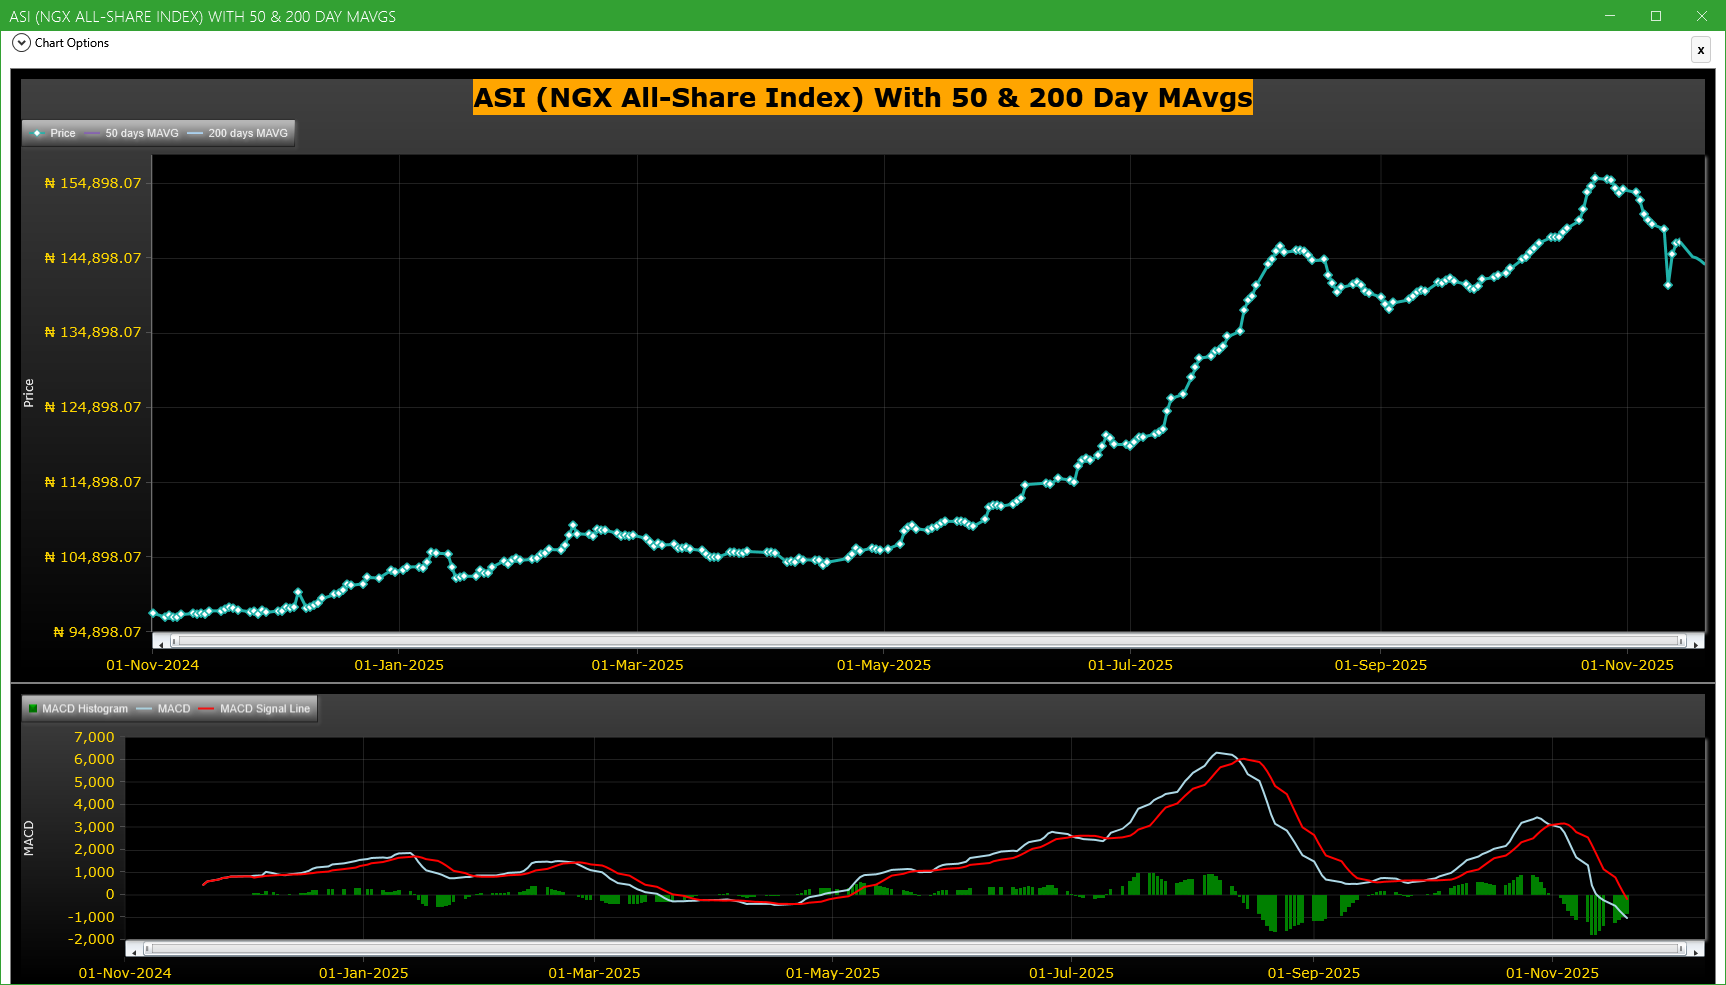
Market Trend - ASI (NGX All-Share-Index) With 50 & 200 Day MAvgs Chart
Technical traders typically use the 50 & 200 day moving averages to aid in choosing
where to enter or exit a position, which then causes these levels to act as strong
support or resistance. As a general guideline, if the price is above a moving average,
the trend is up. If the price is below a moving average, the trend is down.
It is important to note that critics of technical analysis say that moving averages act
as support and resistance because so many traders use these indicators to inform their
trading decisions. Also moving averages tend to work quite well in strong trending conditions
but poorly in choppy or ranging conditions.
Trading Strategies: Crossovers
Crossovers are one of the main moving average strategies. The first type is a price crossover,
which is when the price crosses above or below a moving average to signal a potential change
in trend. Another strategy is to apply two moving averages to a chart: one longer and one
shorter. When the shorter-term MA crosses above the longer-term MA, it is a buy signal, as
it indicates that the trend is shifting up. This is known as a golden cross. Meanwhile, when
the shorter-term MA crosses below the longer-term MA, it is a sell signal, as it indicates that
the trend is shifting down. This is known as a dead/death cross
For more detailed analysis,
- On InfoWARE Market Data Terminal <CI> <GO>
- On InfoWARE Finance Mobile App ( Android , iPhone & iPad and Windows 10) , "Research"
Unusual Volume: Volume traded is more than double the 90 day moving average (All exchanges; ASI & ASem). For more detailed analysis,
- On InfoWARE Market Data Terminal <UV> <GO>
- On InfoWARE Finance Mobile App ( Android , iPhone & iPad and Windows 10)
| Symbol | Name | Volume | 90DAvgVol | %VolChg | Price | LClose | %Chg | Trades | Value |
|---|---|---|---|---|---|---|---|---|---|
| TANTALIZER | TANTALIZERS PLC | 29.73M | 8.38M | 254.87 | 2.50 | 2.77 | -9.75 | 437 | 77.50M |
| UCAP | UNITED CAPITAL PLC | 10.72M | 5.09M | 110.45 | 17.00 | 17.15 | -0.87 | 258 | 183.39M |
| LIVINGTRUST | LIVINGTRUST MORTGAGE BANK PLC | 7.95M | 980.90K | 710.80 | 3.49 | 3.36 | 3.87 | 42 | 26.74M |
| TIP | THE INITIATES PLC | 6.49M | 2.97M | 118.72 | 11.05 | 11.10 | -0.45 | 129 | 74.69M |
| UPDCREIT | UPDC REAL ESTATE INVESTMENT TRUST | 4.17M | 1.64M | 154.08 | 6.80 | 6.80 | 0.00 | 216 | 27.44M |
Investment Insights - High Div. Stocks
Dividend stocks distribute a portion of the company earnings to investors on a regular basis and they can a great choice for investors looking for regular income. As an investment or trading strategy, high dividend yield equities provide annual cash payments as against mostly capital gains in the price of a stock. The list in the table below represent the highest dividend paying stocks from the list of the most liquid stocks in the NSE top 30.
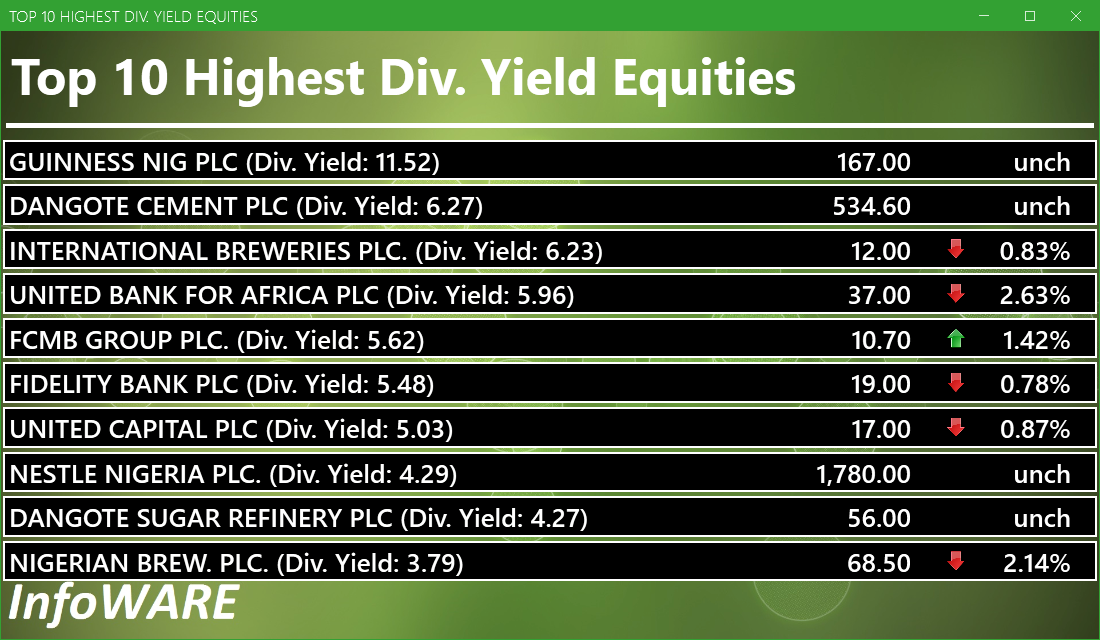
For more detailed analysis,
- On InfoWARE Market Data Terminal <HYIELD> <GO>
- On InfoWARE Finance Mobile App ( Android , iPhone & iPad and Windows 10) , "Research"
African Markets
| Name | LClose | Change | %Chg |
|---|---|---|---|
| BRVM Stock Exchange | 343.90 | 3.74 | 1.10 |
| Botswana Stock Exchange | 10,646.68 | 7.45 | 0.07 |
| Egyptian Exchange | 40,509.16 | 8.10 | 0.02 |
| Ghana Stock Exchange | 8,423.35 | 2.53 | 0.03 |
| Johannesburg Stock Exchange | 112,019.30 | 1,622.83 | 1.47 |
| Lusaka Stock Exchange | 25,989.08 | 106.12 | 0.41 |
| Casablanca Stock Exchange | 18,207.75 | -288.54 | -1.56 |
| Malawi Stock Exchange | 636,274.29 | -318.30 | -0.05 |
| Nigeria Stock Exchange | 144,646.01 | -333.45 | -0.23 |
| Nairobi Securities Exchange | 188.17 | 0.49 | 0.26 |
| Namibian Stock Exchange | 1,987.35 | 10.48 | 0.53 |
| Rwanda Stock Exchange | 179.12 | 0.00 | 0.00 |
| Tunis Stock Exchange | 13,152.97 | 11.83 | 0.09 |
| Uganda Securities Exchange | 1,578.68 | 6.76 | 0.43 |
Nigeria Market Indexes
| Symbol | LClose | %Chg | WTD% | MTD% | QTD% | YTD% | MktCap | Trades |
|---|---|---|---|---|---|---|---|---|
| ASI | 144,187.03 | -0.32 | -0.67 | -6.21 | 0.84 | 39.74 | 17,627 | |
| NGX30 | 5,274.20 | -0.30 | -0.69 | -6.45 | 1.08 | 38.26 | 9,940 | |
| NGXAFRBVI | 3,084.08 | -0.96 | -4.05 | -7.06 | -13.11 | 24.32 | 3,999 | |
| NGXAFRHDYI | 20,320.92 | -0.97 | -3.08 | -6.77 | -8.71 | 19.34 | 4,637 | |
| NGXASEM | 1,392.88 | 0.00 | 0.00 | 0.00 | -9.44 | -12.05 | 5 | |
| NGXBNK | 1,368.75 | -1.06 | -3.14 | -6.45 | -9.76 | 25.87 | 4,210 | |
| NGXCG | 3,825.15 | -0.77 | -2.12 | -6.42 | -5.57 | 35.20 | 9,375 | |
| NGXCNSMRGDS | 3,450.71 | -0.32 | -0.26 | -2.84 | 2.01 | 98.96 | 2,107 | |
| NGXCOMMDTY | 1,182.74 | 0.00 | -0.18 | -2.07 | 5.43 | 18.27 | ||
| NGXGROWTH | 13,964.82 | 0.28 | -3.06 | -9.95 | -7.35 | 79.89 | 253 | |
| NGXINDUSTR | 5,234.57 | -0.01 | -0.01 | -12.11 | 3.29 | 46.56 | 1,488 | |
| NGXINS | 1,108.20 | -3.82 | -5.00 | -8.64 | -7.35 | 40.96 | 1,158 | |
| NGXLOTUSISLM | 12,860.39 | 0.00 | -0.21 | -5.52 | 8.33 | 84.57 | 3,309 | |
| NGXMAINBOARD | 7,052.66 | -0.39 | -0.49 | -3.77 | 0.11 | 40.94 | 12,410 | |
| NGXMERIGRW | 9,869.15 | -1.57 | -2.29 | -4.37 | -0.34 | 51.29 | 2,295 | |
| NGXMERIVAL | 12,283.95 | -0.86 | -3.45 | -5.73 | -8.11 | 17.77 | 5,058 | |
| NGXOILGAS | 2,723.66 | -0.40 | -0.62 | -2.66 | 7.83 | 0.46 | 307 | |
| NGXPENBRD | 2,699.20 | -0.28 | -0.68 | -6.00 | 1.81 | 47.37 | 14,473 | |
| NGXPENSION | 6,589.97 | -0.36 | -1.34 | -5.24 | -2.19 | 45.35 | 10,969 | |
| NGXPREMIUM | 14,063.30 | -0.18 | -0.99 | -10.48 | 2.71 | 44.49 | 4,964 | |
| NGXSOVBND | 671.30 | 0.32 | 0.32 | 0.43 | 2.13 | 11.60 | 0 |
For more detailed analysis,
- On InfoWARE Market Data Terminal <MKTINS> <GO>
- On InfoWARE Finance Mobile App ( Android, iPhone & iPad and Windows 10) , "Market Indexes"
Find the topic interesting? Will like to comment? Contact Us at solutions@infowarelimited.com
Top News

Chart Of The Day - ASI Chart Vs ASI Advance Decline Line (YTD) (20-Nov-2025 15:11:12.969)
InfoWARE AI Analyst Daily Market Report: 20-Nov-2025

[MERGROWTH]>> DAILY INDICATIVE PRICES
[VETBANK]>> DAILY INDICATIVE PRICES
[XNSA]>> NGX FIXED INCOME INDICATIVE PRICE LIST FOR NOV 20, 2025
[LOTUSHAL15]>> DAILY INDICATIVE PRICES
[XNSA]>> H2 2025 BC/DR TEST
[XNSA]>> CORDROS MILESTONE FUNDS' BID & OFFER PRICES
[XNSA]>> AELP CAPACITY BUILDING & ASSDA FORUM
[XNSA]>>GO-LIVE NOTIFICATION: TRANSITION TO T+2 SETTLEMENT CYCLE
Chart Of The Day - ASI Chart Vs ASI Advance Decline Line (YTD) (19-Nov-2025 15:07:23.291)
InfoWARE AI Analyst Daily Market Report: 19-Nov-2025
[XNSA]>> CORDROS MILESTONE FUNDS' BID & OFFER PRICES
[MERGROWTH]>> DAILT INDICATIVE PRICES
[XNSA]>> NGX FIXED INCOME INDICATIVE PRICE LIST FOR NOV 19, 2025
[VETGOODS]>> DAILY INDICATIVE PRICES
[XNSA]>> AELP CAPACITY BUILDING & ASSDA FORUM
[XNSA]>>GO-LIVE NOTIFICATION: TRANSITION TO T+2 SETTLEMENT CYCLE
[STANBICETF]>> DAILY INDICATIVE PRICES
Chart Of The Day - ASI Chart Vs ASI Advance Decline Line (YTD) (18-Nov-2025 15:22:22.218)
InfoWARE AI Analyst Daily Market Report: 18-Nov-2025
[MERVALUE]>> DAILY INDICATIVE PRICES
[XNSA]>> OFF MARKET TRADE
[LOTUSHAL15]>> DAILY INDICATIVE PRICES
[VSPBONDETF]>> DAILY INDICATIVE PRICES
[XNSA]>> DAILY FUND PRICE SUBMISSION - FCMB ASSET MANAGEMENT LIMITED
[XNSA]>> H2 2025 BC/DR TEST
[XNSA]>> AELP CAPACITY BUILDING & ASSDA FORUM
[XNSA]>> NGX FIXED INCOME INDICATIVE PRICE LIST FOR NOV 18, 2025
[SIAMLETF40]>> DAILY INDICATIVE PRICES
Get IDIA - the stock trading app for the modern investor
Solutions by Business
Product Suites
Company
Contacts
- 8th Floor,
- South Atlantic Petroleum Towers,
- 1 Adeola Odeku Street,
- Victoria Island,
- Lagos, Nigeria.
- Email: solutions@infowarelimited.com
Follow Us
 |
 |
 |
 |