


InfoWARE AI Analyst Daily Market Report: 19-Jun-2025 | InfoWARE Finance
Get IDIA - the stock trading app for the modern investor


InfoWARE AI Analyst Daily Market Report: 19-Jun-2025
(Source: InfoWARE Terminal, Date: 19-Jun-2025)
Dear Investor,
NGX Daily Market Summary – Thursday, June 19, 2025
The Nigerian Stock Exchange All Share Index (ASI) extended its rally, climbing +0.92% to close at 116,786.87, pushing year-to-date (YTD) returns to +14.23%. Market activity saw a notable jump in volume, reaching 866.60M shares—nearly 44% higher than the previous session—although turnover dipped modestly by -4.50% to 20.52B Naira. Breadth tilted bullishly with 45 advancers versus 23 decliners (1.96x), showcasing continued appetite for equities. Institutional investors dominated both value and volume, but retail participation remained strong by trade count, hinting at active smaller players. Industrial and banking blue-chips like ZENITHBANK and GTCO saw robust institutional flows, while unusual volume spikes pointed to rotational activity in select names. Despite the gains, several ETFs and insurance plays continued to exhibit bearish momentum, indicating a bifurcated market beneath the surface.
Market Breadth & Trading Activity
- Breadth bullish: 45 advancers vs 23 decliners (Ratio: 1.96x).
- Volume up sharply: 866.60M shares traded, up from 602.09M; volume increased on 72 stocks, fell on 68.
- Turnover slightly lower: N20.52B (-4.50% vs previous day), suggesting higher retail activity and some profit-taking even in the face of aggressive advancers.
- Institutional investors accounted for 82.38% of total volume and a dominant 92.33% of value, but only 36.40% of trade count—signaling large blocks versus numerous small trades from retailers.
Top 5 Gainers (Day)
| Stock | % Chg | RsI | Comments |
|---|---|---|---|
| IKEJA HOTEL PLC | +10.00% | 50.4 | Crossover above 15DMA; sustained demand after prior RSI pullback; momentum but not overbought. |
| BETA GLASS CO PLC. | +9.98% | 69.6 | YTD monster (+325%); RSI near overbought, MACD losing some momentum. |
| LEGEND INTERNET PLC | +9.92% | 48.3 | Volume/momentum spike; just moved above 15DMA, still not overbought. |
| UNIVERSITY PRESS PLC. | +9.85% | 55.5 | Strong 5D/MTD run; momentum persists; RSI/MA cross bullish. |
| ETERNA PLC. | +9.82% | 22.97 | RSI crashed from 58 to 23 in 1 day (volatile); possible reversal play—watch closely. |
Top 5 Losers (Day)
| Stock | % Chg | RSI | Comments |
|---|---|---|---|
| GREENWICH ASSET ETF | -9.99% | 23.3 | Bearish MA/RSI, multi-week downtrend; significant liquidity exit. |
| GUINEA INSURANCE PLC. | -9.21% | 60.7 | Anomalous RSI (not oversold), but consistent downtrend YTD; worth further technical check. |
| HALDANE MCCALL PLC | -5.88% | 32.1 | RSI breaking down, negative momentum persists. |
| C & I LEASING PLC. | -5.84% | 58.2 | Broke below 15DMA; weak volume. |
| MCNICHOLS PLC | -5.58% | 54.7 | Bullish signals lost; more downside possible. |
Key Trends & Technical Patterns
- Volume surges with mixed turnover: While traded volume spiked nearly 44%, value fell; suggests heavy trading in low-priced and mid-cap names, typical of profit rotation and renewed retail speculation.
- Market bifurcation: Despite bullish breadth, several ETF and insurance names continue to lag; sector and thematic divergence increases.
- Momentum rotation: Stocks like UPL, BETA GLASS, and LEGEND INTERNET present strong short-term technicals with RSI below overbought, but close watching needed for evidence of exhaustion.
- Top gainers overlap with 5D/YTD momentum list: Notably, BETA GLASS (+9.98% today, +325% YTD) and UPL (+9.85% today, +56% YTD)—momentum following.
- Notable laggards remain under pressure: GREENWICH ETF and GUINEA INSURANCE continue YTD slides.
-
Unusual volume highlights rotational flow:
- CHAMPION BREWERIES: 332.3M shares (+12,892% vs 90D avg), but price -0.8%. Indicates institutional block/cross deals (watch for position reversals); RSI at 54.4, not signaling extreme move—possible consolidation.
- PZ CUSSONS: 46.6M shares (+5,119% vs 90D avg), price +7.03%. Liquidity coming in—possible trend continuation.
- LASACO: Extreme volume, -4.2% price—distribution while retail exits?
Year To Date (YTD) Top Gainers & Losers (trend check)
| Top 5 YTD Gainers | YTD % Chg | RSI | Notes |
|---|---|---|---|
| BETA GLASS CO PLC | +325.3% | 69.6 | Leader; momentum high; watch for profit-taking as RSI approaches 70 |
| LIVINGTRUST MORT. BANK | +55.3% | 100 | RSI maxed out, price extended—overheated. Possible mean reversion soon. |
| UNIVERSITY PRESS PLC | +56.4% | 55.5 | Trend strong, but not yet overbought. |
| NEM INSURANCE | +49.2% | 88.3 | Overbought; technical caution warranted. |
| THOMAS WYATT NIG. PLC | +14.2% | 99.7 | Overextended, RSI suggests euphoria phase. |
| YTD Top 5 Losers | YTD % Chg | RSI | Notes |
|---|---|---|---|
| GREENWICH ASSET ETF | -41.97% | 23.3 | Extreme oversold, sellers in control. |
| GUINEA INSURANCE PLC | -22.47% | 60.7 | Weak YTD, RSI neutral-to-high (bear market rally soon?) |
| SSL TECHNOLOGY | -18.84% | 43.0 | Long-term underperformer, yet RSI neutral. |
| HALDANE MCCALL PLC | -17.86% | 32.1 | Bearish momentum, very weak trend. |
| VETIVA S&P BOND ETF | -11.43% | 50.6 | Cautious; volatility driver, not fundamental. |
Momentum Stock Insights (RSI, 15DMA/50DMA, MACD)
-
Bullish:
- BETA GLASS (RSI 69.6, +9.98% day, above both 15DMA & 50DMA): Tightly coiled and extended. Caution on chasing at these levels; new buyers vulnerable to weakness. MACD histogram negative, so momentum fading; trailing stops recommended.
- MTN NIGERIA (RSI 85.1): Strong run, double 15D/50D MA cross, but very overbought. Look out for quick rotation/profit taking.
- UNIVERSITY PRESS (RSI 55.5): Acceleration phase, 15DMA clear break, not overbought—can ride longer.
- GTCO (YTD +39.9%): RSI above 70, institutional demand, MACD positive—potential for continued outperformance.
- LIVINGTRUST (RSI 100, +55.3% YTD): Highly overbought (potential for rapid mean reversion), but momentum stays hot.
-
Bearish:
- GREENWICH ETF (RSI 23.3): Cratered RSI + heavy selling, below both 15 & 50DMA; avoid until a reversal appears.
- MERGROWTH ETF (RSI 16.6): On trend-followers' radar for a dead-cat bounce; yet, fundamentals remain weak.
- GUINEA INSURANCE (RSI 60.7 but losing streak): Odd: RSI not oversold but YTD returns deeply negative; rally could emerge if short covering commences.
- HALDANE MCCALL (RSI 32.1): Approaching oversold, caution on attempts to catch falling knives.
-
Watch for Topping:
- NEM Insurance and THOMAS WYATT: RSI > 85 and > 99; new entry risky as momentum peaks. Short-term uptrend may stall soon.
- Volume/Volatility Contradiction: CHAMPION BREWERIES shows immense volume, flat-to-down price and neutral RSI = potential inflection point, possible block exit or repositioning.
Contrarian Signals
- CHAMPION BREWERIES: Despite volume explosion (+12,892% above average), price dropped -0.8% and RSI sits at 54.4—possible exhaustion of buyers or institutional offloading. MACD slightly positive = mixed momentum.
- ETERNA PLC: Gained +9.8% today, but RSI dived to 22.97 from 57.95, an unusual move. Price jump on weak relative strength hints at short squeeze or tactical bid, not fundamentals.
- GUINEA INSURANCE: Heavy selloff continues YTD, but RSI a robust 60.7; potential for sharp technical rally if bears tire.
- LIVINGTRUST/THOMAS WYATT/NEM: Extremely high RSI (+99/88), uptrends at euphoria stage—contrarian traders may look to fade these moves if near-term exhaustion appears.
Sector Heatmap
| Sector | Key Movers | Momentum | Institutional Flow | Retail Activity |
|---|---|---|---|---|
| Banking | ZENITHBANK, GTCO, UBA, STERLINGBANK | Bullish | Very High (ZENITHBANK 20.17% of inst. trade value) | Active (retail Top 5: ZENITHBANK, UBA) |
| Insurance | NEM, REGALINS, GUINEAINS | Mixed/Overbought | Moderate | Low |
| ETF/DEBT | GREENWETF, NEWGOLD, MERGROWTH | Bearish | Low | Low |
| Commodities/Beverages | CHAMPION, PZ, WAPIC | Mixed (rotation, block trades) | Block/Institutional | Very High (speculation) |
| Media/Tech/Services | LEGEND, DAARCOMM, ELLAHLAKES | Bullish | Low | High |
| Printing/Publishing | UPL | Bullish | Low | Moderate |
Dividend-Beta Matrix (High Dividend Watch)
| Stock | DivYield % | Beta | Momentum | Trader Insight |
|---|---|---|---|---|
| FCMB | 5.62 | 1.17 | Above 15DMA | High yield, moderate risk, bullish technicals |
| FIDELITYBK | 5.48 | 0.89 | Above 15DMA | Defensive with upside; safe for dividend hunters |
| UBA | 5.96 | 1.56 | Above 15DMA | Yield, stable technicals; can accumulate dips |
| CUTIX | 6.52 | 0.70 | Below 15DMA | Yield but weak chart—wait for reversal |
| NEM | 6.52 | 0.69 | Overbought | Caution: very overheated, past ideal entry |
Institutional Clustering Alerts
- ZENITHBANK: 20.17% of all institutional trade value concentrated here. Strong sector/portfolio allocation signals.
- GTCO: 22.37% of inst. trade value; both banks in technical uptrends, draw confidence institutional rotation continues.
- MTNN: Strong institutional flows (9.11% of value), price at new highs, RSI very overbought—profitable block rotations now dominating.
Trader Notes & Opportunities
- Momentum riders: Stay with stocks above 15DMA and strong RSI (e.g., BETA GLASS, UPL, ZENITHBANK), but trail stops as RSI approaches overbought.
- Yield chasers: Consider accumulating high-dividend names that also post bullish technicals (e.g., UBA, FIDELITYBK, FCMB). Wait for reversal signs in CUTIX before adding.
- Select caution: For stocks like LIVINGTRUST or THOMAS WYATT (RSI > 90), avoid chasing; take profits, review size.
- Contrarian alert: Watch for mean reversion in ETF/insurance names (e.g., GREENWETF, MERGROWTH) if RSI spikes off lows or news catalyst emerges.
- Stocks with both high dividend and bullish technicals: e.g., UBA, FIDELITYBK—attract defensive and momentum investors. Could fuel further institutional flows.
- Unusual volume: For PZ CUSSONS and CHAMPION, monitor next sessions for continuation vs reversal. Price/volume divergence often foreshadows big moves.
Market Activity Summaries: Institutional vs Retail Trading Patterns
- Institutional dominance in value and volume traded—but only 1/3 of total trades. Focused on major banking and telecom blue-chips.
-
Top 5 Institutional Picks:
- ZENITHBANK (8.06% of institutional value; 3.95% volume); MACD stabilizing, above MAs; confirms portfolio rotation.
- GTCO (22.37% of value; 6.9% volume); strong long-term uptrend; institutional conviction deep.
- ACCESSCORP, MTNN, UBA: all feature in top retail trades as well—cross-market liquidity magnets.
- Top 5 Retail Picks: ACCESSCORP, ZENITHBANK, GTCO, MTNN, UBA. Major overlap with top institutional favorites—retail crowds chasing liquidity and trend.
- Correlation: Stocks with high institutional and retail interest (ZENITHBANK, GTCO, MTNN, UBA) also feature on bullish momentum tables and top gainers YTD, strengthening price trends but raising risks of near-term froth.
- For less-liquid names with unusual volume (CHAMPION, PZ), watch for next session—block trades can precede either breakouts or sharp reversals.
Summary Table: Retail vs Institutional Day Trade Highlights
| Investor Type | Trade Count | Volume | Trade Value (Naira) | % Trade Value |
|---|---|---|---|---|
| Institutional | 2,287 | 736.54M | 20.3B | 92.3% |
| Retail | 15,022 | 157.55M | 1.69B | 7.7% |
- With institutional investors owning the bulk of value and volume but retail traders representing nearly 2/3 of all trade tickets, watch for "fast money" reversals as professionals reposition—especially in sectors showing crowding and momentum extremes.
Actionable Takeaways
- Bullish: Quality banking names (ZENITHBANK, GTCO, UBA), high-yield defensive stocks, and select publishers (UPL), provided RSI not overbought.
- Bearish: Avoid ETFs and insurance with declining RSI and persistent YTD losses (GREENWETF, MERGROWTH, GUINEAINS).
- Neutral/Contrarian: Consider monitoring extreme moves (LIVINGTRUST, THOMAS WYATT, MTNN) for potential topping or reversal signals—especially as RSI and volume indicate peak euphoria or institutional repositioning.
- Yield + Momentum overlap: FCMB, UBA, FIDELITYBK provide attractive entry spots for those seeking growth with a dividend cushion.
- For swing traders: Spot opportunities in stocks with recent price/volume divergences and above 15DMA, but be prepared to act quickly if reversal signs appear.
The NGX remains in a bullish posture but undercurrents of mean reversion and sector rotation are growing. Stay nimble, monitor RSI, volume spikes, and institutional flows. Don’t get caught leaning the wrong way at a turning point!
|
Top ASI Gainers Over Last 5 Trading Days
|
Top ASI Losers Over Last 5 Trading Days
|
For more detailed analysis, on InfoWARE Market Data Terminal <NSEPERF> <GO>
On InfoWARE Finance Mobile App (Android, iPhone & iPad, Windows Phone and Windows 8/10), "Top Gainers & Losers"
IKEJA HOTEL PLC (Ikejahotel) topped the advancers list closing at N15.40 with a gain of 10.00% followed by BETA GLASS CO PLC. (BETAGLAS) which closed at N276.00 with a gain of 9.98%.
On the flip side GREENWICH ASSET ETF (GREENWETF) and GUINEA INSURANCE PLC. (GUINEAINS) topped the decliners log with a loss of -9.99% at a close of N309.90, and -9.21% to close the day at N0.69 respectively.
| Symbol | LClose | %Chg |
|---|---|---|
| Ikejahotel | 15.40 | 10.00 |
| BETAGLAS | 276.00 | 9.98 |
| LEGENDINT | 7.20 | 9.92 |
| UPL | 6.02 | 9.85 |
| ETERNA | 42.50 | 9.82 |
For more detailed analysis,
- On InfoWARE Market Data Terminal <TOPG> <GO>
- On InfoWARE Finance Mobile App ( Android, iPhone & iPad and Windows 10) , "Top Gainers & Losers"
Currency Market
In the currency market, the Naira was unchanged against the dollar at 1 to 1NSE: Bull Signal - Price crossed above 15 Day MA
This signal implies these stocks are under buying pressure and the price might continue to rise and therefore positions should be monitored closely. Further suggested analysis include looking at the overall market (ASI) to see if the uptrend is market wide, sector wide or specific to the stock. Portfolio managers tend to use this as a signal to do more research to add to their positions or lock in some profits. Typically further analysis should be done using commands like PC and RV on the InfoWARE Market Data Terminal. Another command is ALERTS to set price triggers for possible exit or entry as necessary
For more detailed analysis,
- On InfoWARE Market Data Terminal <NSEPERF> <GO>
- On InfoWARE Finance Mobile App ( Android , iPhone & iPad and Windows 10) , "Top Gainers & Losers"
| Symbol | Price | %Chg | 15DMA | PE | EPS | DivY | MktCap | Vol | Trades | Value | LstTradeTime |
|---|---|---|---|---|---|---|---|---|---|---|---|
| FGS202760 | 99.99 | 47.99 | 93.47 | 0.00 | 0.00 | 312.00 | 6.00 | 312.17K | 19-Jun-2025 14:32:18.307 | ||
| IKEJAHOTEL | 15.40 | 9.09 | 14.44 | 51.55 | 0.16 | 0.94 | 32.01B | 3.50M | 90.00 | 53.77M | 19-Jun-2025 14:32:00.740 |
| LEGENDINT | 7.20 | 9.03 | 6.58 | 0.00 | 0.00 | 4.72M | 102.00 | 32.27M | 19-Jun-2025 14:32:02.080 | ||
| UPL | 6.02 | 8.97 | 5.66 | 7.13 | 0.59 | 0.60 | 2.60B | 268.08K | 36.00 | 1.61M | 19-Jun-2025 14:32:09.870 |
| STERLINGNG | 5.79 | 8.64 | 5.64 | 15.75 | 0.30 | 3.19 | 166.70B | 9.06M | 287.00 | 50.56M | 19-Jun-2025 14:32:56.563 |
| DAARCOMM | 0.65 | 7.69 | 0.63 | 0.00 | 0.00 | 0.00 | 7.80B | 1.94M | 73.00 | 1.18M | 19-Jun-2025 14:31:59.147 |
| VETGRIF30 | 43.20 | 6.94 | 40.42 | 0.00 | 0.00 | 190.00 | 3.00 | 7.67K | 19-Jun-2025 14:32:57.253 | ||
| JBERGER | 127.00 | 6.69 | 125.15 | 16.73 | 10.31 | 1.74 | 203.20B | 231.37K | 124.00 | 28.35M | 19-Jun-2025 14:32:01.843 |
| FCMB | 9.90 | 4.55 | 9.88 | 104.31 | 0.09 | 5.62 | 196.05B | 6.58M | 254.00 | 63.69M | 19-Jun-2025 14:32:56.503 |
| FIDELITYBK | 19.20 | 3.39 | 19.00 | 13.24 | 1.17 | 5.48 | 556.32B | 33.19M | 518.00 | 636.32M | 19-Jun-2025 14:31:59.813 |
| ZENITHBANK | 49.95 | 2.90 | 48.91 | 3.33 | 13.30 | 2.25 | 1,568.25B | 37.55M | 1,091.00 | 1.89B | 19-Jun-2025 14:33:02.060 |
| UBA | 35.00 | 2.86 | 34.84 | 8.29 | 4.05 | 5.96 | 1,196.98B | 23.85M | 693.00 | 832.80M | 19-Jun-2025 14:32:57.690 |
| UPDCREIT | 6.00 | 1.67 | 5.99 | 9.09 | 0.57 | 10.87 | 16.01B | 4.13M | 90.00 | 24.74M | 19-Jun-2025 14:33:02.780 |
| JAIZBANK | 3.19 | 1.25 | 3.17 | 83.05 | 0.03 | 1.67 | 110.19B | 5.41M | 144.00 | 17.09M | 19-Jun-2025 14:32:01.773 |
NSE: BEAR Signal - Price crossed below 15 Day MA
This signal implies these stocks are under selling pressure and the price might continue to slide and therefore positions should be monitored closely. Further suggested analysis include looking at the overall market (ASI) to see if the downtrend is market wide, sector wide or specific to the stock. If the overal market trend is upwards, then since these stocks are heading in the opposite direction, then further analysis should be done using commands like PC and RV on the InfoWARE Market Data Terminal. Another command is ALERTS to set price triggers for possible exit is necessar
For more detailed analysis,
- On InfoWARE Market Data Terminal <BEARM> <GO>
- On InfoWARE Finance Mobile App ( Android , iPhone & iPad and Windows 10)
| Symbol | Price | %Chg | 15DMA | PE | EPS | DivY | MktCap | Vol | Trades | Value | LstTradeTime |
|---|---|---|---|---|---|---|---|---|---|---|---|
| FGS202778 | 100.00 | 0.00 | 100.00 | 0.00 | 0.00 | 0.00 | 0.00 | 0.00 | 19-Jun-2025 14:32:19.127 | ||
| MBENEFIT | 1.05 | -1.90 | 1.06 | 5.43 | 0.11 | 3.28 | 21.06B | 3.40M | 47.00 | 3.56M | 19-Jun-2025 14:32:02.303 |
| NEWGOLD | 55,800.00 | -2.15 | 56,000.00 | 0.00 | 0.00 | 0.00 | 0.00 | 15.00 | 10.00 | 839.40K | 19-Jun-2025 14:32:57.090 |
| CUTIX | 3.10 | -2.58 | 3.16 | 8.81 | 0.26 | 6.52 | 10.92B | 6.56M | 210.00 | 20.59M | 19-Jun-2025 14:31:59.023 |
| SUNUASSUR | 4.99 | -4.81 | 5.23 | 0.00 | 0.00 | 0.99 | 29.00B | 2.19M | 95.00 | 10.62M | 19-Jun-2025 14:32:56.623 |
| CILEASING | 4.35 | -6.21 | 4.46 | 6.50 | 0.64 | 1.20 | 3.40B | 1.70M | 57.00 | 7.29M | 19-Jun-2025 14:31:58.707 |
| GUINEAINS | 0.69 | -10.14 | 0.70 | 66.79 | 0.01 | 1.96 | 4.24B | 3.05M | 42.00 | 2.15M | 19-Jun-2025 14:32:00.273 |
| FGSUK2032S5 | 90.05 | -26.60 | 103.21 | 0.00 | 0.00 | 500.00 | 2.00 | 450.45K | 19-Jun-2025 14:32:20.697 |
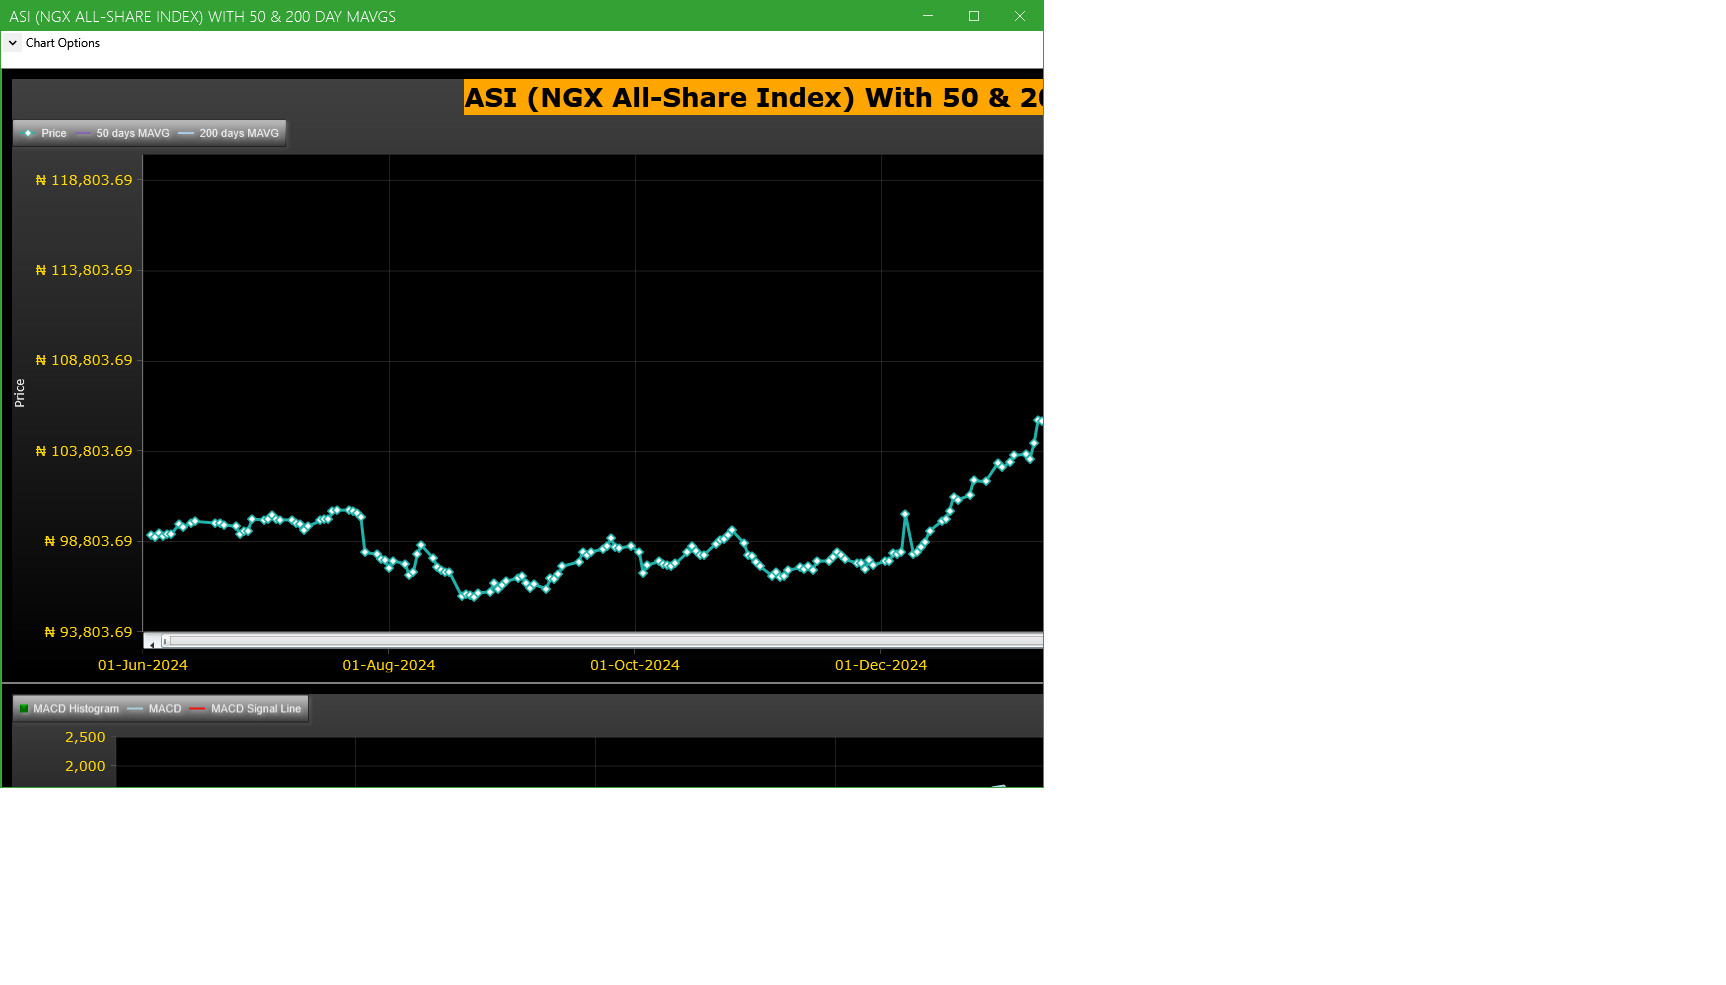
Market Trend - ASI (NGX All-Share-Index) With 50 & 200 Day MAvgs Chart
Technical traders typically use the 50 & 200 day moving averages to aid in choosing
where to enter or exit a position, which then causes these levels to act as strong
support or resistance. As a general guideline, if the price is above a moving average,
the trend is up. If the price is below a moving average, the trend is down.
It is important to note that critics of technical analysis say that moving averages act
as support and resistance because so many traders use these indicators to inform their
trading decisions. Also moving averages tend to work quite well in strong trending conditions
but poorly in choppy or ranging conditions.
Trading Strategies: Crossovers
Crossovers are one of the main moving average strategies. The first type is a price crossover,
which is when the price crosses above or below a moving average to signal a potential change
in trend. Another strategy is to apply two moving averages to a chart: one longer and one
shorter. When the shorter-term MA crosses above the longer-term MA, it is a buy signal, as
it indicates that the trend is shifting up. This is known as a golden cross. Meanwhile, when
the shorter-term MA crosses below the longer-term MA, it is a sell signal, as it indicates that
the trend is shifting down. This is known as a dead/death cross
For more detailed analysis,
- On InfoWARE Market Data Terminal <CI> <GO>
- On InfoWARE Finance Mobile App ( Android , iPhone & iPad and Windows 10) , "Research"
Unusual Volume: Volume traded is more than double the 90 day moving average (All exchanges; ASI & ASem). For more detailed analysis,
- On InfoWARE Market Data Terminal <UV> <GO>
- On InfoWARE Finance Mobile App ( Android , iPhone & iPad and Windows 10)
| Symbol | Name | Volume | 90DAvgVol | %VolChg | Price | LClose | %Chg | Trades | Value |
|---|---|---|---|---|---|---|---|---|---|
| CHAMPION | CHAMPION BREW. PLC. | 332.30M | 2.56M | 12,892.17 | 7.48 | 7.54 | -0.80 | 109 | 2.27B |
| PZ | P Z CUSSONS NIGERIA PLC. | 46.58M | 892.56K | 5,119.23 | 35.00 | 32.70 | 7.03 | 262 | 1.48B |
| ELLAHLAKES | ELLAH LAKES PLC. | 31.15M | 8.72M | 257.07 | 4.85 | 4.60 | 5.43 | 502 | 153.83M |
| LASACO | LASACO ASSURANCE PLC. | 21.91M | 2.65M | 725.61 | 2.97 | 3.10 | -4.19 | 87 | 66.60M |
| WAPIC | WAPIC INSURANCE PLC | 10.69M | 3.71M | 187.89 | 2.00 | 2.00 | 0.00 | 74 | 21.68M |
Investment Insights - High Div. Stocks
Dividend stocks distribute a portion of the company earnings to investors on a regular basis and they can a great choice for investors looking for regular income. As an investment or trading strategy, high dividend yield equities provide annual cash payments as against mostly capital gains in the price of a stock. The list in the table below represent the highest dividend paying stocks from the list of the most liquid stocks in the NSE top 30.
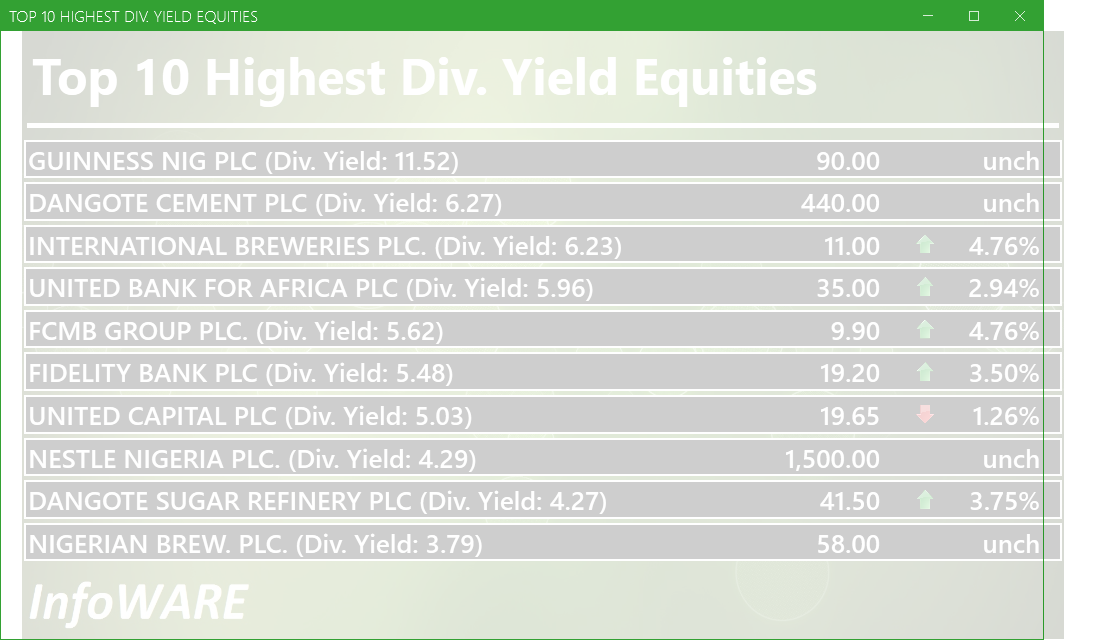
For more detailed analysis,
- On InfoWARE Market Data Terminal <HYIELD> <GO>
- On InfoWARE Finance Mobile App ( Android , iPhone & iPad and Windows 10) , "Research"
African Markets
| Name | LClose | Change | %Chg |
|---|---|---|---|
| BRVM Stock Exchange | 309.09 | 0.99 | 0.32 |
| Botswana Stock Exchange | 10,315.70 | 5.16 | 0.05 |
| Egyptian Exchange | 30,838.98 | 113.68 | 0.37 |
| Ghana Stock Exchange | 6,230.47 | 54.35 | 0.88 |
| Johannesburg Stock Exchange | 94,992.81 | 331.32 | 0.35 |
| Lusaka Stock Exchange | 20,595.76 | 161.43 | 0.79 |
| Casablanca Stock Exchange | 17,865.27 | -213.33 | -1.18 |
| Malawi Stock Exchange | 301,322.15 | 2,421.10 | 0.81 |
| Nigeria Stock Exchange | 116,786.87 | 1,873.09 | 1.63 |
| Nairobi Securities Exchange | 144.37 | 1.27 | 0.89 |
| Namibian Stock Exchange | 1,743.71 | -1.75 | -0.10 |
| Rwanda Stock Exchange | 150.53 | 0.00 | 0.00 |
| Tunis Stock Exchange | 11,127.75 | 0.00 | 0.00 |
| Uganda Securities Exchange | 1,277.08 | 6.23 | 0.49 |
Nigeria Market Indexes
| Symbol | LClose | %Chg | WTD% | MTD% | QTD% | YTD% | MktCap | Trades |
|---|---|---|---|---|---|---|---|---|
| ASI | 117,861.13 | 0.92 | 2.26 | 5.21 | 11.67 | 14.23 | 15,903 | |
| NGX30 | 4,348.30 | 0.96 | 2.16 | 5.23 | 10.95 | 13.98 | 8,360 | |
| NGXAFRBVI | 2,826.37 | 2.58 | 7.33 | 7.57 | 6.13 | 13.93 | 3,838 | |
| NGXAFRHDYI | 18,841.50 | 1.10 | 4.88 | 2.30 | 13.20 | 10.65 | 3,781 | |
| NGXASEM | 1,593.40 | 0.00 | 0.00 | 0.00 | 0.35 | 0.61 | 14 | |
| NGXBNK | 1,241.32 | 2.99 | 6.12 | 6.74 | 6.93 | 14.15 | 3,929 | |
| NGXCG | 3,357.10 | 2.09 | 5.77 | 7.41 | 11.52 | 18.66 | 8,633 | |
| NGXCNSMRGDS | 2,525.22 | 1.02 | 0.35 | 6.19 | 39.08 | 45.60 | 2,016 | |
| NGXCOMMDTY | 1,024.48 | 0.00 | 3.59 | 2.87 | 2.08 | 2.45 | ||
| NGXGROWTH | 8,642.10 | 3.14 | 5.99 | 10.95 | 16.91 | 11.33 | 187 | |
| NGXINDUSTR | 3,542.55 | 0.16 | 0.41 | 2.84 | 1.51 | -0.81 | 1,024 | |
| NGXINS | 731.60 | 1.53 | 3.99 | 5.94 | 7.54 | -6.94 | 1,089 | |
| NGXLOTUSISLM | 8,877.19 | 0.63 | 3.29 | 6.68 | 17.51 | 27.40 | 2,182 | |
| NGXMAINBOARD | 5,772.31 | 0.71 | 0.95 | 3.97 | 14.05 | 15.35 | 11,531 | |
| NGXMERIGRW | 7,851.52 | 2.30 | 3.52 | 2.61 | 14.45 | 20.36 | 2,465 | |
| NGXMERIVAL | 10,567.20 | 2.50 | 6.03 | 2.93 | 2.66 | 1.31 | 4,471 | |
| NGXOILGAS | 2,504.54 | 0.24 | 6.40 | 7.37 | 2.37 | -7.62 | 456 | |
| NGXPENBRD | 2,151.89 | 0.86 | 2.87 | 6.26 | 13.93 | 17.49 | 13,025 | |
| NGXPENSION | 5,656.10 | 1.32 | 4.53 | 7.68 | 18.17 | 24.75 | 9,530 | |
| NGXPREMIUM | 11,424.36 | 1.33 | 4.87 | 9.94 | 12.38 | 17.38 | 4,185 | |
| NGXSOVBND | 651.36 | 0.00 | -0.88 | -0.75 | 3.91 | 8.28 | 0 |
For more detailed analysis,
- On InfoWARE Market Data Terminal <MKTINS> <GO>
- On InfoWARE Finance Mobile App ( Android, iPhone & iPad and Windows 10) , "Market Indexes"
Find the topic interesting? Will like to comment? Contact Us at solutions@infowarelimited.com
Top News

Chart Of The Day - ASI Chart Vs ASI Advance Decline Line (YTD) (19-Jun-2025 15:11:00.892)
InfoWARE AI Analyst Daily Market Report: 19-Jun-2025

[UCAP]>>Corporate Disclosures-<UNITED CAPITAL PLC>
[XNSA]>> CIS ACADEMY TRAINING ON "BOND ANALYSIS, VALUATION & TRADING
[XNSA]>> CORDROS MILESTONE FUNDS' BID & OFFER PRICES
[XNSA]>> NGX FIXED INCOME INDICATIVE PRICE LIST FOR JUN 19, 2025
[LOTUSHAL15]>> [VSPBONDETF]>> DAILY INDICATIVE PRICES
[VSPBONDETF]>> DAILY INDICATIVE PRICES
[XNSA]>> EMERGING AFRICA DAILY FUND PRICES
[XNSA]>> H1 2025 BUSINESS CONTINUITY/DISASTER RECOVERY TEST
[SIAMLETF40]>> DAILY INDICATIVE PRICES
[AIRTELAFRI]>>Corporate Disclosures-<Airtel Africa Plc>
[AIRTELAFRI]>>Corporate Disclosures-<Airtel Africa Plc>
[XNSA]>> H1 2025 BUSINESS CONTUNITY DISASTER RECOVERY TEST
InfoWARE AI Analyst Daily Market Report: 01-Jan-0001

Market Summary 18-06-2025
Chart Of The Day - ASI Chart Vs ASI Advance Decline Line (YTD) (18-Jun-2025 15:08:03.343)
InfoWARE AI Analyst Daily Market Report: 18-Jun-2025
[XNSA]>> CIS ACADEMY TRAINING ON "BOND ANALYSIS, VALUATION & TRADING
[FIDELITYBK]>>Corporate Disclosures-<FIDELITY BANK PLC>
[AIRTELAFRI]>>Corporate Disclosures-<Airtel Africa Plc>
[VSPBONDETF]>> DAILY INDICATIVE PRICES
[XNSA]>> CORDROS MILESTONE FUNDS' BID & OFFER PRICES
[XNSA]>> NGX FIXED INCOME INDICATIVE PRICE LIST FOR JUN 18, 2025
[XNSA]>> DAILY FUND PRICE SUBMISSION - FCMB ASSET MANAGEMENT LIMITED
[XNSA]>> H1 2025 BUSINESS CONTINUITY/DISASTER RECOVERY TEST
[XNSA]>> LIFTING OF SUSPENSION _THOMAS WYATT NIGERIA PLC
[SIAMLETF40]>> DAILY INDICATIVE PRICES
[XNSA]>> NOTIFICATION OF PRICE ADJUSTMENT
[MANSARD]>>Notice of Meeting -<AXA Mansard Insurance Plc>
Get IDIA - the stock trading app for the modern investor
Solutions by Business
Product Suites
Company
Contacts
- 8th Floor,
- South Atlantic Petroleum Towers,
- 1 Adeola Odeku Street,
- Victoria Island,
- Lagos, Nigeria.
- Email: solutions@infowarelimited.com
Follow Us
 |
 |
 |
 |