


InfoWARE AI Analyst Daily Market Report: 24-Jun-2025 | InfoWARE Finance
Get IDIA - the stock trading app for the modern investor


InfoWARE AI Analyst Daily Market Report: 24-Jun-2025
(Source: InfoWARE Terminal, Date: 24-Jun-2025)
Dear Investor,
NGX Market Summary – Tuesday, June 24, 2025
Investors woke up to a vibrant session as the NGX ASI advanced by 1.02% to close at 118,579.65, bringing the Year-To-Date (YTD) return to an impressive 16.10%. Market turnover strengthened, up 7.15% to ₦21.34B, with bullish breadth confirmed by 68 advancers versus just 25 decliners (breadth ratio: 2.72x). Volumes were robust, led by sustained institutional trading (69.7% of today's volumes). Notable price action included DANGSUGAR (+10.0%) at the top of the gainers and a sharp selloff in OKOMUOIL (-10.00%). Momentum signals, especially Moving Average and RSI breakouts, point to continued bullish undercurrents but also expose developing overbought pockets worth watching. Below, we break down today's key statistics and hidden patterns, arming both retail and institutional investors with actionable insights.
1. Market Breadth & Underlying Trends
- Advancers maintained overwhelming dominance (68) against decliners (25), signaling robust bullish sentiment and wide market participation.
- Trading volume rose for 86 stocks, with 55 seeing lower activity: breadth supported by volume is a classic sign of "rising tide lifts all boats."
- Market turnover increased 7.15% to ₦21.34B, and total deals numbered 20,539 – robust liquidity foundation for price moves.
2. Top Gainers & Losers – Momentum in Detail
| Stock | Close | % Change | RSI | MACD |
|---|---|---|---|---|
| DANGSUGAR | 44.00 | +10.00% | 53.4 | 0.56 |
| OKOMUOIL | 748.00 | +10.00% | 95.4 | 23.67 |
| STANBICETF30 | 375.10 | +10.00% | 62.5 | 4.42 |
| UPDC | 3.30 | +10.00% | 49.3 | -0.003 |
| BETAGLAS | 333.95 | +10.00% | 81.8 | 24.54 |
| Stock | Close | % Change | RSI | MACD |
|---|---|---|---|---|
| NEWGOLD ETF | 52,500 | -7.89% | 53.5 | 751.7 |
| DAARCOMM | 0.59 | -7.81% | 51.8 | 0.0024 |
| PRESTIGE | 1.02 | -5.56% | 60.9 | 0.0088 |
| IMG | 33.40 | -4.30% | 47.7 | -0.59 |
| NPFMCRFBK | 2.03 | -4.25% | 51.0 | -0.0094 |
- DANGSUGAR: Top gainer with +10.0%, continues sectoral strength in consumer goods. RSI neutral at 53; further upside likely but watch for rapid reversal cues.
- OKOMUOIL: RSI at an exorbitant 95.4 🚩— severe overbought; signals risk of near-term pullback despite current strength.
- BETAGLAS: 81.8 RSI and strong MACD, confirming breakout; up 414% YTD. May justify profit-taking soon.
- DAARCOMM, IMG and NPF MFB: Notable in both daily and YTD decliners; media and microfinance under continued pressure.
3. Deep Dives: Hidden Insights & Predictions
- Turnover surge: The jump (+7.15%) in traded value hints at renewed institutional engagement and support for large-cap moves. Historically, fresh institutional flows precede multi-session rallies in leading names.
- Advancers/Decliners: The 2.7:1 ratio is considerable; sustainable rallies often draw strength from such broad-based participation. A sign of confidence, with little overhead resistance in the near term.
- Unusual Volume: ROYAL EXCHANGE traded nearly 20x its average volume (1,909% spike). FTNCOCOA and CADBURY also saw outsized activity — patterns suggesting major shifts in holder base or block trades. Monitor for follow-through or sharp reversals here.
- Cross-sectional moves: Several stocks overlap between bullish momentum (15DMA cross above) and unusual volume (UPDC, FTNCOCOA). This combination historically precedes sustained momentum bursts.
- Bearish Outliers: DAARCOMM, REGALINS, and IMG all appeared both in YTD losers and in the ‘below 15DMA’ bearish list — sustained downtrends, reinforcing "avoid" flags for trend-followers.
- YTD Gainers: BETAGLAS (+414%), PRESCO (+168%), and CHAMPION (+160%) remain trending. Many have RSI above 70 (e.g., BETAGLAS at 81.8, CHAMPION at 76.7). These are typical "exhaustion" zones; caution on fresh entries, but momentum traders may ride these with tight stops.
- Bullish Momentum: UPDC's 15DMA cross supported by price and sector flows. However, its P/E is 0 with a massive 34% yield - worth scrutinizing for sustainability.
- Bearish Momentum: MULTIVERSE, FCMB, REGALINS, IMG, and DAARCOMM fell below 15DMA with several showing declining RSI (notably REGALINS: RSI 54.2→52.6). These are stocks losing sponsorship during a rallying market—potential shorts or avoid signals.
Contrarian Signals
- CHAMPION: Despite an RSI in the mid-70s (76.7), strong YTD returns (+160%), and positive MACD, its previous week was mixed (-9.8% YTD). If this persists, short-term retracement is likely before a renewed run-up, making it a "buy the dip" candidate only on evidence of resumed strength.
- OKOMUOIL: Explosive RSI (95.4) and positive MACD BUT moves in tandem with overall institutional flows; any exhaustion here could trigger sizable corrective actions. Contrarians may eye a turn lower.
- ELLAHLAKES: RSI of 82 and huge short-term gain (+32% in 5 days, +114% YTD) after a recent price spike. Contrarians usually anticipate some profit-taking pressure here.
- High Dividend/Yield Caution: UPDC: 34% yield, low price and volume spike. Could signal risk of a "dividend trap" unless payout sustainability is confirmed.
4. Sector Heatmap
| Sector | Bullish Examples | Bearish Examples | Institutional Flow % |
|---|---|---|---|
| Consumer Goods | DANGSUGAR (+10%), CADBURY (+1.4%) | High | |
| Agriculture/Crop Production | OKOMUOIL (+10%), FTNCOCOA (+9.74%) | Moderate | |
| Financials/Banking | FIDELITYBK (+3.95%), ZENITHBANK (+4.23%), UCAP (+0.5%) | FCMB (-0.51%) | Very High |
| Media/Entertainment | DAARCOMM (-7.8%) | Low | |
| Real Estate | UPDC (+10%) | Mod | |
| Diversified/Other F.I. | REGALINS (-3.17%) | Low |
5. Dividend-Beta Matrix (Defensive Opportunities)
| Stock | Dividend Yield | Beta | Interpretation |
|---|---|---|---|
| FIDELITYBK | 5.48% | 0.89 | Solid Yielder, Low Beta: Defensive pick in uncertain market |
| LASACO | 4.05% | 0.71 | Yield, Low Beta: Insurance for downside protection |
| REGALINS | 6.52% | 0.47 | Yield, but price weakness (bearish signals) |
| NPFMCRFBK | 8.0% | 0.28 | |
| UPDC | 34.25% | 1.10 | Very high yield, but must scrutinize sustainability |
6. Institutional Clustering Alerts
- ZENITHBANK: Accounted for 20.17% (₦1.67B) of institutional trade value; institutional clustering and value flows often precede further price trends. Momentum and value buyers remain in control.
- FIDELITYBK and UBA: Both among most traded by both retail and institutional investors, reinforcing broad-based investor confidence.
- OKOMUOIL: 13.7% of institutional trade value today; unusually bullish – but see caution above regarding extreme RSI.
7. YTD Top Gainers & Losers Table (as of Tuesday)
Top 5 YTD Gainers| Stock | YTD %Chg | RSI | Comment |
|---|---|---|---|
| BETAGLAS | +414.56% | 81.8 | Momentum strong, signs of overextension |
| PRESCO | +168.42% | 93.6 | Breakout, trending, RSI extreme |
| CHAMPION | +160.37% | 76.7 | Watch for retrace signs |
| NAHCO | +110.63% | 83.1 | Logistics/handling sector on fire |
| FTNCOCOA | +79.78% | 69.5 | Strong uptrend, +unusual vol |
Top 5 YTD Losers
| Stock | YTD %Chg | RSI | Comment |
|---|---|---|---|
| REGALINS | -21.25% | 54.2 | Persistent downtrend, high yield |
| DAARCOMM | -13.24% | 51.8 | Sinking, loses sponsorship |
| ARADEL | -13.88% | 61.0 | Heavy volatility, avoid |
| IMG | -11.99% | 47.7 | Continued selling |
| MULTIVERSE | +14.29% | 51.7 | Recent stagnation after prior run |
8. Dividend Yield & Momentum Overlaps
- UPDC: Red-flag—34% dividend yield, huge price jump (+10%), and bullish 15DMA crossover. May attract "yield chasers," but P/E and EPS are zero—possible dividend trap. Sustainable only on confirmed payout coverage; watch news.
- FIDELITYBK: Strong 5.5% yield, low beta, popular with both institutional and retail. Attractive for medium-term portfolios.
- REGALINS, NPFMCRFBK: High yields but persistent technical and momentum weakness—caution advised despite income allure.
9. Pro Tips for Traders
- Momentum Play: Ride winners in the short term, especially those with bullish crossover and unusual volume (e.g., FTNCOCOA, UPDC, CADBURY), but keep tight stops given overbought signals.
- Risk Controls: Overheated RSI in leading gainers (OKOMUOIL, BETAGLAS, PRESCO) call for caution. Consider phasing out positions to lock profits, or hedge via options/other mechanisms if available.
- Contrarian "Buy-the-dip": For strong YTD stocks currently retracing (e.g., CHAMPION), initiate buys only after new momentum or support confirmation.
- Yield Hunters: Don't rush into ultra-high dividend stocks without confirming sustainability - especially UPDC and REGALINS.
- Monitor Sectors: Banking, Consumer, and Agriculture stocks are seeing heavy flows and breakouts—opportunities ongoing, but watch for upward exhaustion signals as liquidity rotates.
10. Trade Activity & Market Structure Insights
- Institutional Activity: 38% of trade count, ~70% of volume, and 90% of value: Big money is moving the tape. This confirms depth and that rallies are not just retail-driven froth.
- Retail Activity: 62% of trades, but only ≈30% of volume and <10% of value, mainly focused on lower-priced and mid-cap issues.
- Top Institutional Trades: ZENITHBANK (20.2% value share), FIDELITYBK (6.7%), OKOMUOIL (13.7%), CADBURY, and UBA. These remain primary avenues for further big-ticket moves.
- Top Retail Trades: ACCESSCORP, ZENITHBANK, GTCO, UBA, MTNN. These overlap with institutional picks—signal of confluence and confirm entry/exit liquidity.
- Correlating with technicals: ZENITHBANK, FIDELITYBK, UBA are in both retail and institutional tables and are displaying mid-50 RSI and positive MA trends, indicating consensus bullishness. These are good candidates for liquid, technically-supported trades.
Summary for Investors:
- Today's strong advance, supported by healthy breadth and institutional participation, is bullish—but traders should beware pockets of extreme RSI and be ready for tactical pullbacks, especially in overextended leaders.
- Watch for further volume spikes and follow-through in names with both momentum and unusual activity. Opportunities remain in banking, selected consumer and agric sector names for those managing risk with discipline.
- Dividend chasers should do their homework: high yields on UPDC and REGALINS are tempting, but not automatically safe—scrutinize earnings strength and payout sustainability, and use technical signals as confirmation.
- Institutional clustering (e.g., ZENITHBANK, OKOMUOIL) can prelude continued trends but also signals likely "exit waves” when clusters reverse. Monitor for sharp reversals as turnover shifts.
|
Top ASI Gainers Over Last 5 Trading Days
|
Top ASI Losers Over Last 5 Trading Days
|
For more detailed analysis, on InfoWARE Market Data Terminal <NSEPERF> <GO>
On InfoWARE Finance Mobile App (Android, iPhone & iPad, Windows Phone and Windows 8/10), "Top Gainers & Losers"
DANGOTE SUGAR REFINERY PLC (DANGSUGAR) topped the advancers list closing at N44.00 with a gain of 10.00% followed by OKOMU OIL PALM PLC. (OKOMUOIL) which closed at N748.00 with a gain of 10.00%.
On the flip side NEWGOLD EXCHANGE TRADED FUND (ETF) (NEWGOLD) and DAAR COMMUNICATIONS PLC (DAARCOMM) topped the decliners log with a loss of -7.89% at a close of N52,500.00, and -7.81% to close the day at N0.59 respectively.
| Symbol | LClose | %Chg |
|---|---|---|
| DANGSUGAR | 44.00 | 10.00 |
| OKOMUOIL | 748.00 | 10.00 |
| STANBICETF30 | 375.10 | 10.00 |
| UPDC | 3.30 | 10.00 |
| BETAGLAS | 333.95 | 10.00 |
For more detailed analysis,
- On InfoWARE Market Data Terminal <TOPG> <GO>
- On InfoWARE Finance Mobile App ( Android, iPhone & iPad and Windows 10) , "Top Gainers & Losers"
Currency Market
In the currency market, the Naira was unchanged against the dollar at 1 to 1NSE: Bull Signal - Price crossed above 15 Day MA
This signal implies these stocks are under buying pressure and the price might continue to rise and therefore positions should be monitored closely. Further suggested analysis include looking at the overall market (ASI) to see if the uptrend is market wide, sector wide or specific to the stock. Portfolio managers tend to use this as a signal to do more research to add to their positions or lock in some profits. Typically further analysis should be done using commands like PC and RV on the InfoWARE Market Data Terminal. Another command is ALERTS to set price triggers for possible exit or entry as necessary
For more detailed analysis,
- On InfoWARE Market Data Terminal <NSEPERF> <GO>
- On InfoWARE Finance Mobile App ( Android , iPhone & iPad and Windows 10) , "Top Gainers & Losers"
| Symbol | Price | %Chg | 15DMA | PE | EPS | DivY | MktCap | Vol | Trades | Value | LstTradeTime |
|---|---|---|---|---|---|---|---|---|---|---|---|
| FGS202760 | 89.80 | 33.18 | 88.25 | 0.00 | 0.00 | 42.00K | 5.00 | 31.51M | 24-Jun-2025 14:30:41.933 | ||
| UPDC | 3.30 | 9.09 | 3.02 | 0.00 | 0.00 | 34.25 | 61.25B | 12.27M | 188.00 | 37.35M | 24-Jun-2025 14:31:13.170 |
| CILEASING | 4.71 | 8.92 | 4.50 | 6.50 | 0.64 | 1.20 | 3.68B | 7.39M | 92.00 | 34.58M | 24-Jun-2025 14:30:15.813 |
| JOHNHOLT | 6.80 | 8.82 | 6.70 | 8.80 | 0.91 | 1.25 | 2.65B | 542.58K | 30.00 | 3.69M | 24-Jun-2025 14:30:18.877 |
| MERGROWTH | 403.00 | 8.66 | 398.61 | 0.00 | 0.00 | 208.00 | 4.00 | 84.03K | 24-Jun-2025 14:31:13.647 | ||
| WAPCO | 93.85 | 8.36 | 86.89 | 24.60 | 2.87 | 2.70 | 1,511.72B | 7.49M | 407.00 | 648.32M | 24-Jun-2025 14:31:14.403 |
| LIVESTOCK | 9.00 | 6.11 | 8.64 | 0.00 | 0.00 | 2.94 | 27.00B | 4.78M | 174.00 | 42.23M | 24-Jun-2025 14:30:19.237 |
| LASACO | 3.19 | 5.96 | 3.07 | 21.56 | 0.11 | 4.05 | 5.85B | 2.72M | 61.00 | 8.29M | 24-Jun-2025 14:30:18.957 |
| TANTALIZER | 2.32 | 5.60 | 2.28 | 0.00 | 0.00 | 1.50 | 7.45B | 3.46M | 84.00 | 7.93M | 24-Jun-2025 14:31:13.150 |
| JBERGER | 124.40 | 5.55 | 121.68 | 16.73 | 10.31 | 1.74 | 199.04B | 490.13K | 155.00 | 60.02M | 24-Jun-2025 14:30:18.813 |
| HMCALL | 4.20 | 4.76 | 4.19 | 0.00 | 0.00 | 0.00 | 0.00 | 349.24K | 22.00 | 1.47M | 24-Jun-2025 14:30:18.087 |
| INTENEGINS | 1.72 | 4.65 | 1.71 | 0.52 | 2.85 | 3.40 | 2.21B | 507.52K | 20.00 | 877.85K | 24-Jun-2025 14:30:18.633 |
| FIDELITYBK | 19.75 | 3.80 | 19.22 | 13.24 | 1.17 | 5.48 | 572.25B | 83.93M | 777.00 | 1.63B | 24-Jun-2025 14:30:17.087 |
| DEAPCAP | 0.95 | 2.11 | 0.93 | 188.84 | 0.01 | 13.76 | 1.43B | 516.53K | 32.00 | 491.98K | 24-Jun-2025 14:30:16.520 |
| AIICO | 1.62 | 1.85 | 1.61 | 2.01 | 0.60 | 4.13 | 59.30B | 19.10M | 325.00 | 30.38M | 24-Jun-2025 14:30:14.633 |
| ETI | 31.00 | 1.61 | 30.83 | 5.00 | 5.10 | 2.00 | 568.84B | 2.03M | 71.00 | 62.89M | 24-Jun-2025 14:30:16.777 |
| UNILEVER | 46.50 | 0.97 | 46.47 | 67.09 | 0.40 | 2.81 | 267.14B | 1.96M | 119.00 | 91.30M | 24-Jun-2025 14:30:31.453 |
| UCAP | 19.45 | 0.51 | 19.36 | 19.15 | 0.93 | 5.03 | 116.70B | 7.00M | 300.00 | 136.27M | 24-Jun-2025 14:30:31.370 |
NSE: BEAR Signal - Price crossed below 15 Day MA
This signal implies these stocks are under selling pressure and the price might continue to slide and therefore positions should be monitored closely. Further suggested analysis include looking at the overall market (ASI) to see if the downtrend is market wide, sector wide or specific to the stock. If the overal market trend is upwards, then since these stocks are heading in the opposite direction, then further analysis should be done using commands like PC and RV on the InfoWARE Market Data Terminal. Another command is ALERTS to set price triggers for possible exit is necessar
For more detailed analysis,
- On InfoWARE Market Data Terminal <BEARM> <GO>
- On InfoWARE Finance Mobile App ( Android , iPhone & iPad and Windows 10)
| Symbol | Price | %Chg | 15DMA | PE | EPS | DivY | MktCap | Vol | Trades | Value | LstTradeTime |
|---|---|---|---|---|---|---|---|---|---|---|---|
| MULTIVERSE | 9.20 | 0.00 | 9.24 | 0.00 | 0.00 | 0.85 | 3.92B | 95.98K | 21.00 | 888.19K | 24-Jun-2025 14:30:20.000 |
| FCMB | 9.85 | -0.51 | 9.86 | 104.31 | 0.09 | 5.62 | 195.06B | 12.31M | 282.00 | 120.30M | 24-Jun-2025 14:31:12.947 |
| REGALINS | 0.63 | -3.17 | 0.64 | 4.35 | 0.11 | 6.52 | 4.20B | 3.01M | 24.00 | 1.92M | 24-Jun-2025 14:30:29.547 |
| FIRSTHOLDCO | 26.90 | -4.09 | 27.46 | 0.00 | 0.00 | 3.90M | 357.00 | 105.49M | 24-Jun-2025 14:31:14.157 | ||
| ARADEL | 515.00 | -4.23 | 522.60 | 0.00 | 0.00 | 1.72 | 2,237.59B | 3.18M | 583.00 | 1.63B | 24-Jun-2025 14:30:14.787 |
| NPFMCRFBK | 2.03 | -4.43 | 2.08 | 5.63 | 0.27 | 8.00 | 12.17B | 2.21M | 68.00 | 4.60M | 24-Jun-2025 14:30:28.373 |
| IMG | 33.40 | -4.49 | 34.39 | 59.72 | 0.64 | 1.32 | 16.68B | 367.70K | 33.00 | 12.09M | 24-Jun-2025 14:30:18.360 |
| DAARCOMM | 0.59 | -8.47 | 0.62 | 0.00 | 0.00 | 0.00 | 7.08B | 12.93M | 150.00 | 7.72M | 24-Jun-2025 14:31:12.927 |
| NEWGOLD | 52,500.00 | -8.57 | 55,046.67 | 0.00 | 0.00 | 0.00 | 0.00 | 102.00 | 13.00 | 3.58M | 24-Jun-2025 14:31:13.673 |
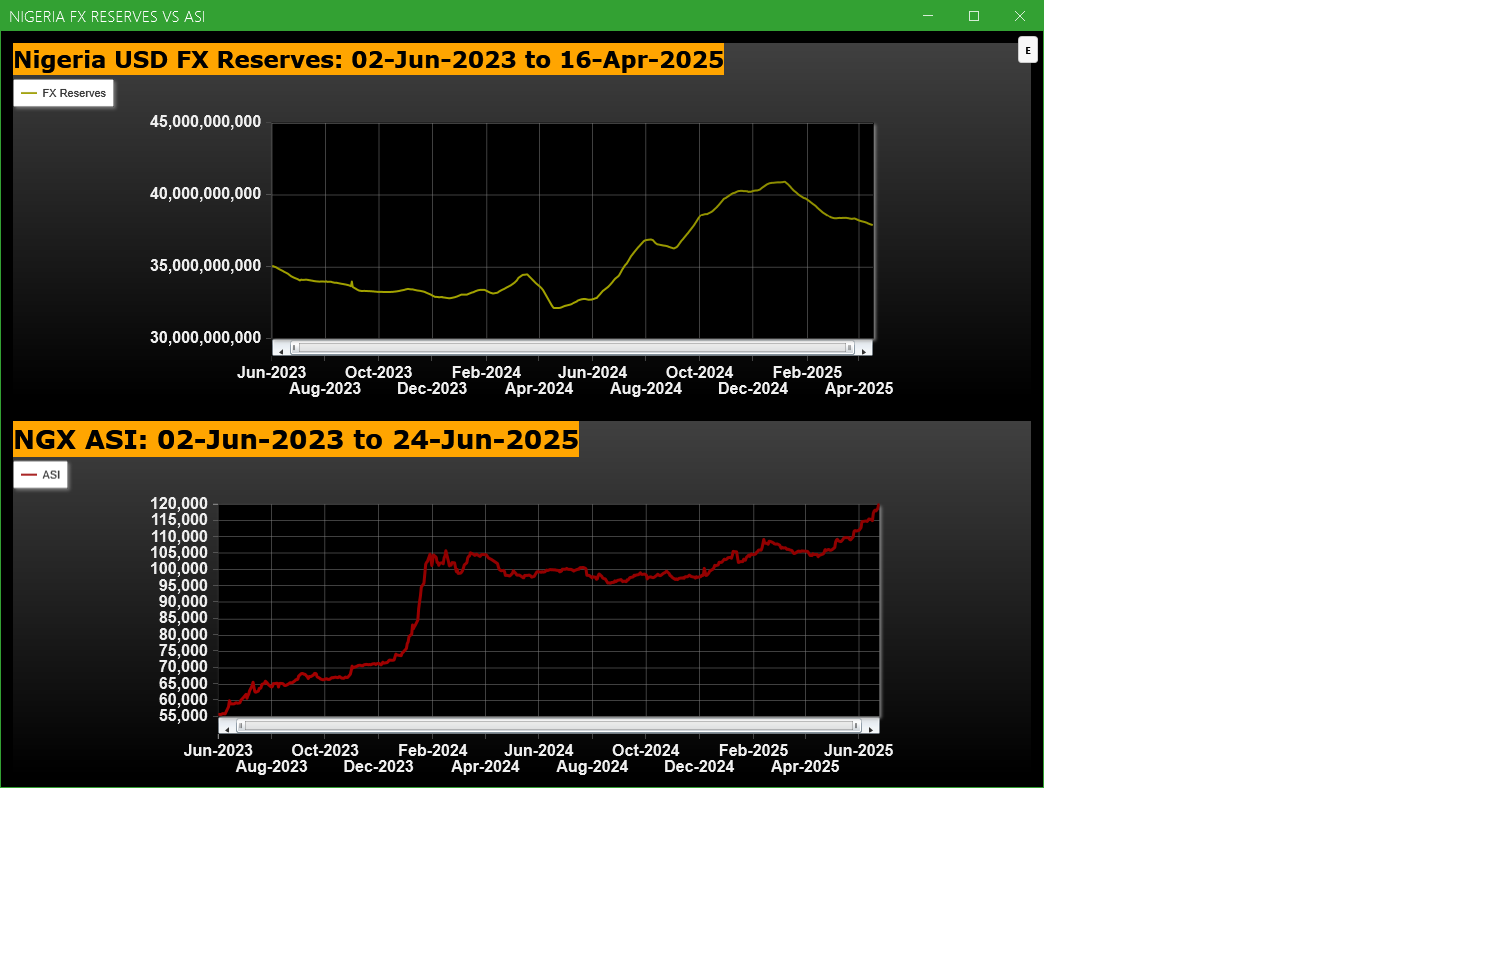
Economic Indicators - Nigeria FX Reserves Vs ASI Chart
Nigeria FX Reserves are assets held on reserve by CBN in foreign currencies. These reserves are used to back liabilities and influence monetary policy. Given the nature of the Nigeria economy, FX Reserves can appear to have an outsize influence on the economy and hence on the capital market. The chart below allows comparison of FX Reserves against the ASI to make investment decisions
For more detailed analysis,
- On InfoWARE Market Data Terminal <CI> <GO>
- On InfoWARE Finance Mobile App ( Android , iPhone & iPad and Windows 10) , "Research"
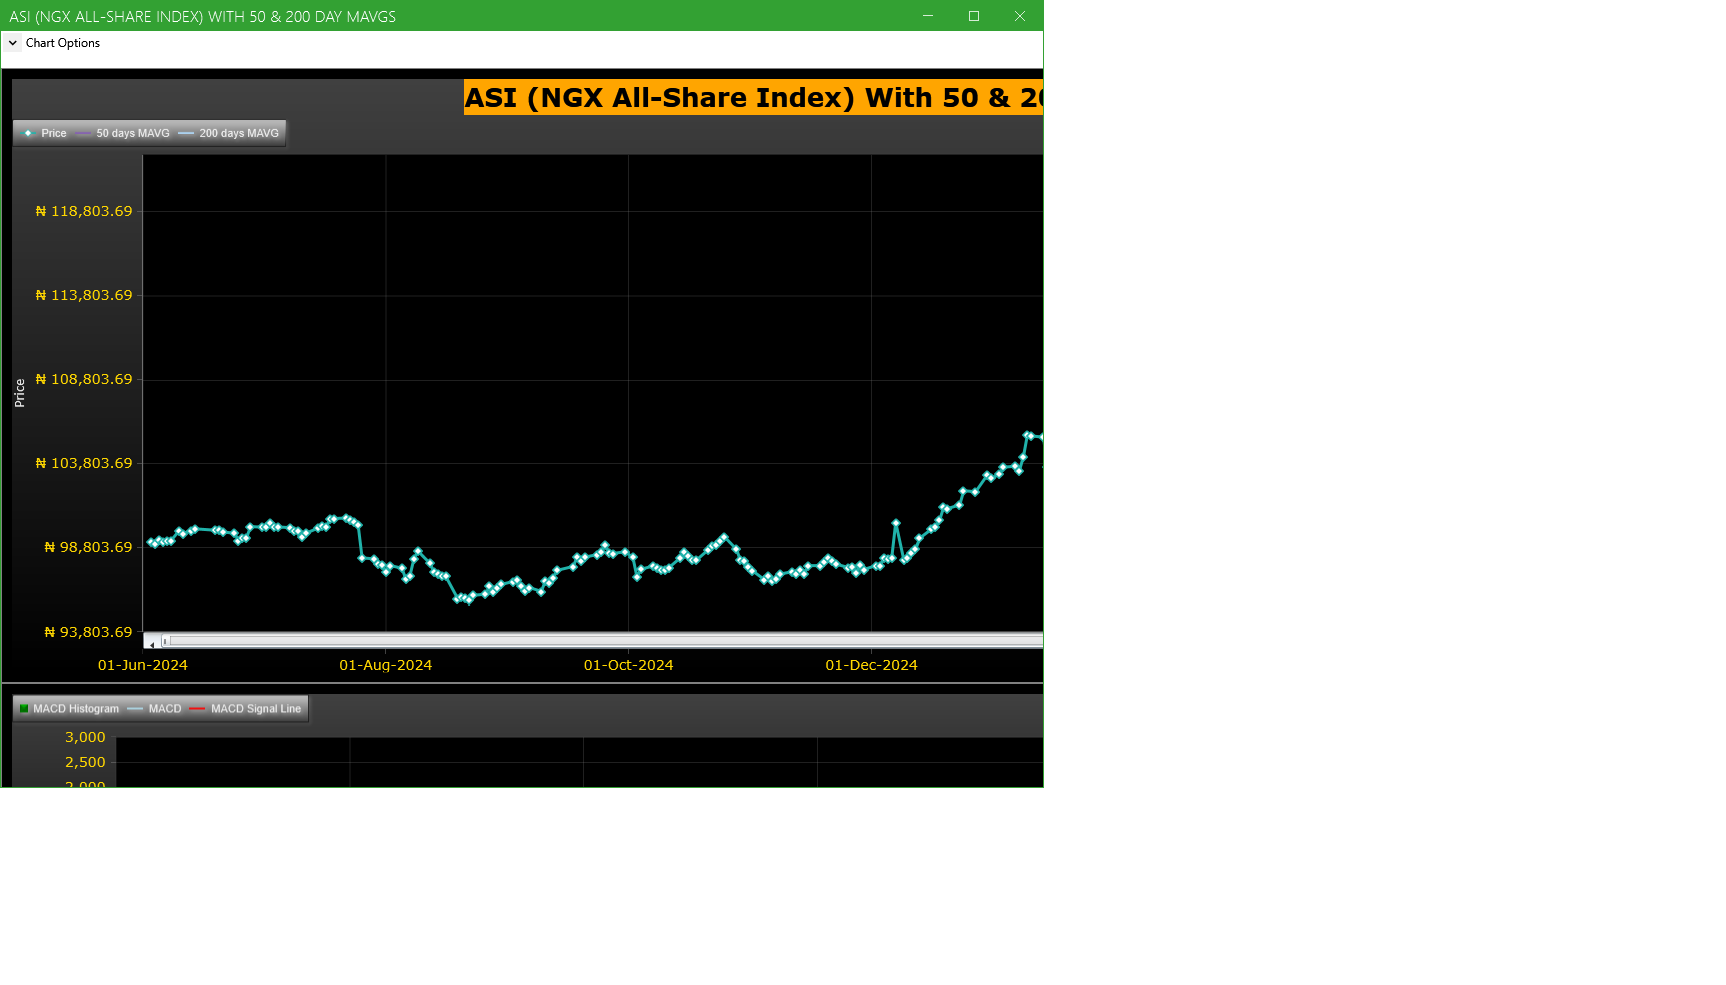
Market Trend - ASI (NGX All-Share-Index) With 50 & 200 Day MAvgs Chart
Technical traders typically use the 50 & 200 day moving averages to aid in choosing
where to enter or exit a position, which then causes these levels to act as strong
support or resistance. As a general guideline, if the price is above a moving average,
the trend is up. If the price is below a moving average, the trend is down.
It is important to note that critics of technical analysis say that moving averages act
as support and resistance because so many traders use these indicators to inform their
trading decisions. Also moving averages tend to work quite well in strong trending conditions
but poorly in choppy or ranging conditions.
Trading Strategies: Crossovers
Crossovers are one of the main moving average strategies. The first type is a price crossover,
which is when the price crosses above or below a moving average to signal a potential change
in trend. Another strategy is to apply two moving averages to a chart: one longer and one
shorter. When the shorter-term MA crosses above the longer-term MA, it is a buy signal, as
it indicates that the trend is shifting up. This is known as a golden cross. Meanwhile, when
the shorter-term MA crosses below the longer-term MA, it is a sell signal, as it indicates that
the trend is shifting down. This is known as a dead/death cross
For more detailed analysis,
- On InfoWARE Market Data Terminal <CI> <GO>
- On InfoWARE Finance Mobile App ( Android , iPhone & iPad and Windows 10) , "Research"
Unusual Volume: Volume traded is more than double the 90 day moving average (All exchanges; ASI & ASem). For more detailed analysis,
- On InfoWARE Market Data Terminal <UV> <GO>
- On InfoWARE Finance Mobile App ( Android , iPhone & iPad and Windows 10)
| Symbol | Name | Volume | 90DAvgVol | %VolChg | Price | LClose | %Chg | Trades | Value |
|---|---|---|---|---|---|---|---|---|---|
| ROYALEX | ROYAL EXCHANGE PLC. | 103.58M | 5.16M | 1,909.06 | 1.00 | 1.04 | -3.85 | 47 | 113.80M |
| FTNCOCOA | FTN COCOA PROCESSORS PLC | 24.17M | 5.16M | 368.37 | 3.38 | 3.08 | 9.74 | 330 | 81.28M |
| CUSTODIAN | CUSTODIAN AND ALLIED PLC | 19.01M | 7.27M | 161.66 | 25.05 | 25.00 | 0.20 | 85 | 476.57M |
| CADBURY | CADBURY NIGERIA PLC. | 17.43M | 1.54M | 1,029.97 | 39.80 | 39.25 | 1.40 | 603 | 684.47M |
| CWG | COMPUTER WAREHOUSE GROUP PLC | 15.60M | 5.41M | 188.53 | 10.55 | 9.60 | 9.90 | 225 | 161.27M |
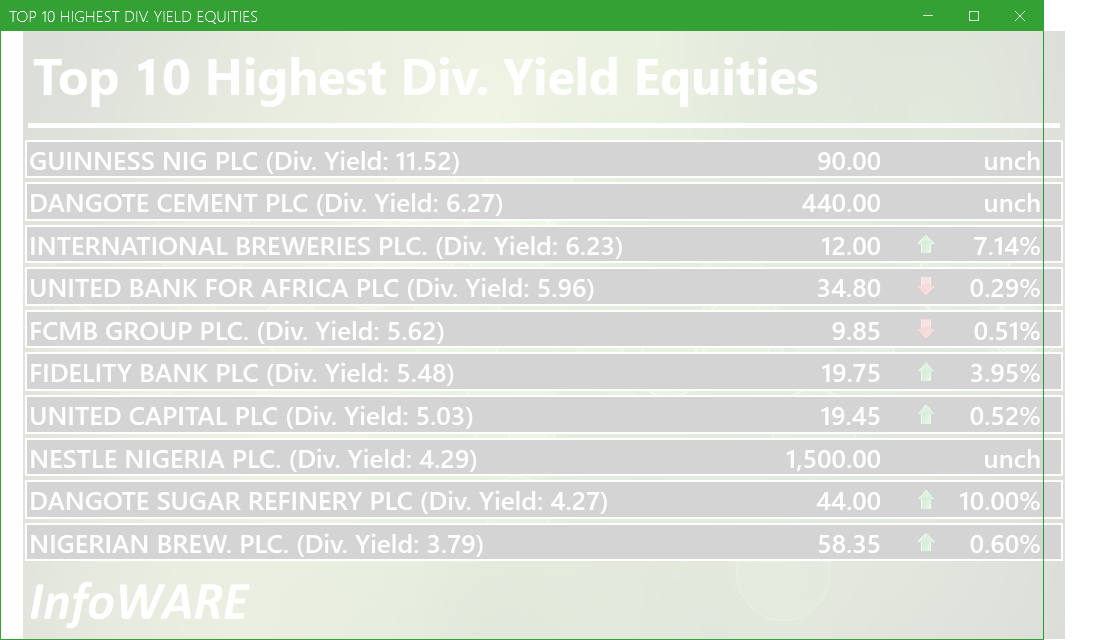
Investment Insights - High Div. Stocks
Dividend stocks distribute a portion of the company earnings to investors on a regular basis and they can a great choice for investors looking for regular income. As an investment or trading strategy, high dividend yield equities provide annual cash payments as against mostly capital gains in the price of a stock. The list in the table below represent the highest dividend paying stocks from the list of the most liquid stocks in the NSE top 30.
For more detailed analysis,
- On InfoWARE Market Data Terminal <HYIELD> <GO>
- On InfoWARE Finance Mobile App ( Android , iPhone & iPad and Windows 10) , "Research"
African Markets
| Name | LClose | Change | %Chg |
|---|---|---|---|
| BRVM Stock Exchange | 312.41 | -0.59 | -0.19 |
| Botswana Stock Exchange | 10,351.25 | 0.00 | 0.00 |
| Egyptian Exchange | 31,418.74 | 363.35 | 1.17 |
| Ghana Stock Exchange | 6,250.15 | 39.75 | 0.64 |
| Johannesburg Stock Exchange | 95,128.19 | 416.73 | 0.44 |
| Lusaka Stock Exchange | 20,625.20 | 102.61 | 0.50 |
| Casablanca Stock Exchange | 17,754.25 | -202.92 | -1.13 |
| Malawi Stock Exchange | 310,625.04 | 3,592.28 | 1.17 |
| Nigeria Stock Exchange | 118,579.65 | 437.13 | 0.37 |
| Nairobi Securities Exchange | 145.76 | 0.07 | 0.05 |
| Namibian Stock Exchange | 1,717.27 | -17.17 | -0.99 |
| Rwanda Stock Exchange | 150.49 | -0.05 | -0.03 |
| Tunis Stock Exchange | 11,321.59 | 23.73 | 0.21 |
| Uganda Securities Exchange | 1,273.71 | -9.11 | -0.71 |
Nigeria Market Indexes
| Symbol | LClose | %Chg | WTD% | MTD% | QTD% | YTD% | MktCap | Trades |
|---|---|---|---|---|---|---|---|---|
| ASI | 119,790.82 | 1.02 | 1.02 | 6.93 | 13.50 | 16.10 | 20,539 | |
| NGX30 | 4,426.86 | 1.26 | 1.26 | 7.13 | 12.95 | 16.04 | 10,604 | |
| NGXAFRBVI | 2,938.69 | 1.34 | 1.34 | 11.85 | 10.35 | 18.46 | 3,919 | |
| NGXAFRHDYI | 19,304.53 | 0.71 | 0.71 | 4.82 | 15.99 | 13.37 | 4,294 | |
| NGXASEM | 1,593.40 | 0.00 | 0.00 | 0.00 | 0.35 | 0.61 | 8 | |
| NGXBNK | 1,281.55 | 0.94 | 0.94 | 10.20 | 10.40 | 17.85 | 4,435 | |
| NGXCG | 3,434.53 | 1.01 | 1.01 | 9.88 | 14.09 | 21.39 | 10,264 | |
| NGXCNSMRGDS | 2,590.57 | 2.01 | 2.01 | 8.93 | 42.68 | 49.37 | 3,016 | |
| NGXCOMMDTY | 1,044.10 | 0.28 | 0.28 | 4.84 | 4.04 | 4.41 | ||
| NGXGROWTH | 8,652.39 | 0.05 | 0.05 | 11.08 | 17.05 | 11.46 | 199 | |
| NGXINDUSTR | 3,632.14 | 3.13 | 3.13 | 5.45 | 4.07 | 1.69 | 1,934 | |
| NGXINS | 737.95 | 0.06 | 0.06 | 6.86 | 8.48 | -6.14 | 1,354 | |
| NGXLOTUSISLM | 9,304.85 | 3.17 | 3.17 | 11.82 | 23.17 | 33.54 | 3,877 | |
| NGXMAINBOARD | 5,879.77 | 1.02 | 1.02 | 5.90 | 16.17 | 17.50 | 15,482 | |
| NGXMERIGRW | 8,165.90 | 2.78 | 2.78 | 6.72 | 19.04 | 25.18 | 4,071 | |
| NGXMERIVAL | 10,982.74 | 2.99 | 2.99 | 6.98 | 6.70 | 5.30 | 5,258 | |
| NGXOILGAS | 2,473.19 | -1.51 | -1.51 | 6.02 | 1.09 | -8.78 | 522 | |
| NGXPENBRD | 2,183.63 | 0.90 | 0.90 | 7.82 | 15.61 | 19.22 | 16,905 | |
| NGXPENSION | 5,789.59 | 1.16 | 1.16 | 10.22 | 20.96 | 27.69 | 12,696 | |
| NGXPREMIUM | 11,562.37 | 1.03 | 1.03 | 11.27 | 13.74 | 18.80 | 4,858 | |
| NGXSOVBND | 652.03 | 0.00 | 0.00 | -0.64 | 4.02 | 8.39 | 0 |
For more detailed analysis,
- On InfoWARE Market Data Terminal <MKTINS> <GO>
- On InfoWARE Finance Mobile App ( Android, iPhone & iPad and Windows 10) , "Market Indexes"
Find the topic interesting? Will like to comment? Contact Us at solutions@infowarelimited.com
Top News

Chart Of The Day - ASI Chart Vs ASI Advance Decline Line (YTD) (24-Jun-2025 15:07:06.121)
InfoWARE AI Analyst Daily Market Report: 24-Jun-2025

[DANGCEM]>>Corporate Disclosures-<DANGOTE CEMENT PLC>
[XNSA]>> CORDROS MILESTONE FUNDS' BID & OFFER PRICES
[XNSA]>> CIS TRAINING ON "RETIREMENT PLANNING AND WEALTH CREATION & MANAGEMENT
[BUACEMENT]>>Notice of Meeting -<BUA Cement Plc>
Please refer to Encoded Headline
[XNSA]>> DAILY FUND PRICE SUBMISSION - FCMB ASSET MANAGEMENT LIMITED
[AIRTELAFRI]>>Corporate Disclosures-<Airtel Africa Plc>
[NESTLE]>>Corporate Disclosures-<NESTLE NIGERIA PLC.>
[XNSA]>> OFF MARKET TRADE
[SIAMLETF40]>> DAILY INDICATIVE PRICES
Chart Of The Day - ASI Chart Vs ASI Advance Decline Line (YTD) (23-Jun-2025 15:10:18.461)
InfoWARE AI Analyst Daily Market Report: 23-Jun-2025
[NASCON]>>Notice of Meeting -<NASCON Allied Industries Plc>
[XNSA]>> CIS TRAINING ON "RETIREMENT PLANNING AND WEALTH CREATION & MANAGEMENT
[NEWGOLD]>> DAILY INDICATIVE PRICES
[VETBANK]>> DAILY INDICATIVE PRICES
[XNSA]>> NGX FIXED INCOME INDICATIVE PRICE LIST FOR JUN 23, 2025
[XNSA]>> DAILY FUND PRICE SUBMISSION - FCMB ASSET MANAGEMENT LIMITED
[LASACO]>>Corporate Disclosures-<LASACO ASSURANCE PLC.>
[MERVALUE]>> DAILY INDICATIVE PRICES
[XNSA]>> EMERGING AFRICA DAILY FUND PRICES
[XNSA]>> CORDROS MILESTONE FUNDS' BID & OFFER PRICES
[MTNN]>>Notice of Meeting -<MTN Nigeria Communications Plc>
[SOVRENINS]>>Corporate Disclosures-<SOVEREIGN TRUST INSURANCE PLC>
InfoWARE AI Analyst Weekly Market Report: 20-Jun-2025
Chart Of The Day - ASI Chart Vs ASI Advance Decline Line (YTD) (20-Jun-2025 15:07:23.447)
InfoWARE AI Analyst Daily Market Report: 20-Jun-2025
[NEWGOLD]>>Corporate Disclosures-<NEWGOLD EXCHANGE TRADED FUND (ETF)>
Get IDIA - the stock trading app for the modern investor
Solutions by Business
Product Suites
Company
Contacts
- 8th Floor,
- South Atlantic Petroleum Towers,
- 1 Adeola Odeku Street,
- Victoria Island,
- Lagos, Nigeria.
- Email: solutions@infowarelimited.com
Follow Us
 |
 |
 |
 |