


InfoWARE AI Analyst Daily Market Report: 04-Jul-2025 | InfoWARE Finance
Get IDIA - the stock trading app for the modern investor


InfoWARE AI Analyst Daily Market Report: 04-Jul-2025
(Source: InfoWARE Terminal, Date: 04-Jul-2025)
Dear Investor,
NGX Daily Market Summary & Insights – Friday, July 4, 2025
The NGX All Share Index (ASI) inched up by 0.01% to close at 120,977.20, pushing year-to-date gains to 17.26%. Market breadth favored advancers, with a healthy 44 stocks rising versus 29 decliners (breadth ratio: 1.52x). However, underlying activity was sluggish — total market turnover plunged by -64.05% to 10.18B Naira despite still robust trading volumes (862.22M). Sellers dominated some high-flyer names after recent rallies, while ETFs and select insurance and banking tickers caught significant flows. The Naira also firmed up slightly, gaining 0.33% against the Dollar (now ₦1,528/$1).
Key Market Trends & Bullet Insights
- Market Breadth: Advancers outpaced decliners (44:29), but with 62 companies showing volume increases against 78 with declines, suggesting profit-taking and mixed conviction.
- Top Gainer: VSPBONDETF (Vetiva S & P Nigeria Sovereign Bond ETF) soared +67.10%, driven by an impressive MACD divergence and a post-correction rally.
- Top Loser: CHAMPION (Champion Brew. Plc) slumped -10.00%. Despite extremely high RSI (80.88—a textbook overbought signal), this looks like a classic "profit-taking" reversal after meteoric YTD gains.
-
Other Noteworthy Movers:
- JOHNHOLT +10.0%, REDSTAREX +9.99%, ACADEMY +9.98%—all posted strong technical momentum.
- Ella Lakes (ELLAHLAKES) tanked -10% despite a feverish RSI of 85.24 (potential exhaustion sell-off).
- JAPAULGOLD drew attention with both an unusual volume spike (+690% over 90D average) and a steep loss (-9.7%).
Momentum, Risk & Technical Readings
-
Bullish Momentum Standouts:
- ACADEMY: RSI at 83.12, up +9.98%, and price well above both 15D & 50D MAs—strong technical buy zones, but overextended; expect potential mean reversion.
- VSPBONDETF: Strong MACD crossover, big move after consolidation, and negative beta—suggesting decorrelation from broad market.
- REDSTAREX displayed both a price breakout above its 15DMA and a 6.12% yield, appealing to both growth and income investors.
-
Bearish Momentum Signals:
- PZ Cussons (PZ): Dropped below 15DMA (-11.11% today), with significant institutional sell flows and MACD trending negative.
- LINKASSURE (Linkage Assurance): RSI fell from 64 to 56.9, price sank -3.33% (now below 15DMA) despite an eye-catching 5.56% yield.
-
Unusual Volume Movers:
- JAPAULGOLD: Volume nearly 7x normal, but price dropped; massive rotation or unwinding at play.
- CONHALLPLC and WAPIC: Insurance names continue to draw speculative activity—watch for aftershocks.
- Turnover Downturn: With value traded down -64% and institutional participation still 76.7% of today's value, it signals the "smart money" may be sitting on the sidelines—participants should be alert for ensuing volatility.
Year-to-Date (YTD) Performance Table
| Symbol | Name | YTD %Chg | 5D %Chg | Dividend Yield | RSI |
|---|---|---|---|---|---|
| CHAMPION | Champion Brew. Plc | 246.46% | 32.00% | 0.41% | 80.88 |
| FTNCOCOA | FTN Cocoa Processors | 148.40% | 27.60% | 1.60% | 81.55 |
| UPDC | UPDC Plc | 173.99% | 45.85% | 34.25% | 76.13 |
| ELLAHLAKES | Ellah Lakes Plc | 169.10% | 6.02% | 0.00% | 85.24 |
| SCOA | SCOA Nigeria | 135.92% | -9.83% | 3.40% | 29.92 |
| GREENWETF | Greenwich Asset ETF | -58.10% | -18.99% | 0.00% | 17.25 |
| SUNUASSUR | SUNU Assurances | -57.08% | -2.72% | 0.99% | 46.88 |
| DANGCEM | Dangote Cement | -11.24% | -3.41% | 6.27% | 40.05 |
| BUACEMENT | BUA Cement | -0.54% | -3.04% | 2.11% | 60.75 |
| HMCALL | Haldane McCall Plc | -17.86% | -4.76% | 0.00% | 30.32 |
Contrarian Signals
- CHAMPION: Despite a dramatic 246.5% YTD surge and ongoing bullish MACD, the 10% crash today & RSI at 80.88 ("overbought") hints at exhaustion—contrarians watch for further pullback.
- SCOA: YTD performance is strong (135.9%), yet RSI at 29.9 (oversold) and 5D -9.83% dip indicates temporary capitulation; technically attractive for "buy-the-dip" traders.
- BUACEMENT: Price below 15DMA, soft YTD (-0.54%), but positive MACD and healthy institutional flows—possible reversal candidate if sector sentiment improves.
- PZ: Ongoing heavy institutional trading, yet a negative day, declining trend and rising RSI—signals ongoing battle between long-term support and short-term profit-taking.
Sector Heatmap
| Sector | Example Ticker | Perf (Today) | 15D/50D MA Trend | Institutional Activity | Technical Rating |
|---|---|---|---|---|---|
| ETF/Bonds | VSPBONDETF | +67.10% | 15DMA > 50DMA | Low | Bullish |
| Insurance | WAPIC/CONHALLPLC | Mixed | Many above 15DMA | Growing | Speculative/Bullish |
| Banking | GTCO/ACCESSCORP/ZENITHBANK | Flat | Above 15DMA | High | Defensive/Neutral |
| Personal/Household | PZ | -10.0% | Below 15DMA | Very High | Bearish |
| Building Materials | BUACEMENT/DANGCEM | Weak | Below 15DMA | Solid | Bearish/Contrarian |
Dividend-Beta Matrix
| Ticker | Dividend Yield | Beta | Risk Profiling |
|---|---|---|---|
| REDSTAREX | 6.12% | 0.21 | Low risk, high income—defensive |
| DANGCEM | 6.27% | 1.94 | High yield, high risk—volatile |
| UPDC | 34.25% | 1.10 | Extremely high yield, moderate risk, but watch sustainability |
| ZENITHBANK | 2.25% | 1.20 | Banking, moderate risk |
| AFRIPRUD (illustrative) | 1.27% | 0.64 | Defensive |
Institutional Clustering Alerts
- ZENITHBANK: Institutional flows claimed 20.17% of trade value—indicating significant interest. This bank remains a bellwether for market sentiment and resilience.
- PZ Cussons: Saw immense institutional (and retail) rotation with over -10% drop and 803% volume above average—high conviction profit-taking or risk-off move.
- GTCO, ACCESSCORP: Remain institutional favorites, but volumes are lower than average—suggests wait-and-see stance among asset managers.
Retail vs Institutional Trading Patterns & Activity
- Retail investors dominated trade count by volume (59.2% of deals), but institutionals controlled larger blocks (53% by volume; 76.7% of value), signaling continued "big money" influence.
-
Institutional Top 5: PZ, GTCO, ACCESSCORP, ZENITHBANK, JAPAULGOLD.
- PZ's concentration among institutionals with an outsized volume signals sector de-risking.
- JAPAULGOLD—present in both institutional and retail top 5 with huge volume—potential "toppy" or rotational.
- Retail Top 5: ELLAHLAKES, JAPAULGOLD, ACCESSCORP, GTCO, ZENITHBANK—mirrors broad market favorites, but with greater speculative flavor (e.g., ELLAHLAKES).
-
Insights & Patterns:
- Stocks with both institutional and retail high turnover (e.g., GTCO, ACCESSCORP, ZENITHBANK, JAPAULGOLD) tend to be more volatile and can see sharp moves if sentiment shifts.
- The sharp value drop in turnover vs. steady volumes suggests profit booking or hesitation—expect short-term volatility spikes.
Trader Suggestions & Notable Opportunities
- Bullish crossovers with strong momentum (e.g., ACADEMY, REDSTAREX, VSPBONDETF): Momentum traders can look for "buy-the-dip" opportunities, but beware high RSI levels.
- Contrarian Buy Zones: SCOA, DANGCEM, and even BUACEMENT—oversold on technicals, but fundamentally viable.
- Bullish Dividend Defensives: REDSTAREX (high yield, low beta) could serve as a buffer in volatile periods.
- Bearish momentum picks: LINKASSURE, PZ (both below 15DMA, heavy institutional selling)—consider short/interim sell or monitoring for reversal.
- Monitor JAPAULGOLD for reversal: Massive volume spike with high RSI and price drop; often a precursor to further volatility or quick rebounds.
- Reduce risk in highly overbought stocks: e.g., CHAMPION, ACADEMY, FTNCOCOA, MEYER (all with RSI > 80)—trim positions/consider stop orders.
Hidden insights: ETF breakouts are driving some of today’s biggest percentage moves, often with little fundamental "news"—classic sign of speculative digestion and asset rotation. Defensive income stocks (REDSTAREX) quietly gaining momentum. Large declines in turnover and upcoming sector divergence set the stage for a potential regime shift—stay vigilant for next week’s direction.
|
Top ASI Gainers Over Last 5 Trading Days
|
Top ASI Losers Over Last 5 Trading Days
|
For more detailed analysis, on InfoWARE Market Data Terminal <NSEPERF> <GO>
On InfoWARE Finance Mobile App (Android, iPhone & iPad, Windows Phone and Windows 8/10), "Top Gainers & Losers"
VETIVA S & P NIGERIA SOVEREIGN BOND ETF (VSPBONDETF) topped the advancers list closing at N518.00 with a gain of 67.10% followed by CHAMPION BREW. PLC. (CHAMPION) which closed at N13.20 with a gain of 10.00%.
On the flip side ELLAH LAKES PLC. (ELLAHLAKES) and P Z CUSSONS NIGERIA PLC. (PZ) topped the decliners log with a loss of -10.00% at a close of N8.10, and -10.00% to close the day at N32.40 respectively.
| Symbol | LClose | %Chg |
|---|---|---|
| VSPBONDETF | 518.00 | 67.10 |
| CHAMPION | 13.20 | 10.00 |
| JOHNHOLT | 7.70 | 10.00 |
| REDSTAREX | 8.37 | 9.99 |
| ACADEMY | 6.17 | 9.98 |
| Symbol | LClose | %Chg |
|---|---|---|
| ELLAHLAKES | 8.10 | -10.00 |
| PZ | 32.40 | -10.00 |
| JAPAULGOLD | 2.70 | -9.70 |
| ROYALEX | 1.24 | -9.49 |
| MCNICHOLS | 2.78 | -8.85 |
For more detailed analysis,
- On InfoWARE Market Data Terminal <TOPG> <GO>
- On InfoWARE Finance Mobile App ( Android, iPhone & iPad and Windows 10) , "Top Gainers & Losers"
Currency Market
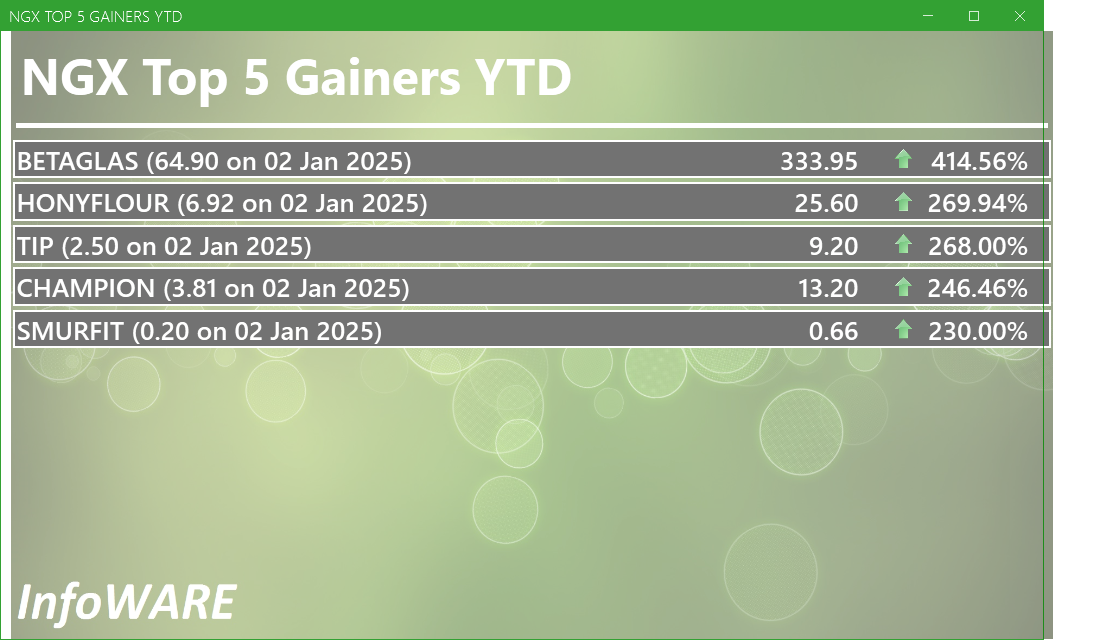
In the currency market, the Naira appreciated 0.33%(5.08) against the Dollar to settle at 1 to 1Investment Insights - Top 5 Gainers YTD
These stocks are the best performers whose price has risen faster than the market as a whole with the best returns year to date. Momentum investors believe that stocks that have outperformed the market will often continue to do so because the factors that caused them to outperform will not suddenly disappear. In addition, other investors seeking to benefit from the stock’s outperformance will often purchase the stock, further bidding its price higher and pushing the stock higher still
For more detailed analysis,
- On InfoWARE Market Data Terminal <T5YTD2> <GO>
- On InfoWARE Finance Mobile App ( Android , iPhone & iPad and Windows 10) , "Research"
NSE: Bull Signal - Price crossed above 15 Day MA
This signal implies these stocks are under buying pressure and the price might continue to rise and therefore positions should be monitored closely. Further suggested analysis include looking at the overall market (ASI) to see if the uptrend is market wide, sector wide or specific to the stock. Portfolio managers tend to use this as a signal to do more research to add to their positions or lock in some profits. Typically further analysis should be done using commands like PC and RV on the InfoWARE Market Data Terminal. Another command is ALERTS to set price triggers for possible exit or entry as necessary
For more detailed analysis,
- On InfoWARE Market Data Terminal <NSEPERF> <GO>
- On InfoWARE Finance Mobile App ( Android , iPhone & iPad and Windows 10) , "Top Gainers & Losers"
| Symbol | Price | %Chg | 15DMA | PE | EPS | DivY | MktCap | Vol | Trades | Value | LstTradeTime |
|---|---|---|---|---|---|---|---|---|---|---|---|
| VSPBONDETF | 518.00 | 40.15 | 332.63 | 0.00 | 0.00 | 2.00 | 1.00 | 1.04K | 04-Jul-2025 14:32:13.283 | ||
| REDSTAREX | 8.37 | 9.08 | 7.71 | 5.93 | 0.74 | 6.12 | 7.99B | 370.79K | 38.00 | 3.10M | 04-Jul-2025 14:30:44.397 |
| ARADEL | 530.00 | 2.83 | 522.10 | 0.00 | 0.00 | 1.72 | 2,302.77B | 737.82K | 361.00 | 390.30M | 04-Jul-2025 14:30:35.240 |
| ETI | 31.00 | 1.61 | 30.76 | 5.00 | 5.10 | 2.00 | 568.84B | 1.71M | 57.00 | 52.78M | 04-Jul-2025 14:32:11.567 |
| NGXOILGAS | 2,463.47 | 0.80 | 2,459.69 | 8.74 | 228.15 | 0.00 | 0.00 | 660.72K | 330.00 | 91.46M | 04-Jul-2025 14:31:08.353 |
| SUNUASSUR | 5.00 | 0.20 | 4.99 | 0.00 | 0.00 | 0.99 | 29.05B | 1.13M | 49.00 | 5.66M | 04-Jul-2025 14:30:45.827 |
NSE: BEAR Signal - Price crossed below 15 Day MA
This signal implies these stocks are under selling pressure and the price might continue to slide and therefore positions should be monitored closely. Further suggested analysis include looking at the overall market (ASI) to see if the downtrend is market wide, sector wide or specific to the stock. If the overal market trend is upwards, then since these stocks are heading in the opposite direction, then further analysis should be done using commands like PC and RV on the InfoWARE Market Data Terminal. Another command is ALERTS to set price triggers for possible exit is necessar
For more detailed analysis,
- On InfoWARE Market Data Terminal <BEARM> <GO>
- On InfoWARE Finance Mobile App ( Android , iPhone & iPad and Windows 10)
| Symbol | Price | %Chg | 15DMA | PE | EPS | DivY | MktCap | Vol | Trades | Value | LstTradeTime |
|---|---|---|---|---|---|---|---|---|---|---|---|
| NGXINDUSTR | 3,576.17 | -0.94 | 3,595.20 | 39.90 | 18.97 | 0.00 | 0.00 | 18.01M | 1,884.00 | 428.40M | 04-Jul-2025 14:31:07.590 |
| BUACEMENT | 92.50 | -0.97 | 93.41 | 0.00 | 0.00 | 2.11 | 3,132.45B | 592.40K | 257.00 | 54.01M | 04-Jul-2025 14:30:35.943 |
| AIICO | 1.60 | -1.88 | 1.61 | 2.01 | 0.60 | 4.13 | 58.57B | 15.96M | 309.00 | 25.64M | 04-Jul-2025 14:30:35.017 |
| LINKASSURE | 1.50 | -3.33 | 1.52 | 59.89 | 0.02 | 5.56 | 21.00B | 6.78M | 54.00 | 10.49M | 04-Jul-2025 14:30:40.693 |
| PZ | 32.40 | -11.11 | 35.75 | 44.17 | 0.50 | 4.59 | 128.64B | 19.44M | 644.00 | 635.73M | 04-Jul-2025 14:30:44.230 |
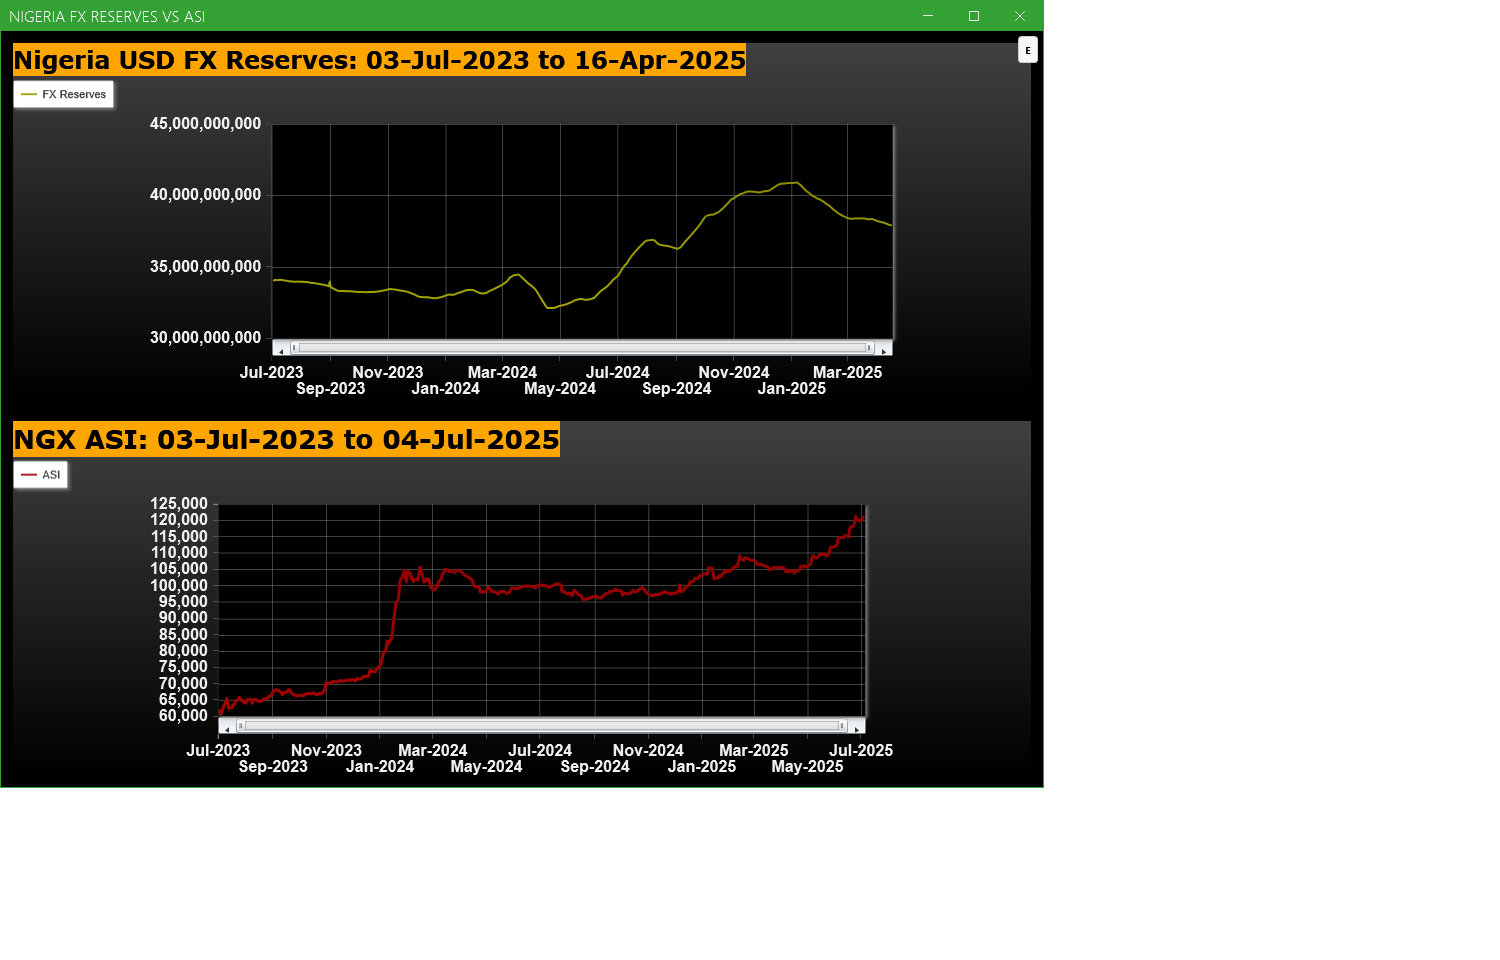
Economic Indicators - Nigeria FX Reserves Vs ASI Chart
Nigeria FX Reserves are assets held on reserve by CBN in foreign currencies. These reserves are used to back liabilities and influence monetary policy. Given the nature of the Nigeria economy, FX Reserves can appear to have an outsize influence on the economy and hence on the capital market. The chart below allows comparison of FX Reserves against the ASI to make investment decisions
For more detailed analysis,
- On InfoWARE Market Data Terminal <CI> <GO>
- On InfoWARE Finance Mobile App ( Android , iPhone & iPad and Windows 10) , "Research"
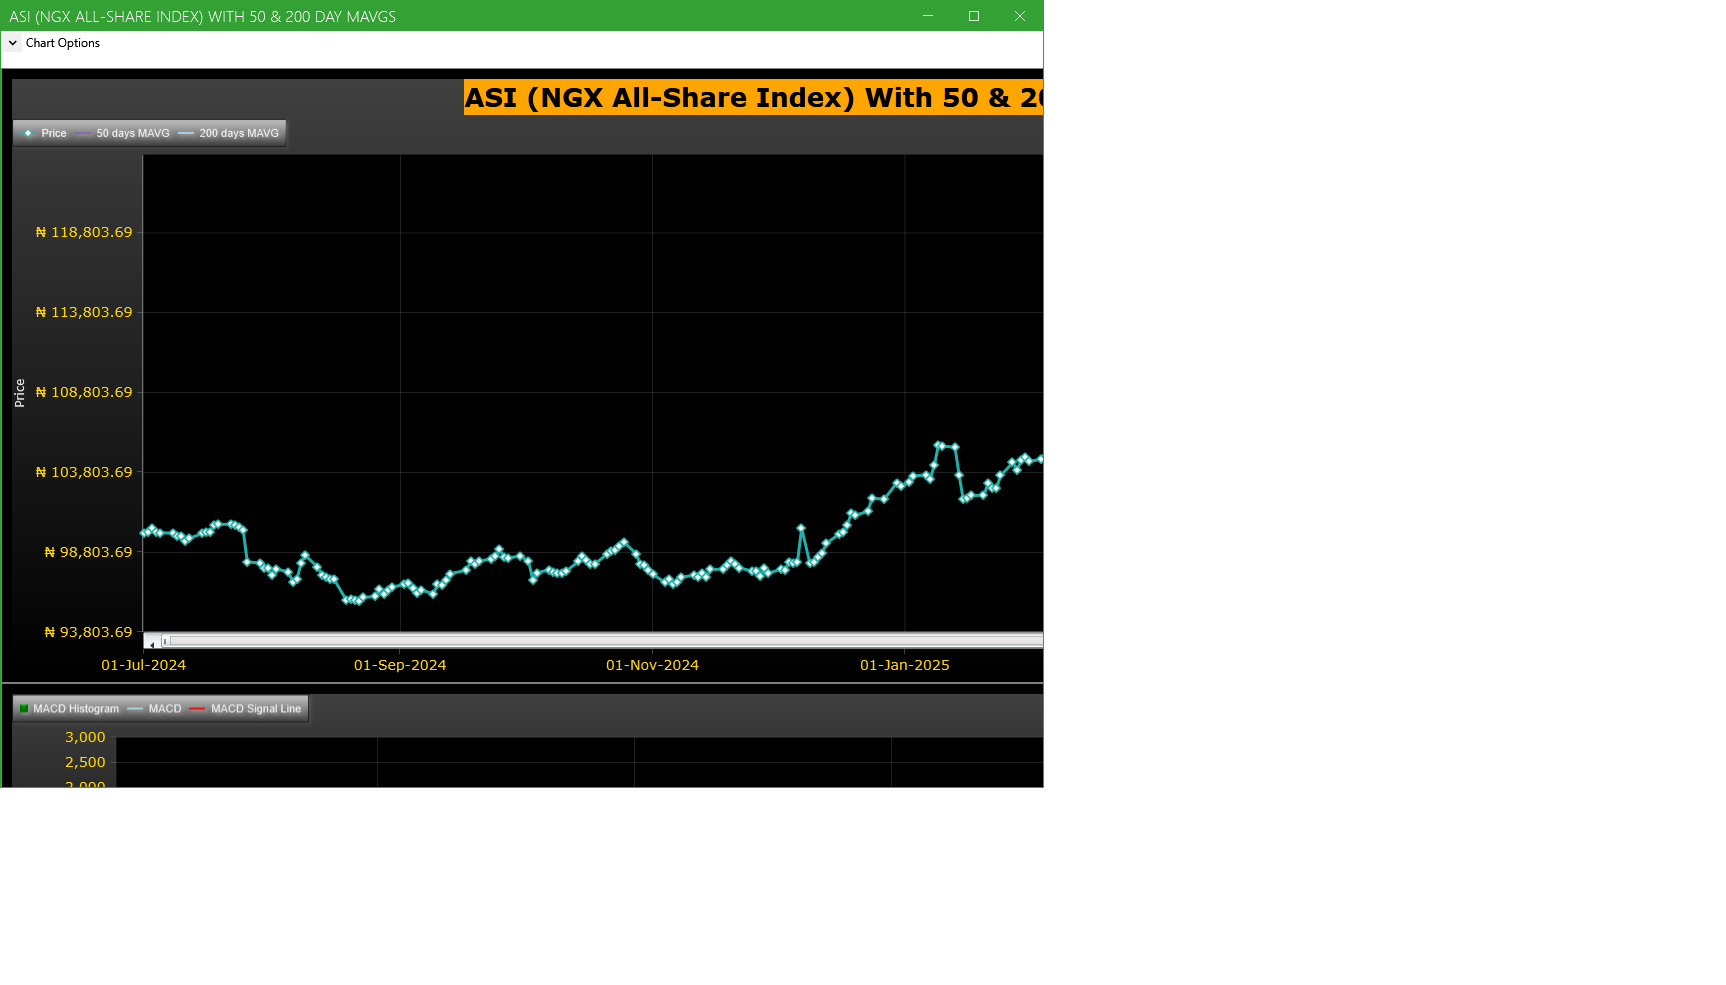
Market Trend - ASI (NGX All-Share-Index) With 50 & 200 Day MAvgs Chart
Technical traders typically use the 50 & 200 day moving averages to aid in choosing
where to enter or exit a position, which then causes these levels to act as strong
support or resistance. As a general guideline, if the price is above a moving average,
the trend is up. If the price is below a moving average, the trend is down.
It is important to note that critics of technical analysis say that moving averages act
as support and resistance because so many traders use these indicators to inform their
trading decisions. Also moving averages tend to work quite well in strong trending conditions
but poorly in choppy or ranging conditions.
Trading Strategies: Crossovers
Crossovers are one of the main moving average strategies. The first type is a price crossover,
which is when the price crosses above or below a moving average to signal a potential change
in trend. Another strategy is to apply two moving averages to a chart: one longer and one
shorter. When the shorter-term MA crosses above the longer-term MA, it is a buy signal, as
it indicates that the trend is shifting up. This is known as a golden cross. Meanwhile, when
the shorter-term MA crosses below the longer-term MA, it is a sell signal, as it indicates that
the trend is shifting down. This is known as a dead/death cross
For more detailed analysis,
- On InfoWARE Market Data Terminal <CI> <GO>
- On InfoWARE Finance Mobile App ( Android , iPhone & iPad and Windows 10) , "Research"
Unusual Volume: Volume traded is more than double the 90 day moving average (All exchanges; ASI & ASem). For more detailed analysis,
- On InfoWARE Market Data Terminal <UV> <GO>
- On InfoWARE Finance Mobile App ( Android , iPhone & iPad and Windows 10)
| Symbol | Name | Volume | 90DAvgVol | %VolChg | Price | LClose | %Chg | Trades | Value |
|---|---|---|---|---|---|---|---|---|---|
| JAPAULGOLD | JAPAUL GOLD & VENTURES PLC | 147.08M | 18.61M | 690.40 | 2.70 | 2.99 | -9.70 | 1,075 | 421.62M |
| WAPIC | WAPIC INSURANCE PLC | 44.53M | 4.59M | 870.28 | 2.50 | 2.31 | 8.23 | 147 | 94.59M |
| CONHALLPLC | CONSOLIDATED HALLMARK INSURANCE PLC | 42.81M | 2.45M | 1,649.83 | 3.00 | 3.00 | 0.00 | 309 | 122.42M |
| CHAMS | CHAMS PLC | 42.01M | 11.01M | 281.67 | 2.47 | 2.50 | -1.20 | 554 | 107.89M |
| FTNCOCOA | FTN COCOA PROCESSORS PLC | 33.38M | 7.59M | 340.07 | 4.67 | 4.86 | -3.91 | 694 | 153.75M |
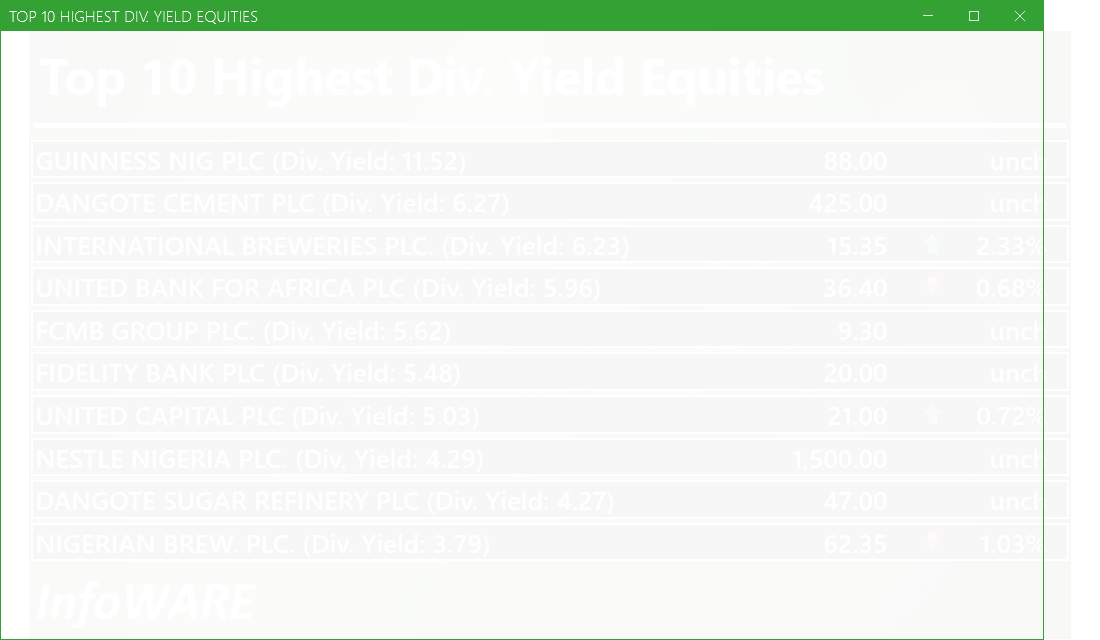
Investment Insights - High Div. Stocks
Dividend stocks distribute a portion of the company earnings to investors on a regular basis and they can a great choice for investors looking for regular income. As an investment or trading strategy, high dividend yield equities provide annual cash payments as against mostly capital gains in the price of a stock. The list in the table below represent the highest dividend paying stocks from the list of the most liquid stocks in the NSE top 30.
For more detailed analysis,
- On InfoWARE Market Data Terminal <HYIELD> <GO>
- On InfoWARE Finance Mobile App ( Android , iPhone & iPad and Windows 10) , "Research"
Investment Insights - Stocks outperforming the ASI but with approximately the same risk
These list of stocks represent equities that are less risky than the ASI but doing better than the ASI (All Shares Index) using the YTD (Year to Date) returns as the measure. The risk is measured by Beta. Beta is an assessment of a stock's tendency to undergo price changes, (its volatility), as well as its potential returns compared to the ASI. It is expressed as a ratio, where a score of 1 represents performance comparable to the ASI, and returns above or below the market may receive scores greater or lower than 1.
For a full list of both positively and negatively corelated stocks visit InfoWARE Market Data Terminal
- On InfoWARE Market Data Terminal <BANL> <GO>
- On InfoWARE Finance Mobile App ( Android , iPhone & iPad and Windows 10)
| Symbol | DivYield | PE | EPS | Beta | %ChgYTD | ASIYTDReturn | BetaDiff |
|---|---|---|---|---|---|---|---|
| HONYFLOUR | 1.40 | 16.28 | 0.31 | 0.99 | 269.94 | 17.26 | 0.01 |
| CAVERTON | 5.52 | 1.15 | 1.57 | 0.98 | 170.59 | 17.26 | 0.02 |
| FIDELITYBK | 5.48 | 13.24 | 1.17 | 0.89 | 17.65 | 17.26 | 0.11 |
| FTNCOCOA | 1.60 | 0.00 | 0.00 | 0.79 | 148.40 | 17.26 | 0.21 |
| NB | 3.79 | 16.95 | 1.60 | 0.79 | 94.84 | 17.26 | 0.21 |
| MAYBAKER | 3.75 | 58.94 | 0.14 | 0.78 | 79.79 | 17.26 | 0.22 |
| UNILEVER | 2.81 | 67.09 | 0.40 | 0.75 | 57.92 | 17.26 | 0.25 |
| VETGOODS | 0.00 | 0.71 | 57.62 | 17.26 | 0.29 | ||
| CUTIX | 6.52 | 8.81 | 0.26 | 0.70 | 58.10 | 17.26 | 0.30 |
| Ikejahotel | 0.94 | 51.55 | 0.16 | 0.70 | 45.34 | 17.26 | 0.30 |
African Markets
| Name | LClose | Change | %Chg |
|---|---|---|---|
| BRVM Stock Exchange | 308.28 | 2.14 | 0.70 |
| Botswana Stock Exchange | 10,404.95 | 0.00 | 0.00 |
| Egyptian Exchange | 32,820.49 | 114.47 | 0.35 |
| Ghana Stock Exchange | 6,347.47 | 101.19 | 1.62 |
| Johannesburg Stock Exchange | 96,937.03 | 328.47 | 0.34 |
| Lusaka Stock Exchange | 20,148.95 | 4.03 | 0.02 |
| Casablanca Stock Exchange | 18,590.45 | 72.22 | 0.39 |
| Malawi Stock Exchange | 333,064.71 | 963.09 | 0.29 |
| Nigeria Stock Exchange | 120,977.20 | 637.80 | 0.53 |
| Nairobi Securities Exchange | 160.13 | 2.27 | 1.44 |
| Namibian Stock Exchange | 1,803.85 | 5.57 | 0.31 |
| Tunis Stock Exchange | 11,586.30 | 11.57 | 0.10 |
| Uganda Securities Exchange | 1,304.15 | 5.07 | 0.39 |
Nigeria Market Indexes
| Symbol | LClose | %Chg | WTD% | MTD% | QTD% | YTD% | MktCap | Trades |
|---|---|---|---|---|---|---|---|---|
| ASI | 120,990.27 | 0.01 | 0.84 | 1.04 | 1.04 | 17.26 | 23,872 | |
| NGX30 | 4,447.74 | -0.02 | 0.56 | -5.84 | -5.84 | 16.59 | 9,115 | |
| NGXAFRBVI | 3,007.83 | -0.21 | 1.69 | -15.12 | -15.12 | 21.24 | 3,944 | |
| NGXAFRHDYI | 20,179.72 | 0.08 | 3.54 | -3.51 | -3.51 | 18.51 | 4,440 | |
| NGXASEM | 1,597.18 | 0.00 | 0.13 | 0.13 | 0.13 | 0.85 | 15 | |
| NGXBNK | 1,296.02 | -0.13 | 1.22 | -14.22 | -14.22 | 19.18 | 4,084 | |
| NGXCG | 3,487.87 | -0.21 | 1.48 | 1.43 | 1.43 | 23.28 | 10,041 | |
| NGXCNSMRGDS | 2,721.95 | 0.24 | 3.27 | -21.53 | -21.53 | 56.94 | 3,269 | |
| NGXCOMMDTY | 1,052.74 | 0.51 | 0.53 | 0.52 | 0.52 | 5.27 | ||
| NGXGROWTH | 9,879.07 | -0.53 | 4.87 | 3.89 | 3.89 | 27.26 | 398 | |
| NGXINDUSTR | 3,576.17 | -0.93 | -1.70 | 1.51 | 1.51 | 0.13 | 1,884 | |
| NGXINS | 794.28 | 1.33 | 5.13 | 7.54 | 7.54 | 1.03 | 1,574 | |
| NGXLOTUSISLM | 9,339.12 | 0.37 | 1.19 | -2.46 | -2.46 | 34.03 | 2,401 | |
| NGXMAINBOARD | 5,975.64 | 0.10 | 1.47 | 1.30 | 1.30 | 19.42 | 19,477 | |
| NGXMERIGRW | 8,365.07 | 0.51 | 2.65 | -13.33 | -13.33 | 28.23 | 3,105 | |
| NGXMERIVAL | 11,462.27 | -0.36 | 2.80 | -4.06 | -4.06 | 9.89 | 4,678 | |
| NGXOILGAS | 2,463.47 | 0.80 | 1.07 | 2.98 | 2.98 | -9.14 | 330 | |
| NGXPENBRD | 2,191.84 | 0.01 | 0.55 | -4.67 | -4.67 | 19.67 | 16,495 | |
| NGXPENSION | 5,862.49 | 0.05 | 1.10 | -7.74 | -7.74 | 29.30 | 11,190 | |
| NGXPREMIUM | 11,529.95 | -0.17 | -0.41 | 0.52 | 0.52 | 18.46 | 3,997 | |
| NGXSOVBND | 654.79 | 0.00 | 0.27 | 0.20 | 0.20 | 8.85 | 0 |
For more detailed analysis,
- On InfoWARE Market Data Terminal <MKTINS> <GO>
- On InfoWARE Finance Mobile App ( Android, iPhone & iPad and Windows 10) , "Market Indexes"
Find the topic interesting? Will like to comment? Contact Us at solutions@infowarelimited.com
Top News

InfoWARE AI Analyst Weekly Market Report: 04-Jul-2025
Chart Of The Day - ASI Chart Vs ASI Advance Decline Line (YTD) (04-Jul-2025 15:08:20.398)
InfoWARE AI Analyst Daily Market Report: 04-Jul-2025

[XNSA]>> NORRENBERGER MUTUAL FUNDS WEEKLY UPDATE
[THOMASWY]>>Corporate Disclosures-<THOMAS WYATT NIG. PLC.>
[JAIZBANK]>>Corporate Disclosures-<JAIZ BANK PLC>
[ELLAHLAKES]>>Corporate Disclosures-<ELLAH LAKES PLC.>
[VSPBONDETF]>> DAILY INDICATIVE PRICES
[XNSA]>> CORDROS MILESTONE FUNDS' BID & OFFER PRICES
[XNSA]>> NGX FIXED INCOME INDICATIVE PRICE LIST FOR JUL 04, 2025
[XNSA]>> CIS TRAINING ON "RETIREMENT PLANNING AND WEALTH CREATION & MANAGEMENT
[XNSA]>> CLOSING GONG CEREMONY
[XNSA]>> DELISTING OF THE SHARES OF NOTORE CHEMICAL INDUSTRIES PLC
[XNSA]>> DAILY INDICATIVE PRICES
[SIAMLETF40]>> DAILY INDICATIVE PRICES
[XNSA]>> NOTIFICATION OF PRICE ADJUSTMENT
Chart Of The Day - ASI Chart Vs ASI Advance Decline Line (YTD) (03-Jul-2025 15:10:28.129)
InfoWARE AI Analyst Daily Market Report: 03-Jul-2025
[XNSA]>> TRADING ACCOUNT POSITIONS
[XNSA]>> CORDROS MILESTONE FUNDS' BID & OFFER PRICES
[XNSA]>> EMERGING AFRICA DAILY FUND PRICES
[XNSA]>> RESIGNATION OF A DIRECTOR (FSDH CAPITAL LIMITED)
[VSPBONDETF]>> DAILY INDICATIVE PRICES
[XNSA]>> NGX FIXED INCOME INDICATIVE PRICE LIST FOR JUL 03, 2025
[XNSA]>> CIS TRAINING ON "RETIREMENT PLANNING AND WEALTH CREATION & MANAGEMENT
[XNSA]>> CLOSING GONG CEREMONY
[XNSA]>> APPOINTMENT OF A DIRECTOR (ANCHORIA SECURITIES LIMITED)
[CILEASING]>>Corporate Disclosures-<C AND I LEASING PLC.>
Chart Of The Day - ASI Chart Vs ASI Advance Decline Line (YTD) (02-Jul-2025 15:07:10.584)
InfoWARE AI Analyst Daily Market Report: 02-Jul-2025
Get IDIA - the stock trading app for the modern investor
Solutions by Business
Product Suites
Company
Contacts
- 8th Floor,
- South Atlantic Petroleum Towers,
- 1 Adeola Odeku Street,
- Victoria Island,
- Lagos, Nigeria.
- Email: solutions@infowarelimited.com
Follow Us
 |
 |
 |
 |