


InfoWARE AI Analyst Daily Market Report: 18-Jul-2025 | InfoWARE Finance
Get IDIA - the stock trading app for the modern investor


InfoWARE AI Analyst Daily Market Report: 18-Jul-2025
(Source: InfoWARE Terminal, Date: 18-Jul-2025)
Dear Investor,
NGX Daily Market Summary & Analysis
Friday, July 18, 2025
Market Overview
The NGX ASI notched a +1.00% gain today, closing at 130,283.87 and boosting its YTD performance to a robust 27.53%. Despite a slight -1.55% dip in turnover (₦37.22B), trading activity remained elevated on the back of 2.13B shares exchanged—a doubling versus the previous day, flagging renewed risk appetite. The market breadth was distinctly bullish (advancers/decliners ratio: 2.16x), with 54 gainers versus 25 laggards, echoing the prevailing positive sentiment. Standouts included NEWGOLD ETF (+12.40%) as the day's best performer, while UPDC PLC closed as the top loser (-10%).
Significant Trends in Market Breadth
- Breadth Indicator: Strikingly bullish with a 2.16x advancers-to-decliners ratio.
- Volume Patterns: High volume in 67 companies, but 74 saw reduced activity, hinting at investor concentration around select names.
- Turnover Drop: Slight turnover contraction despite surging volume suggests lower average trade sizes—retail activity picking up, or price corrections at play.
Top Gainers & Losers Highlights
-
Gainers:
- NEWGOLD ETF +12.40% (₦58,000): Benefited from a momentum flip, closing above both the 15D and 50D MAs, with RSI resetting lower from yesterday, suggesting the surge might attract more attention, not exhaustion.
- LEARNAFRCA +10.00%: Maintains steady RSI ~59, solid price action with low PE signaling room for rerating.
- GREENWETF +10.00%, bullish ETF.
-
Losers:
- REDSTAREX -9.97%: Red hot RSI at 95.6 points to heavy overbought territory; a reversal risk is rising here, likely profit-taking or markdown after unsustainable surge.
- UNIONDICON -9.62%: Similarly hazardous RSI (97.1).
- STERLINGNG and FIRSTHOLDCO notable for high RSIs despite price drops, suggesting "blow-off top" territory or distribution phases.
Deeper Insights & Forward-Looking Observations
- Turnover Dip: Slight decrease in turnover (-1.55%) despite big volume uptrend flags more retail trades, lower average deal size, and possibly some strategy reshuffling or profit-taking by institutions.
-
Bullish Momentum (Technical highlights):
- NEWGOLD ETF, GUINEAINS, AFRIPRUD crossed above their 15DMA—portfolio managers may want to research if these uptrends are sustainable.
- AFRIPRUD combines technical strength (15DMA cross, up +3.03%) with a healthy 1.27% dividend yield and a defensive 0.64 beta—a rare trifecta for both income and momentum seekers!
-
Bearish Momentum:
- RTBRISCOE closed below its 15DMA, signaling continued selling pressure. This is also present among some YTD laggards, which have failed rebounds.
- VFDGROUP and FGS202768 display technical weakness—caution warranted.
-
Unusual Volume Alerts:
- FCMB: Staggering 7,475% of 90-Day Avg Volume. This degree of trading typically signals major news, rumors, or a pivotal institutional trade. Price faded -2.04%; monitoring for follow-through or mean reversion is advisable.
- CHAMS and AIICO also far exceeded norms—these could be stealth accumulation or exit signals.
- FIRSTHOLDCO also had 134% of 90-day average—note that it appears in both volume and trading activity tables.
-
YTD Top Gainers:
- NASCON up 180% YTD with RSI 95+, an extraordinary momentum-run; historically, RSIs this high have often preceded short-term corrections.
- Both BUACEMENT and DANGCEM among key YTD movers, portending continued strength in industrials/materials.
- FIRSTHOLDCO shows up among both today's losers and YTD gainers—possibly signaling sector rotation or profit taking after a strong run.
-
YTD Top Losers:
- ACADEMY: Despite a sharp -24.32% in the last 5 days, it’s still up 122.2% YTD—volatile but with spectacular year-long returns.
- DEAPCAP, CONHALLPLC and R T BRISCOE remain deep in the red year to date, and technicals suggest no imminent reversal.
Contrarian Signals
- FIRSTHOLDCO: Despite being a top gainer YTD (+20%+) and unusual volume leader, it was a top loser today (-4.10%) with a very high RSI. This mix of indicators may point to short-term exhaustion, but historically strong stocks with this profile tend to attract "dip-buyers”—a critical juncture to track next week.
- STERLINGNG: Price declined with RSI above 70, suggesting buyer fatigue; beware chasing late.
- NEWGOLD ETF: Up strongly with RSI dropping from 53.98 to 44.56—price rally but RSI cooling can either precede further breakouts or signal missed moves; close monitoring required.
- AFRIPRUD: High dividend, low beta, AND bullish technical—when all align, this is typically a sweet spot for tactical allocation.
- REDSTAREX & UNIONDICON: RSIs at unprecedented heights (>95), even as they drop. Extreme caution!
Sector Heatmaps
| Sector | Trend | Momentum (15D/50D MA) | Institutional % | Retail % | Leader(s) |
| Banking | Bullish/Active | Sparkline: ↑ | ZENITHBANK (20.2% of Inst. trades) | FIRSTHOLDCO, ACCESS, UBA highly traded | GTCO, UBA, ZENITHBANK |
| Industrials | Strong | Sparkline: ↑ | Heavy | Modest | BUACEMENT, DANGCEM |
| ETFs | Breakout | Sparkline: ↑ | NEWGOLD, GREENWETF, MERGROWTH | NEWGOLD | NEWGOLD ETF |
| Insurance | Mixed/Active | Sparkline: ↑ (several) | Low | GUINEAINS, AIICO | GUINEAINS |
| Diversified/Autos | Weak/Correction | Sparkline: ↓ | Low | RTBRISCOE, VFDGROUP | RTBRISCOE |
Dividend-Yield vs Beta Matrix (Defensive Opportunities)
| Stock | Dividend Yield | Beta | Momentum Status | Insight |
| AFRIPRUD | 1.27% | 0.64 | Bullish (15DMA cross) | Ideal for low-risk, income & tactical allocation |
| PRESCO | 0.44% | 0.31 | Bullish (15DMA cross) | Low beta, moderate yield, sector move |
| SOVRENINS | 3.75% | 1.12 | Bullish (15DMA cross) | Aggressive yield, but higher beta |
- Hidden gem: AFRIPRUD ticks the rare "high-yield, low-beta, bullish” box; could draw defensive inflows.
- Presco and SOVRENINS show value for those willing to stomach slightly more risk.
Institutional Clustering Alerts
- ZENITHBANK continues to dominate institutional flows, claiming 20.2% of value. Such positioning often pre-empts earnings action or regulatory/structural moves in the sector.
- FIRSTHOLDCO, ACCESSCORP, GTCO, and UBA are also on the institutional radar, each drawing heavy volumes and trade counts.
Stocks with High Dividend Yield also in Momentum Tables
- AFRIPRUD once again stands out—combining strong upward price momentum with a defensive income profile. For retail or institutional investors seeking growth-plus-income, this is a rare convergence.
- SOVRENINS and GUINEAINS also join the bullish screen today alongside attractive yields.
Trader & Investor Suggestions
- Opportunity: Consider tactical exposure to AFRIPRUD and NEWGOLD ETF for momentum plus diversification. ETFs are in breakout mode.
- Caution: Be wary of stocks like REDSTAREX and UNIONDICON with sky-high RSIs (>95)—sharp reversals are statistically likely.
- Monitor FCMB and CHAMS for news or disclosure, as volumes are highly unusual.
- Contrarian Play: FIRSTHOLDCO—if decline on heavy volume is temporary, dip buyers may be rewarded, but risk remains high given strong prior run and current technicals.
- Sector Rotation Alert: Industrials, ETFs, and select Financials (especially low beta, high dividend) are themes to favor as we move deeper into Q3.
Market Activity & Trades Analysis
-
Retail vs Institutional:
- Institutional: Only 40% of trade count, but a dominant 87.35% of volume and 92.84% of traded value. This means that institutions are behind most of the big-ticket, high-volume transactions.
- Retail: Drove 60% of trades but only 12.65% of volume; lots of small transactions—a classic late-cycle market profile or optimism from smaller investors.
-
Top 5 Institutional Names:
- ZENITHBANK, ACCESSCORP, UBA, FIRSTHOLDCO, GTCO
- Overlaps: These are also among the most heavily traded by retail, indicating shared focus and sector leadership as financials and banking stocks are driving most liquidity.
-
Trade Patterns:
- FirstHoldCo: Consistently attracts both retail and institutional order flow, but short-term movement is negative—watching for reversal or further breakdown.
- Sector Note: Most traded names are from Banking—often a sign of sector rotation, index-tracking, or pre-earnings positioning.
- Hidden Insight: When retail participation surges as market nears highs, it often precedes increased volatility or rotational moves.
Top 5 YTD Gainers & Losers (as of Today)
| Top 5 YTD Gainers | Top 5 YTD Losers | |||||||||||
| Stock | Price | Chg 1D | Chg 5D | Chg YTD | RSI | Stock | Price | Chg 1D | Chg 5D | Chg YTD | RSI | |
| EUNISELL | 16.30 | +9.82% | +32.59% | -7.11% | 99.88 | ACADEMY | 7.50 | -6.67% | -24.32% | 122.22% | 62.79 | |
| BUACEMENT | 112.20 | +9.98% | +24.65% | 32.69% | 80.59 | CONHALLPLC | 3.05 | -1.64% | -20.00% | -20.84% | 47.16 | |
| NESTLE | 1650.00 | +9.09% | +20.00% | 105.71% | 85.81 | DEAPCAP | 1.31 | +1.53% | -16.35% | 10.83% | 57.08 | |
| IMG | 38.9 | +9.13% | +19.92% | 11.86% | 67.54 | RTBRISCOE | 3.42 | -0.58% | -14.14% | 23.64% | 55.51 | |
| ABCTRANS | 5.69 | -0.70% | +16.98% | 359.35% | 91.68 | MCNICHOLS | 3.51 | +8.83% | -11.57% | 137.27% | 60.54 | |
Actionable Key Takeaways
- Short-term traders: Consider momentum plays on ETFs (NEWGOLD, GREENWETF), but maintain stop-losses as RSIs and volume spikes suggest higher volatility ahead.
- Dividend seekers: AFRIPRUD and SOVRENINS fit "yield plus upside” profiles.
- Swing/contrarian traders: Watch FIRSTHOLDCO’s retracement; key support may attract buyers early next week.
- Conservative investors: Lean defensive, favoring stocks with high dividend, low beta, and stable technicals—e.g., AFRIPRUD and PRESCO.
- Warning: Overheated names with RSIs already >90 (REDSTAREX, ABCTRANS, NASCON) may be vulnerable to profit-taking corrections.
- News Watch: Unusual volumes in FCMB, CHAMS, AIICO—track disclosures and news for fresh catalysts.
Currency Market Note: The Naira strengthened fractionally +0.07% against the USD, closing at 1,530, signaling some stability on the FX front.
|
Top ASI Gainers Over Last 5 Trading Days
|
Top ASI Losers Over Last 5 Trading Days
|
For more detailed analysis, on InfoWARE Market Data Terminal <NSEPERF> <GO>
On InfoWARE Finance Mobile App (Android, iPhone & iPad, Windows Phone and Windows 8/10), "Top Gainers & Losers"
NEWGOLD EXCHANGE TRADED FUND (ETF) (NEWGOLD) topped the advancers list closing at N58,000.00 with a gain of 12.40% followed by UPDC PLC (UPDC) which closed at N4.84 with a gain of 10.00%.
On the flip side RED STAR EXPRESS PLC (REDSTAREX) and UNION DICON SALT PLC. (UNIONDICON) topped the decliners log with a loss of -9.97% at a close of N12.92, and -9.62% to close the day at N10.80 respectively.
| Symbol | LClose | %Chg |
|---|---|---|
| NEWGOLD | 58,000.00 | 12.40 |
| UPDC | 4.84 | 10.00 |
| GREENWETF | 220.00 | 10.00 |
| LEARNAFRCA | 6.27 | 10.00 |
| NCR | 6.60 | 10.00 |
| Symbol | LClose | %Chg |
|---|---|---|
| REDSTAREX | 12.92 | -9.97 |
| UNIONDICON | 10.80 | -9.62 |
| ACADEMY | 7.00 | -6.67 |
| STERLINGNG | 6.17 | -4.34 |
| FIRSTHOLDCO | 33.95 | -4.10 |
For more detailed analysis,
- On InfoWARE Market Data Terminal <TOPG> <GO>
- On InfoWARE Finance Mobile App ( Android, iPhone & iPad and Windows 10) , "Top Gainers & Losers"
Currency Market
In the currency market, the Naira appreciated 0.07%(1.06) against the Dollar to settle at 1 to 1Investment Insights - Top 5 Gainers YTD
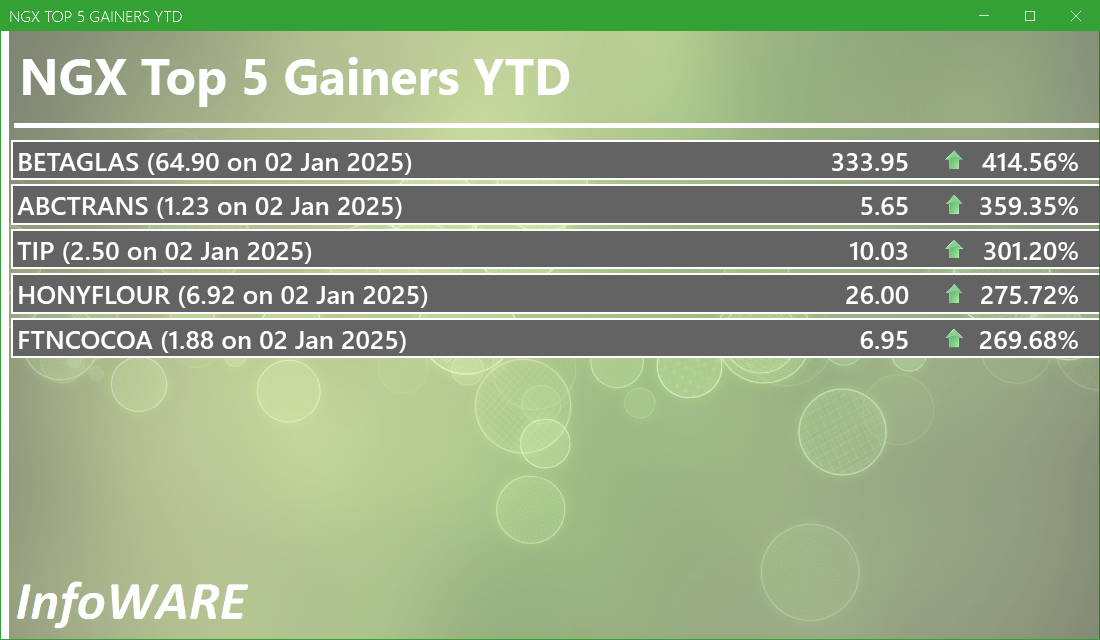
These stocks are the best performers whose price has risen faster than the market as a whole with the best returns year to date. Momentum investors believe that stocks that have outperformed the market will often continue to do so because the factors that caused them to outperform will not suddenly disappear. In addition, other investors seeking to benefit from the stock’s outperformance will often purchase the stock, further bidding its price higher and pushing the stock higher still
For more detailed analysis,
- On InfoWARE Market Data Terminal <T5YTD2> <GO>
- On InfoWARE Finance Mobile App ( Android , iPhone & iPad and Windows 10) , "Research"
NSE: Bull Signal - Price crossed above 15 Day MA
This signal implies these stocks are under buying pressure and the price might continue to rise and therefore positions should be monitored closely. Further suggested analysis include looking at the overall market (ASI) to see if the uptrend is market wide, sector wide or specific to the stock. Portfolio managers tend to use this as a signal to do more research to add to their positions or lock in some profits. Typically further analysis should be done using commands like PC and RV on the InfoWARE Market Data Terminal. Another command is ALERTS to set price triggers for possible exit or entry as necessary
For more detailed analysis,
- On InfoWARE Market Data Terminal <NSEPERF> <GO>
- On InfoWARE Finance Mobile App ( Android , iPhone & iPad and Windows 10) , "Top Gainers & Losers"
| Symbol | Price | %Chg | 15DMA | PE | EPS | DivY | MktCap | Vol | Trades | Value | LstTradeTime |
|---|---|---|---|---|---|---|---|---|---|---|---|
| NEWGOLD | 58,000.00 | 11.03 | 54,820.93 | 0.00 | 0.00 | 0.00 | 0.00 | 1.00 | 1.00 | 58.00K | 18-Jul-2025 14:31:22.753 |
| GUINEAINS | 1.02 | 7.84 | 0.99 | 66.79 | 0.01 | 1.96 | 6.26B | 7.96M | 90.00 | 8.06M | 18-Jul-2025 14:30:26.683 |
| ROYALEX | 1.26 | 6.35 | 1.24 | 0.00 | 0.00 | 7.81 | 6.48B | 5.48M | 87.00 | 6.95M | 18-Jul-2025 14:31:22.017 |
| SOVRENINS | 1.35 | 5.19 | 1.34 | 27.95 | 0.03 | 3.75 | 15.34B | 1.57M | 35.00 | 2.04M | 18-Jul-2025 14:30:30.980 |
| MERGROWTH | 420.00 | 4.76 | 401.73 | 0.00 | 0.00 | 11.89K | 20.00 | 4.99M | 18-Jul-2025 14:31:22.730 | ||
| AFRIPRUD | 16.50 | 3.03 | 16.23 | 19.57 | 0.61 | 1.27 | 33.00B | 8.33M | 250.00 | 129.12M | 18-Jul-2025 14:30:24.340 |
| PRESCO | 1,265.00 | 2.53 | 1,251.93 | 169.69 | 2.65 | 0.44 | 1,265.00B | 1.93M | 274.00 | 2.45B | 18-Jul-2025 14:30:30.067 |
NSE: BEAR Signal - Price crossed below 15 Day MA
This signal implies these stocks are under selling pressure and the price might continue to slide and therefore positions should be monitored closely. Further suggested analysis include looking at the overall market (ASI) to see if the downtrend is market wide, sector wide or specific to the stock. If the overal market trend is upwards, then since these stocks are heading in the opposite direction, then further analysis should be done using commands like PC and RV on the InfoWARE Market Data Terminal. Another command is ALERTS to set price triggers for possible exit is necessar
For more detailed analysis,
- On InfoWARE Market Data Terminal <BEARM> <GO>
- On InfoWARE Finance Mobile App ( Android , iPhone & iPad and Windows 10)
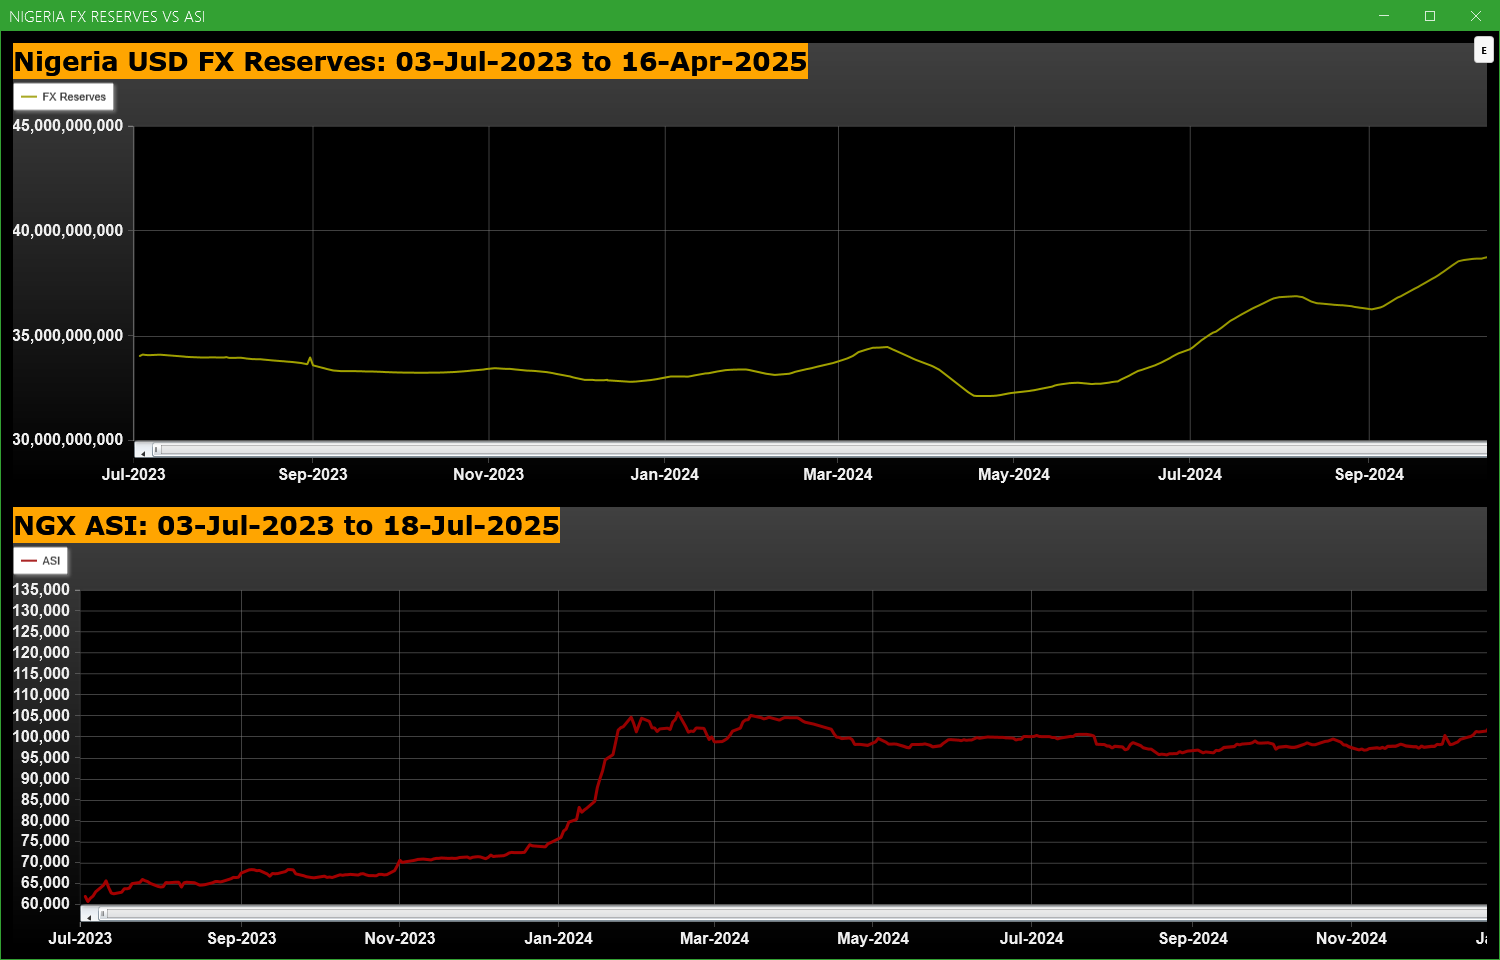
Economic Indicators - Nigeria FX Reserves Vs ASI Chart
Nigeria FX Reserves are assets held on reserve by CBN in foreign currencies. These reserves are used to back liabilities and influence monetary policy. Given the nature of the Nigeria economy, FX Reserves can appear to have an outsize influence on the economy and hence on the capital market. The chart below allows comparison of FX Reserves against the ASI to make investment decisions
For more detailed analysis,
- On InfoWARE Market Data Terminal <CI> <GO>
- On InfoWARE Finance Mobile App ( Android , iPhone & iPad and Windows 10) , "Research"
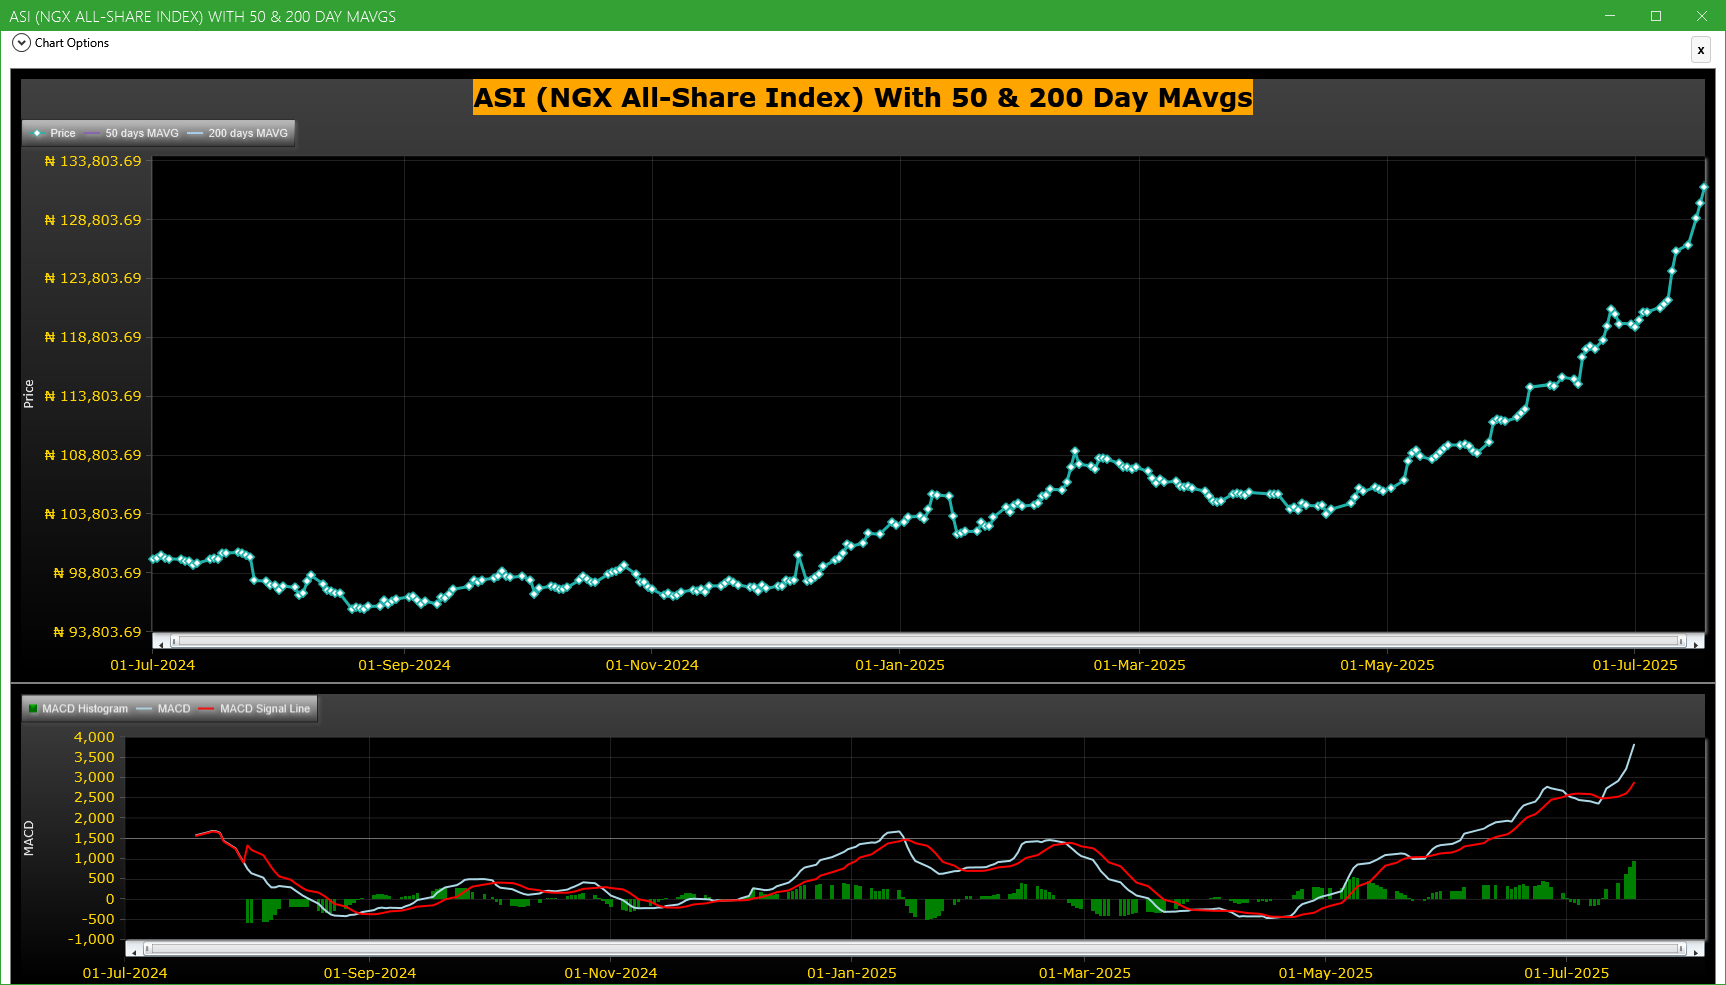
Market Trend - ASI (NGX All-Share-Index) With 50 & 200 Day MAvgs Chart
Technical traders typically use the 50 & 200 day moving averages to aid in choosing
where to enter or exit a position, which then causes these levels to act as strong
support or resistance. As a general guideline, if the price is above a moving average,
the trend is up. If the price is below a moving average, the trend is down.
It is important to note that critics of technical analysis say that moving averages act
as support and resistance because so many traders use these indicators to inform their
trading decisions. Also moving averages tend to work quite well in strong trending conditions
but poorly in choppy or ranging conditions.
Trading Strategies: Crossovers
Crossovers are one of the main moving average strategies. The first type is a price crossover,
which is when the price crosses above or below a moving average to signal a potential change
in trend. Another strategy is to apply two moving averages to a chart: one longer and one
shorter. When the shorter-term MA crosses above the longer-term MA, it is a buy signal, as
it indicates that the trend is shifting up. This is known as a golden cross. Meanwhile, when
the shorter-term MA crosses below the longer-term MA, it is a sell signal, as it indicates that
the trend is shifting down. This is known as a dead/death cross
For more detailed analysis,
- On InfoWARE Market Data Terminal <CI> <GO>
- On InfoWARE Finance Mobile App ( Android , iPhone & iPad and Windows 10) , "Research"
Unusual Volume: Volume traded is more than double the 90 day moving average (All exchanges; ASI & ASem). For more detailed analysis,
- On InfoWARE Market Data Terminal <UV> <GO>
- On InfoWARE Finance Mobile App ( Android , iPhone & iPad and Windows 10)
| Symbol | Name | Volume | 90DAvgVol | %VolChg | Price | LClose | %Chg | Trades | Value |
|---|---|---|---|---|---|---|---|---|---|
| FCMB | FCMB GROUP PLC. | 1.31B | 17.29M | 7,475.04 | 9.60 | 9.80 | -2.04 | 462 | 12.63B |
| CHAMS | CHAMS PLC | 92.62M | 14.02M | 560.58 | 3.09 | 3.09 | 0.00 | 395 | 293.87M |
| AIICO | AIICO INSURANCE PLC. | 49.32M | 18.39M | 168.13 | 2.27 | 2.20 | 3.18 | 511 | 107.29M |
| FIRSTHOLDCO | FIRST HOLDCO PLC | 32.70M | 13.95M | 134.35 | 33.95 | 35.40 | -4.10 | 1,205 | 1.13B |
| FTNCOCOA | FTN COCOA PROCESSORS PLC | 25.21M | 10.63M | 137.16 | 6.95 | 6.32 | 9.97 | 496 | 164.59M |
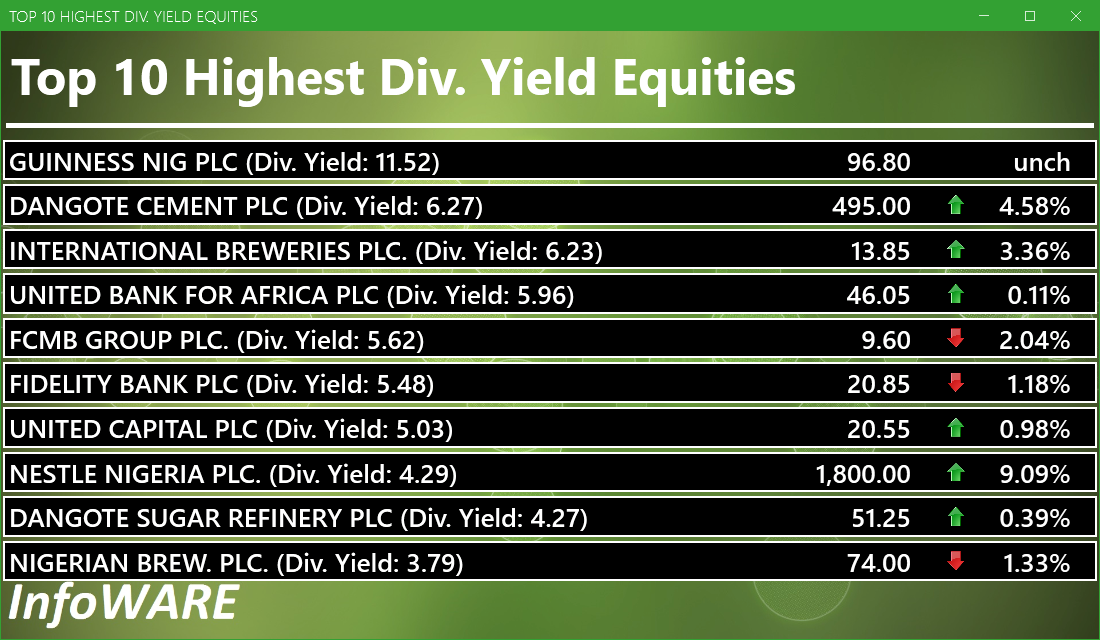
Investment Insights - High Div. Stocks
Dividend stocks distribute a portion of the company earnings to investors on a regular basis and they can a great choice for investors looking for regular income. As an investment or trading strategy, high dividend yield equities provide annual cash payments as against mostly capital gains in the price of a stock. The list in the table below represent the highest dividend paying stocks from the list of the most liquid stocks in the NSE top 30.
For more detailed analysis,
- On InfoWARE Market Data Terminal <HYIELD> <GO>
- On InfoWARE Finance Mobile App ( Android , iPhone & iPad and Windows 10) , "Research"
Investment Insights - Stocks outperforming the ASI but with approximately the same risk
These list of stocks represent equities that are less risky than the ASI but doing better than the ASI (All Shares Index) using the YTD (Year to Date) returns as the measure. The risk is measured by Beta. Beta is an assessment of a stock's tendency to undergo price changes, (its volatility), as well as its potential returns compared to the ASI. It is expressed as a ratio, where a score of 1 represents performance comparable to the ASI, and returns above or below the market may receive scores greater or lower than 1.
For a full list of both positively and negatively corelated stocks visit InfoWARE Market Data Terminal
- On InfoWARE Market Data Terminal <BANL> <GO>
- On InfoWARE Finance Mobile App ( Android , iPhone & iPad and Windows 10)
| Symbol | DivYield | PE | EPS | Beta | %ChgYTD | ASIYTDReturn | BetaDiff |
|---|---|---|---|---|---|---|---|
| HONYFLOUR | 1.40 | 16.28 | 0.31 | 0.99 | 275.72 | 27.53 | 0.01 |
| CAVERTON | 5.52 | 1.15 | 1.57 | 0.98 | 153.33 | 27.53 | 0.02 |
| FTNCOCOA | 1.60 | 0.00 | 0.00 | 0.79 | 269.68 | 27.53 | 0.21 |
| NB | 3.79 | 16.95 | 1.60 | 0.79 | 131.25 | 27.53 | 0.21 |
| MAYBAKER | 3.75 | 58.94 | 0.14 | 0.78 | 78.72 | 27.53 | 0.22 |
| UNILEVER | 2.81 | 67.09 | 0.40 | 0.75 | 66.67 | 27.53 | 0.25 |
| VETGOODS | 0.00 | 0.71 | 73.26 | 27.53 | 0.29 | ||
| DAARCOMM | 0.00 | 0.00 | 0.00 | 0.71 | 32.35 | 27.53 | 0.29 |
| CUTIX | 6.52 | 8.81 | 0.26 | 0.70 | 46.25 | 27.53 | 0.30 |
| Ikejahotel | 0.94 | 51.55 | 0.16 | 0.70 | 61.94 | 27.53 | 0.30 |
African Markets
| Name | LClose | Change | %Chg |
|---|---|---|---|
| BRVM Stock Exchange | 306.35 | -3.91 | -1.26 |
| Botswana Stock Exchange | 10,428.27 | 0.00 | 0.00 |
| Egyptian Exchange | 33,821.03 | 348.12 | 1.04 |
| Ghana Stock Exchange | 6,437.46 | -10.96 | -0.17 |
| Johannesburg Stock Exchange | 97,353.38 | 291.19 | 0.30 |
| Lusaka Stock Exchange | 20,661.74 | 454.66 | 2.25 |
| Casablanca Stock Exchange | 18,922.52 | 105.38 | 0.56 |
| Malawi Stock Exchange | 367,459.69 | 3,313.73 | 0.91 |
| Nigeria Stock Exchange | 130,283.86 | 1,315.48 | 1.02 |
| Nairobi Securities Exchange | 157.79 | 0.19 | 0.12 |
| Namibian Stock Exchange | 1,774.52 | 5.13 | 0.29 |
| Rwanda Stock Exchange | 150.43 | 0.00 | 0.00 |
| Tunis Stock Exchange | 11,787.74 | -5.90 | -0.05 |
| Uganda Securities Exchange | 1,331.86 | 2.13 | 0.16 |
Nigeria Market Indexes
| Symbol | LClose | %Chg | WTD% | MTD% | QTD% | YTD% | MktCap | Trades |
|---|---|---|---|---|---|---|---|---|
| ASI | 131,585.64 | 1.00 | 3.86 | 9.89 | 9.89 | 27.53 | 25,547 | |
| NGX30 | 4,834.38 | 0.98 | 4.00 | 2.34 | 2.34 | 26.73 | 13,805 | |
| NGXAFRBVI | 3,623.64 | -0.87 | 2.44 | 2.26 | 2.26 | 46.07 | 6,787 | |
| NGXAFRHDYI | 22,118.62 | -0.26 | 0.06 | 5.76 | 5.76 | 29.90 | 6,526 | |
| NGXASEM | 1,446.38 | 0.00 | -9.56 | -9.32 | -9.32 | -8.67 | 17 | |
| NGXBNK | 1,536.06 | -1.08 | 3.41 | 1.67 | 1.67 | 41.26 | 6,846 | |
| NGXCG | 4,032.32 | -0.40 | 3.58 | 17.26 | 17.26 | 42.52 | 13,223 | |
| NGXCNSMRGDS | 2,818.54 | 1.22 | 3.12 | -18.74 | -18.74 | 62.51 | 3,039 | |
| NGXCOMMDTY | 1,063.24 | 0.25 | 0.27 | 1.53 | 1.53 | 6.32 | ||
| NGXGROWTH | 9,538.24 | 0.36 | -5.59 | 0.30 | 0.30 | 22.87 | 271 | |
| NGXINDUSTR | 4,386.79 | 5.60 | 16.52 | 24.52 | 24.52 | 22.82 | 2,437 | |
| NGXINS | 871.13 | 0.59 | -3.24 | 17.94 | 17.94 | 10.80 | 1,532 | |
| NGXLOTUSISLM | 10,391.52 | 1.30 | 5.26 | 8.53 | 8.53 | 49.14 | 3,772 | |
| NGXMAINBOARD | 6,293.53 | 1.27 | 2.78 | 6.69 | 6.69 | 25.77 | 18,373 | |
| NGXMERIGRW | 9,222.18 | 0.54 | 2.77 | -4.45 | -4.45 | 41.37 | 3,332 | |
| NGXMERIVAL | 13,427.46 | -1.33 | 2.07 | 12.38 | 12.38 | 28.73 | 7,837 | |
| NGXOILGAS | 2,427.28 | 0.00 | -0.79 | 1.47 | 1.47 | -10.47 | 323 | |
| NGXPENBRD | 2,412.71 | 0.96 | 4.23 | 4.93 | 4.93 | 31.72 | 19,969 | |
| NGXPENSION | 6,516.98 | -0.23 | 2.44 | 2.55 | 2.55 | 43.74 | 15,496 | |
| NGXPREMIUM | 13,337.48 | 0.52 | 5.93 | 16.28 | 16.28 | 37.03 | 6,903 | |
| NGXSOVBND | 665.26 | 0.00 | -0.57 | 1.80 | 1.80 | 10.59 | 0 |
For more detailed analysis,
- On InfoWARE Market Data Terminal <MKTINS> <GO>
- On InfoWARE Finance Mobile App ( Android, iPhone & iPad and Windows 10) , "Market Indexes"
Find the topic interesting? Will like to comment? Contact Us at solutions@infowarelimited.com
Top News

InfoWARE AI Analyst Weekly Market Report: 18-Jul-2025
Chart Of The Day - ASI Chart Vs ASI Advance Decline Line (YTD) (18-Jul-2025 15:07:31.411)
InfoWARE AI Analyst Daily Market Report: 18-Jul-2025

[XNSA]>> CORDROS MILESTONE FUNDS' BID & OFFER PRICES
[AIRTELAFRI]>>Corporate Disclosures-<Airtel Africa Plc>
[XNSA]>> NORRENBERGER MUTUAL FUNDS WEEKLY UPDATE
[XNSA]>> NGX FIXED INCOME INDICATIVE PRICE LIST FOR JUL 18, 2025
[XNSA]>> OFF MARKET TRADE
[SIAMLETF40]>> DAILY INDICATIVE PRICES
Chart Of The Day - ASI Chart Vs ASI Advance Decline Line (YTD) (17-Jul-2025 15:23:08.892)
InfoWARE AI Analyst Daily Market Report: 17-Jul-2025
[XNSA]>> CORDROS MILESTONE FUNDS' BID & OFFER PRICES
[NEWGOLD]>> DAILY INDICATIVE PRICES
[XNSA]>> EMERGING AFRICA DAILY FUND PRICES
[VSPBONDETF]>> DAILY INDICATIVE PRICES
[AIRTELAFRI]>>Corporate Disclosures-<Airtel Africa Plc>
[MERGROWTH]>> DAILY INDICATIVE PRICES
[MECURE]>>Corporate Disclosures-<MECURE INDUSTRIES PLC>
Chart Of The Day - ASI Chart Vs ASI Advance Decline Line (YTD) (16-Jul-2025 15:07:07.613)
InfoWARE AI Analyst Daily Market Report: 16-Jul-2025
[NPFMCRFBK]>>Notice of Meeting -<NPF MICROFINANCE BANK PLC>
[NEM]>>Notice of Meeting -<NEM INSURANCE PLC.>
[XNSA]>> OFF MARKET TRADE
[AIRTELAFRI]>>Corporate Disclosures-<Airtel Africa Plc>
[AIRTELAFRI]>>Corporate Disclosures-<Airtel Africa Plc>
[PRESTIGE]>>Corporate Disclosures-<PRESTIGE ASSURANCE PLC>
[XNSA]>> POSTPONED CLOSING GONG CEREMONY IN HONOUR OF THE MAYOR OF LONDON
[STANBICETF30]>> DAILY INDICATIVE PRICES
[XNSA]>> NOTIFICATION OF PRICE ADJUSTMENT
InfoWARE AI Analyst Daily Market Report: 14-Jul-2025
Get IDIA - the stock trading app for the modern investor
Solutions by Business
Product Suites
Company
Contacts
- 8th Floor,
- South Atlantic Petroleum Towers,
- 1 Adeola Odeku Street,
- Victoria Island,
- Lagos, Nigeria.
- Email: solutions@infowarelimited.com
Follow Us
 |
 |
 |
 |