


InfoWARE AI Analyst Daily Market Report: 23-Jul-2025 | InfoWARE Finance
Get IDIA - the stock trading app for the modern investor


InfoWARE AI Analyst Daily Market Report: 23-Jul-2025
(Source: InfoWARE Terminal, Date: 23-Jul-2025)
Dear Investor,
Nigerian Equity Market Recap – Wednesday, July 23, 2025
The NGX All Share Index eked out a modest +0.08% gain today, closing at 132,451.73 despite a notable slump in trading turnover (-39.64%) compared to the previous session. Market breadth reflects a slightly bearish undercurrent, with 34 advancers versus 40 decliners (0.85x), and market activity contracting as both trading volume and deals declined. Institutional investors maintained a firm grip on traded value (accounting for nearly 87% of daily turnover), yet retail activity dominated trade count. Stocks showed sharp divergences—with ETFs sparkling alongside select insurance and industrial names, while several small caps languished. Notably, the momentum tables and unusual volume signals reveal hidden crosscurrents worth close observation.
Market Breadth & Activity: Key Trends
- Breadth Rogues: Despite the index’s green close, decliners outnumbered advancers (40 vs 34), suggesting that gains were concentrated and the broader market remains cautious.
- Turnover Drop: Value traded plunged from ₦24.77B to ₦14.96B (-39.64%), with volume down to 625.86M units. This drop signals reduced institutional conviction or a wait-and-see approach as investors digest recent moves.
- Volume Swings: 66 stocks recorded volume gains, while a larger portion, 74 stocks, saw volume slide. This uneven participation hints at selective sector or stock rotations.
Daily Top Gainers & Losers
| Stock | % Change | RSI | MACD | Beta | PE |
|---|---|---|---|---|---|
| GREENWETF | +10.00% | 35.9 | -37.4 | 0.83 | N/A |
| ACADEMY | +10.00% | 56.6 | 0.77 | 0.45 | 0.00 |
| LOTUSHAL15 | +10.00% | 75.2 | 3.73 | -0.08 | N/A |
| TIP | +9.98% | 84.9 | 1.07 | 0.00 | N/A |
| Ikejahotel | +9.95% | 59.7 | 1.30 | 0.70 | 51.55 |
| AUSTINLAZ | -10.00% | 98.3 | 0.14 | 0.07 | 0.00 |
| TRIPPLEG | -9.95% | 97.2 | 0.58 | 0.60 | 215.00 |
| OMATEK | -9.72% | 64.0 | 0.23 | 0.52 | 6.82 |
| DAARCOMM | -9.64% | 56.1 | 0.07 | 0.71 | 0.00 |
| GUINEAINS | -9.09% | 55.6 | 0.06 | 1.51 | 66.79 |
- GREENWETF (ETF) and LOTUSHAL15 (Sharia ETF): Both surged 10%, highlighting strong institutional ETF demand, but with GREENWETF’s RSI at 35.9—still not "overbought”.
- TIP (Initiates Plc) advanced 9.98%, now with an extreme RSI of 84.9, inviting potential caution from momentum chasers.
- AUSTINLAZ and TRIPPLEG tanked nearly 10% each–with TRIPPLEG at a severely overbought RSI (97.2), suggesting long positions could be at risk of quick reversals.
YTD Performance: Top 5 Gainers and Losers
| Stock | YTD % | RSI | DivY | PE |
|---|---|---|---|---|
| VSPBONDETF | +69.35% | 50.0 | 0.0 | N/A |
| TIP | +433.60% | 84.9 | 0.0 | N/A |
| NGXGROUP | +174.31% | 85.3 | 2.7 | 0.0 |
| DANGSUGAR | +84.62% | 75.7 | 4.3 | 11.5 |
| NAHCO | +143.75% | 78.2 | 6.7 | 92.98 |
| Stock | YTD % | RSI | DivY | PE |
|---|---|---|---|---|
| OMATEK | +62.5% | 64.0 | 0.0 | 6.8 |
| MEYER | +102.3% | 55.5 | 3.9 | 0.0 |
| THOMASWY | +61.1% | 56.9 | 1.1 | 0.0 |
| DAARCOMM | +10.3% | 56.1 | 0.0 | 0.0 |
| MCNICHOLS | +101.86% | 56.9 | 5.9 | 26.8 |
- Stand-out: TIP (+433.6% YTD, RSI 84.9) — both a daily and YTD chart-topper, but caution: RSI points toward overextension.
- DAARCOMM, OMATEK, MCNICHOLS: Among top daily losers and YTD underperformers—bearish momentum likely entrenched.
Analytical Insights & Forward Look
- Turnover Drop-Off: With turnover plunging nearly 40%, liquidity is being pulled from the market. Historically, such drops can precede sentiment pivots or periods of higher volatility as investors await clearer cues.
- Narrow Gains, Broad Declines: The small positive close—despite more decliners (40) than advancers (34)—confirms that wins are being driven by large-caps and ETFs rather than broad participation, portending fragility.
- Unusual Volume: ELLAHLAKES, ROYALEX, LEGENDINT, REGALINS, LASACO all traded at more than twice their 90-day average volume, often amid price drops—classic distribution/sell-off warning signs.
-
Bullish Momentum:
- TIP shines with RSI 84.9, bullish MACD and well above both 15D and 50D MAs. But RSI is now "overbought”; risk of correction rises.
- ACADEMY: Price crossed above 15DMA; RSI mid-50s and MACD positive but lagging the sharp gain. Watch for follow-through.
- LOTUSHAL15: RSI 75+ and deeply positive MACD—a candidate for momentum-driven continuation but susceptible to sharp profit-taking.
-
Bearish Momentum:
- DAARCOMM, OMATEK: Both daily and YTD underperformers, both showing persistent RSI in the mid-50s. Still room for more downside — especially as both also show below-15DMA price action and negative sentiment.
- TRIPPLEG, AUSTINLAZ: Despite sharply negative daily moves, both have RSI in extreme overbought territory (97+!) — a contrarian signal (see below) that a technical correction or bounce may be brewing.
Contrarian Signals: Conflicting Indicators Worth Noting
- TRIPPLEG & AUSTINLAZ: Sharply negative price, yet RSI at 97+—rarely sustainable for long. These could snap back, especially if short sellers start covering or value-hunters step in.
- GREENWETF: Top percentage gainer, yet low RSI (35.9); indicates today’s move may be the start of a reversal rather than the end of a run.
- LOTUSHAL15: RSI of 75.2—approaching "overbought”—but MACD signal line and strong upward 15D/50D MA crossover underscore accumulating momentum.
- OMATEK: Despite a negative day and being in the YTD losers table, still shows a mid-60s RSI—uncertain momentum; further caution warranted.
Sector Performance & Defensive Plays (Heatmap Excerpts)
| Sector | Trend | Top Mover(s) | Notes |
|---|---|---|---|
| Insurance | Weak | CORNERST, REGALINS, LASACO | Unusual volume, mixed price |
| Banking | Selective | UBA, ACCESSCORP, ZENITHBANK | Institutional focus, calm RSI |
| ETF | Strong | GREENWETF, LOTUSHAL15 | Outsized daily gains |
| Media | Struggling | DAARCOMM | Bearish momentum, YTD laggard |
| Stock | Div Yield | Beta | Comment |
|---|---|---|---|
| DANGSUGAR | 4.27% | 1.35 | Growth plus dividend, higher risk |
| MCNICHOLS | 5.88% | -0.11 | High yield, but negative momentum |
| FIDSON | 4.14% | 0.25 | Defensive yield, but bear trend |
| CUTIX | 6.52% | 0.70 | Stable yield, moderate beta |
| LIVESTOCK | 0.00% | 0.46 | Safe beta, but no yield |
- Defensive Playbook: CUTIX and FIDSON offer reasonable yields at low-to-moderate betas—potential sector rotation targets should market volatility rise.
- Insurance Sector: Watch closely—major names showed unusual volumes and price dips, potential capitulation signals or, conversely, value entry points.
Institutional Clustering Alerts
- Trading value highly clustered in select large banks (ACCESSCORP, GTCO, UBA, ZENITHBANK). Notably, institutional investors dominated both the trade value and volumes, accounting for 86.7% of traded value but just 38.2% of trades.
- ACCESSCORP attracted the largest share of institutional volume and value, indicating a "smart money” preference—watch for possible trends or block trades in coming sessions.
Dividend Yield Intersections with Momentum
- MCNICHOLS: High dividend (5.88%), but flagged in both top YTD losers and bearish momentum list. Caution: yield is no safety net when price action is sharply negative.
- DANGSUGAR: Attractive dividend, strong momentum and a top YTD gainer—watch for profit-taking as its RSI climbs into the 70s.
- CUTIX: Offers both a high yield and recent bullish momentum, with a strong base forming above its 15DMA.
Trading Suggestions
- Traders: Momentum names with extreme RSI readings (TIP, LOTUSHAL15) should be approached with trailing stops—momentum exhaustion can produce sharp reversals.
- Defensive rotation: For lower volatility, consider names with high dividend and low-moderate beta such as CUTIX and FIDSON.
- Bargain hunting caution: Don’t rush into high-yield "falling knives” (MCNICHOLS); combine yield with positive relative strength and improving price action.
- Volatility watch: Expect wider swings as liquidity thins out and if institutional flows shift direction.
- Retail/Institutional Diversion: Retail activity is fragmented, but institutional volumes centered on financials and industrials. Watch for institutional-led breakouts or breakdowns.
Market Activity: Retail vs Institutional Insights
- Institutions controlled 70.7% of volume and 86.7% of value, but only 38.2% of total trades. This hints at large, chunky block trades—especially in top banks and industrials.
- Retail investors executed the majority of trade count (61.8%) but only a third of market volume—suggesting high churn in smaller, possibly speculative names without moving overall value substantially.
-
Top 5 Institutional Volumes:
ACCESSCORP (93.8M units), WAPCO (7.8M), UBA (15.8M), GTCO (11.3M), OANDO (15.2M).- Pattern: All heavyweights; most saw moderate-to-positive daily moves (ACCESSCORP +3.6%, GTCO +0.2%, UBA flat) except WAPCO (-4.3%), where institutional sellers may be exiting strength.
-
Top 5 Retail Volumes:
ACCESSCORP (4.8M), UBA (2.5M), GTCO (0.9M), DANGSUGAR (1.7M), ZENITHBANK (1.3M).- Pattern: Overlaps with the institutional favorites, showing both sets of investors are most active in liquid, large-cap names. Minor banks/industrials are "crowded”—breakouts or reversals may be amplified.
- Correlation Watch: Stocks with high retail and institutional volume often coincide with technical breakouts or impending volatility. Institutions’ relative value stability contrasts with retail’s trade count dominance—watch for shifting participation as a volatility trigger.
|
Top ASI Gainers Over Last 5 Trading Days
|
Top ASI Losers Over Last 5 Trading Days
|
For more detailed analysis, on InfoWARE Market Data Terminal <NSEPERF> <GO>
On InfoWARE Finance Mobile App (Android, iPhone & iPad, Windows Phone and Windows 8/10), "Top Gainers & Losers"
GREENWICH ASSET ETF (GREENWETF) topped the advancers list closing at N242.00 with a gain of 10.00% followed by ACADEMY PRESS PLC. (ACADEMY) which closed at N7.70 with a gain of 10.00%.
On the flip side AUSTIN LAZ & COMPANY PLC (AUSTINLAZ) and TRIPPLE GEE AND COMPANY PLC. (TRIPPLEG) topped the decliners log with a loss of -10.00% at a close of N2.34, and -9.95% to close the day at N3.89 respectively.
| Symbol | LClose | %Chg |
|---|---|---|
| GREENWETF | 242.00 | 10.00 |
| ACADEMY | 7.70 | 10.00 |
| LOTUSHAL15 | 55.00 | 10.00 |
| TIP | 13.34 | 9.98 |
| Ikejahotel | 21.00 | 9.95 |
For more detailed analysis,
- On InfoWARE Market Data Terminal <TOPG> <GO>
- On InfoWARE Finance Mobile App ( Android, iPhone & iPad and Windows 10) , "Top Gainers & Losers"
Currency Market
In the currency market, the Naira fell 0.03%(-0.46) against the Dollar to settle at 1 to 1NSE: Bull Signal - Price crossed above 15 Day MA
This signal implies these stocks are under buying pressure and the price might continue to rise and therefore positions should be monitored closely. Further suggested analysis include looking at the overall market (ASI) to see if the uptrend is market wide, sector wide or specific to the stock. Portfolio managers tend to use this as a signal to do more research to add to their positions or lock in some profits. Typically further analysis should be done using commands like PC and RV on the InfoWARE Market Data Terminal. Another command is ALERTS to set price triggers for possible exit or entry as necessary
For more detailed analysis,
- On InfoWARE Market Data Terminal <NSEPERF> <GO>
- On InfoWARE Finance Mobile App ( Android , iPhone & iPad and Windows 10) , "Top Gainers & Losers"
| Symbol | Price | %Chg | 15DMA | PE | EPS | DivY | MktCap | Vol | Trades | Value | LstTradeTime |
|---|---|---|---|---|---|---|---|---|---|---|---|
| FG192038S2 | 97.00 | 14.43 | 95.27 | 0.00 | 0.00 | 143.00 | 6.00 | 138.21K | 23-Jul-2025 14:30:30.170 | ||
| ACADEMY | 7.70 | 9.09 | 7.42 | 0.00 | 0.00 | 3.51 | 5.82B | 2.13M | 85.00 | 16.40M | 23-Jul-2025 14:31:19.483 |
| NEWGOLD | 55,900.00 | 6.97 | 54,321.00 | 0.00 | 0.00 | 0.00 | 0.00 | 4.00 | 4.00 | 220.30K | 23-Jul-2025 14:31:20.457 |
| CORNERST | 4.50 | 6.89 | 4.27 | 8.62 | 0.35 | 5.28 | 81.75B | 5.15M | 85.00 | 22.69M | 23-Jul-2025 14:30:20.030 |
| CUTIX | 4.05 | 1.23 | 4.04 | 8.81 | 0.26 | 6.52 | 14.27B | 5.09M | 300.00 | 20.66M | 23-Jul-2025 14:30:20.073 |
| TRANSCORP | 49.50 | 1.01 | 49.32 | 0.00 | 0.00 | 0.23 | 2,012.08B | 2.70M | 281.00 | 134.18M | 23-Jul-2025 14:30:23.580 |
NSE: BEAR Signal - Price crossed below 15 Day MA
This signal implies these stocks are under selling pressure and the price might continue to slide and therefore positions should be monitored closely. Further suggested analysis include looking at the overall market (ASI) to see if the downtrend is market wide, sector wide or specific to the stock. If the overal market trend is upwards, then since these stocks are heading in the opposite direction, then further analysis should be done using commands like PC and RV on the InfoWARE Market Data Terminal. Another command is ALERTS to set price triggers for possible exit is necessar
For more detailed analysis,
- On InfoWARE Market Data Terminal <BEARM> <GO>
- On InfoWARE Finance Mobile App ( Android , iPhone & iPad and Windows 10)
| Symbol | Price | %Chg | 15DMA | PE | EPS | DivY | MktCap | Vol | Trades | Value | LstTradeTime |
|---|---|---|---|---|---|---|---|---|---|---|---|
| BERGER | 33.75 | 0.00 | 33.87 | 14.18 | 1.22 | 1.15 | 9.78B | 91.04K | 39.00 | 2.85M | 23-Jul-2025 14:30:15.850 |
| LIVINGTRUST | 7.32 | 0.00 | 7.33 | 35.78 | 0.02 | 1.67 | 36.60B | 12.68K | 4.00 | 83.59K | 23-Jul-2025 14:31:24.623 |
| FTNCOCOA | 6.00 | -1.50 | 6.15 | 0.00 | 0.00 | 1.60 | 23.40B | 15.49M | 487.00 | 91.99M | 23-Jul-2025 14:30:20.910 |
| FCMB | 9.40 | -1.60 | 9.52 | 104.31 | 0.09 | 5.62 | 186.15B | 23.98M | 468.00 | 227.07M | 23-Jul-2025 14:31:19.537 |
| UPL | 6.00 | -2.50 | 6.03 | 7.13 | 0.59 | 0.60 | 2.59B | 1.17M | 42.00 | 6.98M | 23-Jul-2025 14:30:24.003 |
| SOVRENINS | 1.30 | -3.08 | 1.33 | 27.95 | 0.03 | 3.75 | 14.77B | 2.55M | 62.00 | 3.36M | 23-Jul-2025 14:30:23.343 |
| FIDSON | 43.90 | -5.01 | 45.22 | 22.54 | 0.64 | 4.14 | 100.75B | 1.96M | 235.00 | 82.74M | 23-Jul-2025 14:30:20.700 |
| MCNICHOLS | 3.25 | -5.85 | 3.39 | 26.80 | 0.05 | 5.88 | 2.34B | 1.83M | 117.00 | 5.97M | 23-Jul-2025 14:31:24.663 |
| UNIVINSURE | 0.72 | -6.94 | 0.73 | 0.00 | 0.00 | 0.00 | 11.52B | 32.07M | 164.00 | 23.40M | 23-Jul-2025 14:30:23.950 |
| SUNUASSUR | 4.65 | -7.53 | 4.84 | 0.00 | 0.00 | 0.99 | 27.02B | 1.91M | 83.00 | 9.02M | 23-Jul-2025 14:30:23.470 |
| ROYALEX | 1.22 | -8.20 | 1.28 | 0.00 | 0.00 | 7.81 | 6.28B | 43.76M | 86.00 | 53.61M | 23-Jul-2025 14:30:22.887 |
| RTBRISCOE | 3.41 | -9.38 | 3.65 | 0.00 | 0.00 | 4.35 | 4.01B | 2.00M | 74.00 | 6.83M | 23-Jul-2025 14:30:22.910 |
| MULTIVERSE | 9.00 | -10.00 | 9.48 | 0.00 | 0.00 | 0.85 | 3.84B | 322.58K | 43.00 | 3.00M | 23-Jul-2025 14:30:22.330 |
| DAARCOMM | 0.75 | -10.67 | 0.82 | 0.00 | 0.00 | 0.00 | 9.00B | 4.73M | 157.00 | 3.81M | 23-Jul-2025 14:30:20.103 |
| OMATEK | 1.30 | -10.77 | 1.32 | 6.82 | 0.10 | 0.00 | 3.82B | 4.30M | 107.00 | 5.62M | 23-Jul-2025 14:30:22.660 |
| AUSTINLAZ | 2.34 | -11.11 | 2.40 | 0.00 | 0.00 | 0.00 | 2.53B | 289.11K | 25.00 | 677.09K | 23-Jul-2025 14:30:15.723 |
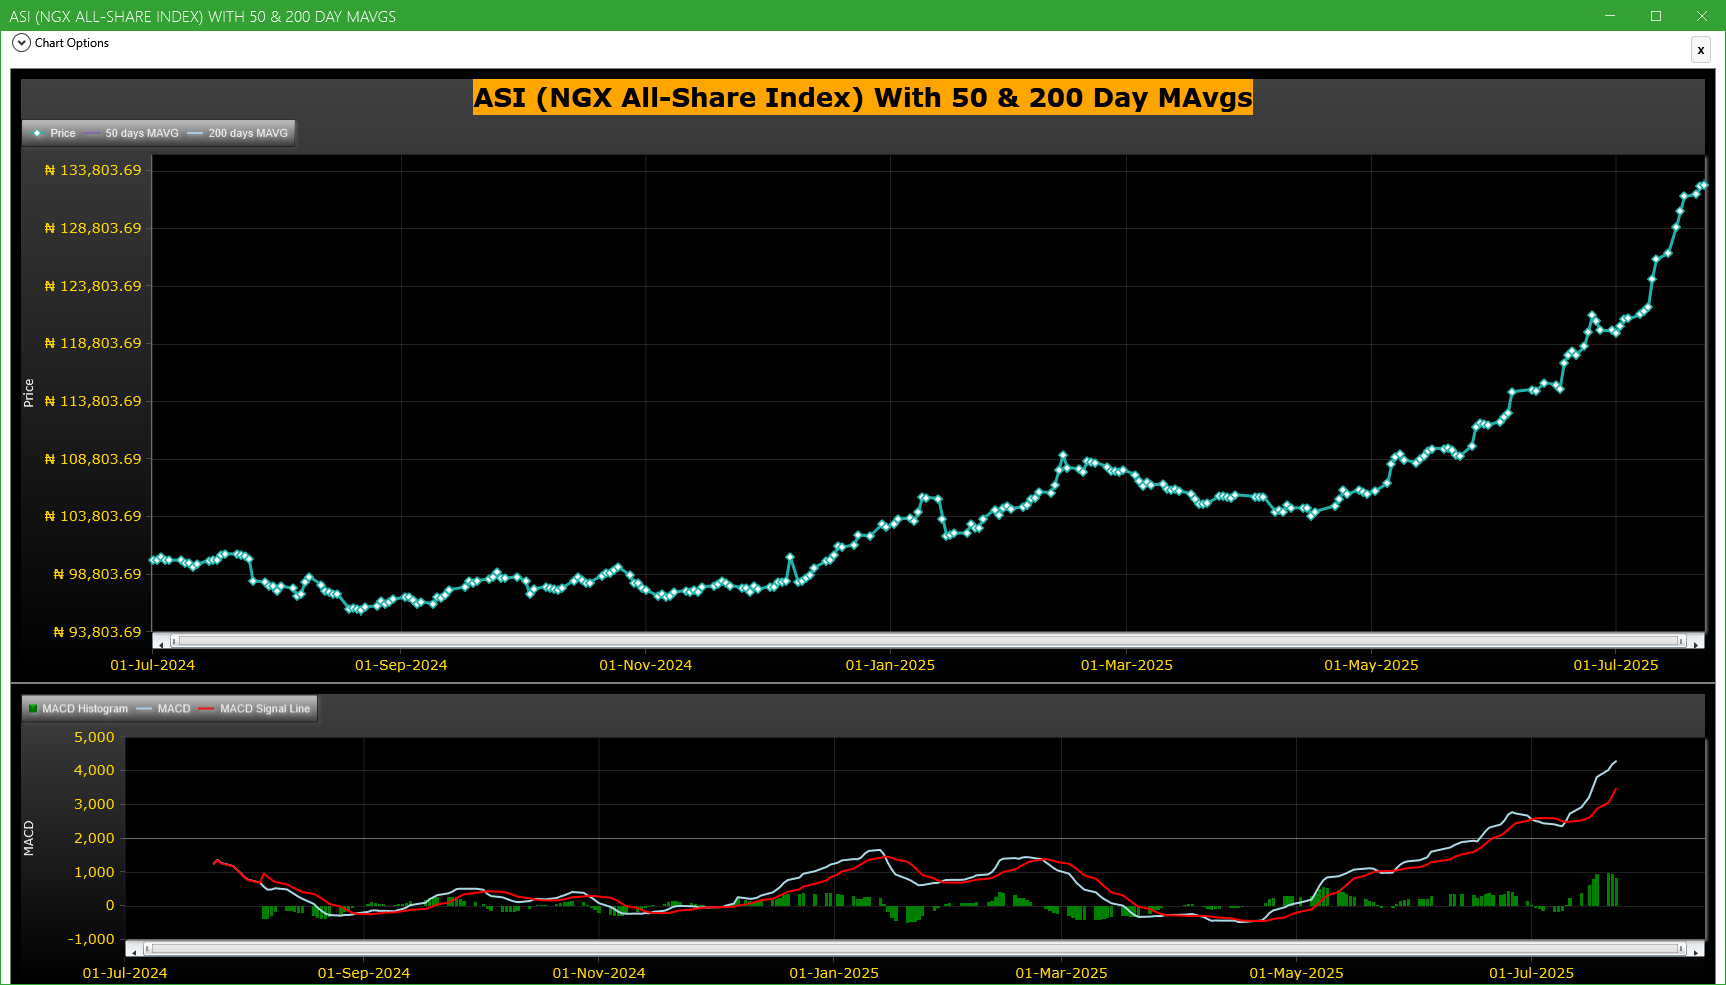
Market Trend - ASI (NGX All-Share-Index) With 50 & 200 Day MAvgs Chart
Technical traders typically use the 50 & 200 day moving averages to aid in choosing
where to enter or exit a position, which then causes these levels to act as strong
support or resistance. As a general guideline, if the price is above a moving average,
the trend is up. If the price is below a moving average, the trend is down.
It is important to note that critics of technical analysis say that moving averages act
as support and resistance because so many traders use these indicators to inform their
trading decisions. Also moving averages tend to work quite well in strong trending conditions
but poorly in choppy or ranging conditions.
Trading Strategies: Crossovers
Crossovers are one of the main moving average strategies. The first type is a price crossover,
which is when the price crosses above or below a moving average to signal a potential change
in trend. Another strategy is to apply two moving averages to a chart: one longer and one
shorter. When the shorter-term MA crosses above the longer-term MA, it is a buy signal, as
it indicates that the trend is shifting up. This is known as a golden cross. Meanwhile, when
the shorter-term MA crosses below the longer-term MA, it is a sell signal, as it indicates that
the trend is shifting down. This is known as a dead/death cross
For more detailed analysis,
- On InfoWARE Market Data Terminal <CI> <GO>
- On InfoWARE Finance Mobile App ( Android , iPhone & iPad and Windows 10) , "Research"
Unusual Volume: Volume traded is more than double the 90 day moving average (All exchanges; ASI & ASem). For more detailed analysis,
- On InfoWARE Market Data Terminal <UV> <GO>
- On InfoWARE Finance Mobile App ( Android , iPhone & iPad and Windows 10)
| Symbol | Name | Volume | 90DAvgVol | %VolChg | Price | LClose | %Chg | Trades | Value |
|---|---|---|---|---|---|---|---|---|---|
| ELLAHLAKES | ELLAH LAKES PLC. | 61.12M | 22.07M | 176.94 | 9.21 | 9.90 | -6.97 | 624 | 581.61M |
| ROYALEX | ROYAL EXCHANGE PLC. | 43.76M | 11.14M | 292.79 | 1.22 | 1.32 | -7.58 | 86 | 53.61M |
| LEGENDINT | LEGEND INTERNET PLC | 23.94M | 5.34M | 347.99 | 5.33 | 5.31 | 0.38 | 377 | 130.35M |
| REGALINS | REGENCY ALLIANCE INSURANCE COMPANY PLC | 13.56M | 4.53M | 199.38 | 0.76 | 0.77 | -1.30 | 64 | 10.37M |
| LASACO | LASACO ASSURANCE PLC. | 9.91M | 3.48M | 184.79 | 3.00 | 3.07 | -2.28 | 69 | 30.36M |
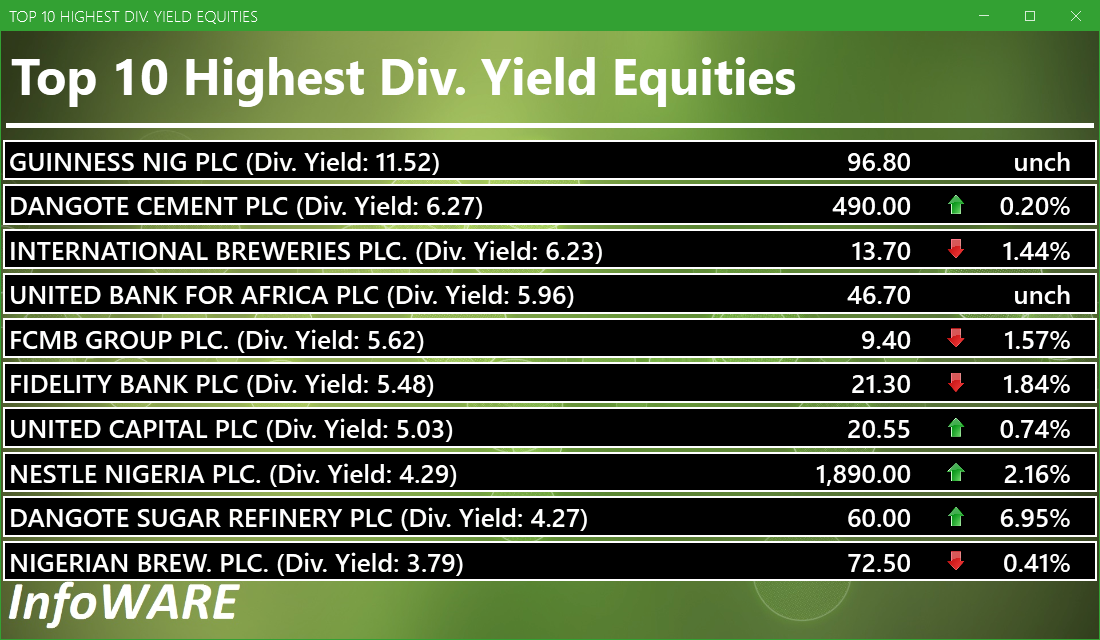
Investment Insights - High Div. Stocks
Dividend stocks distribute a portion of the company earnings to investors on a regular basis and they can a great choice for investors looking for regular income. As an investment or trading strategy, high dividend yield equities provide annual cash payments as against mostly capital gains in the price of a stock. The list in the table below represent the highest dividend paying stocks from the list of the most liquid stocks in the NSE top 30.
For more detailed analysis,
- On InfoWARE Market Data Terminal <HYIELD> <GO>
- On InfoWARE Finance Mobile App ( Android , iPhone & iPad and Windows 10) , "Research"
Investment Insights - Stocks outperforming the ASI but with approximately the same risk
These list of stocks represent equities that are less risky than the ASI but doing better than the ASI (All Shares Index) using the YTD (Year to Date) returns as the measure. The risk is measured by Beta. Beta is an assessment of a stock's tendency to undergo price changes, (its volatility), as well as its potential returns compared to the ASI. It is expressed as a ratio, where a score of 1 represents performance comparable to the ASI, and returns above or below the market may receive scores greater or lower than 1.
For a full list of both positively and negatively corelated stocks visit InfoWARE Market Data Terminal
- On InfoWARE Market Data Terminal <BANL> <GO>
- On InfoWARE Finance Mobile App ( Android , iPhone & iPad and Windows 10)
| Symbol | DivYield | PE | EPS | Beta | %ChgYTD | ASIYTDReturn | BetaDiff |
|---|---|---|---|---|---|---|---|
| HONYFLOUR | 1.40 | 16.28 | 0.31 | 0.99 | 282.95 | 28.47 | 0.01 |
| CAVERTON | 5.52 | 1.15 | 1.57 | 0.98 | 178.43 | 28.47 | 0.02 |
| FTNCOCOA | 1.60 | 0.00 | 0.00 | 0.79 | 219.15 | 28.47 | 0.21 |
| NB | 3.79 | 16.95 | 1.60 | 0.79 | 126.56 | 28.47 | 0.21 |
| MAYBAKER | 3.75 | 58.94 | 0.14 | 0.78 | 81.91 | 28.47 | 0.22 |
| UNILEVER | 2.81 | 67.09 | 0.40 | 0.75 | 72.22 | 28.47 | 0.25 |
| VETGOODS | 0.00 | 0.71 | 90.41 | 28.47 | 0.29 | ||
| CUTIX | 6.52 | 8.81 | 0.26 | 0.70 | 60.08 | 28.47 | 0.30 |
| Ikejahotel | 0.94 | 51.55 | 0.16 | 0.70 | 70.04 | 28.47 | 0.30 |
| ABBEYBDS | 1.43 | 0.00 | 0.00 | 0.70 | 166.67 | 28.47 | 0.30 |
African Markets
| Name | LClose | Change | %Chg |
|---|---|---|---|
| BRVM Stock Exchange | 309.16 | 1.72 | 0.56 |
| Egyptian Exchange | 33,803.34 | -327.66 | -0.96 |
| Ghana Stock Exchange | 6,436.54 | -1.29 | -0.02 |
| Johannesburg Stock Exchange | 99,324.56 | -328.86 | -0.33 |
| Lusaka Stock Exchange | 20,938.68 | 272.79 | 1.32 |
| Casablanca Stock Exchange | 19,192.56 | 17.26 | 0.09 |
| Malawi Stock Exchange | 327,738.16 | 2,504.30 | 0.77 |
| Nigeria Stock Exchange | 132,451.73 | 619.61 | 0.47 |
| Nairobi Securities Exchange | 159.92 | 1.28 | 0.81 |
| Namibian Stock Exchange | 1,809.19 | 0.00 | 0.00 |
| Rwanda Stock Exchange | 150.43 | 0.00 | 0.00 |
| Tunis Stock Exchange | 11,828.08 | 20.07 | 0.17 |
| Uganda Securities Exchange | 1,320.98 | -4.77 | -0.36 |
Nigeria Market Indexes
| Symbol | LClose | %Chg | WTD% | MTD% | QTD% | YTD% | MktCap | Trades |
|---|---|---|---|---|---|---|---|---|
| ASI | 132,557.43 | 0.08 | 0.55 | 10.70 | 10.70 | 28.47 | 24,478 | |
| NGX30 | 4,867.47 | 0.08 | 0.54 | 3.04 | 3.04 | 27.59 | 13,010 | |
| NGXAFRBVI | 3,647.96 | 0.93 | 1.53 | 2.95 | 2.95 | 47.05 | 5,361 | |
| NGXAFRHDYI | 22,595.13 | 0.42 | 1.28 | 8.04 | 8.04 | 32.70 | 6,148 | |
| NGXASEM | 1,446.38 | 0.00 | 0.00 | -9.32 | -9.32 | -8.67 | 10 | |
| NGXBNK | 1,538.88 | 0.44 | 0.56 | 1.86 | 1.86 | 41.52 | 5,927 | |
| NGXCG | 4,053.25 | 0.45 | 0.77 | 17.87 | 17.87 | 43.26 | 12,526 | |
| NGXCNSMRGDS | 2,842.60 | 0.30 | 0.80 | -18.05 | -18.05 | 63.90 | 3,201 | |
| NGXCOMMDTY | 1,061.75 | 0.07 | -0.64 | 1.38 | 1.38 | 6.17 | ||
| NGXGROWTH | 9,598.03 | 1.17 | 0.18 | 0.93 | 0.93 | 23.64 | 367 | |
| NGXINDUSTR | 4,552.07 | -0.62 | 2.24 | 29.21 | 29.21 | 27.45 | 2,677 | |
| NGXINS | 862.70 | 0.13 | 0.39 | 16.80 | 16.80 | 9.73 | 1,533 | |
| NGXLOTUSISLM | 10,534.31 | 0.06 | 1.24 | 10.02 | 10.02 | 51.18 | 4,284 | |
| NGXMAINBOARD | 6,361.65 | 0.10 | 0.50 | 7.84 | 7.84 | 27.13 | 17,958 | |
| NGXMERIGRW | 9,261.08 | -0.23 | -0.03 | -4.05 | -4.05 | 41.97 | 3,205 | |
| NGXMERIVAL | 13,680.74 | 0.90 | 2.53 | 14.50 | 14.50 | 31.16 | 7,581 | |
| NGXOILGAS | 2,404.59 | 0.21 | -0.84 | 0.52 | 0.52 | -11.31 | 371 | |
| NGXPENBRD | 2,432.99 | 0.15 | 0.60 | 5.81 | 5.81 | 32.83 | 19,333 | |
| NGXPENSION | 6,534.22 | 0.24 | 0.26 | 2.83 | 2.83 | 44.12 | 14,496 | |
| NGXPREMIUM | 13,352.67 | 0.04 | 0.66 | 16.41 | 16.41 | 37.19 | 6,153 | |
| NGXSOVBND | 668.16 | 0.44 | 0.44 | 2.24 | 2.24 | 11.07 | 0 |
For more detailed analysis,
- On InfoWARE Market Data Terminal <MKTINS> <GO>
- On InfoWARE Finance Mobile App ( Android, iPhone & iPad and Windows 10) , "Market Indexes"
Find the topic interesting? Will like to comment? Contact Us at solutions@infowarelimited.com
Top News

Chart Of The Day - ASI Chart Vs ASI Advance Decline Line (YTD) (24-Jul-2025 15:07:22.343)
InfoWARE AI Analyst Daily Market Report: 24-Jul-2025

[XNSA]>> DAILY FUND PRICE SUBMISSION - FCMB ASSET MANAGEMENT LIMITED
[XNSA]>> CORDROS MILESTONE FUNDS' BID & OFFER PRICES
[NCR]>>Corporate Disclosures-<NCR (NIGERIA) PLC.>
[AIRTELAFRI]>>Corporate Disclosures-<Airtel Africa Plc>
[MERGROWTH]>> DAILY INDICATIVE PRICES
[XNSA]>> NGX FIXED INCOME INDICATIVE PRICE LIST FOR JUL 24, 2025
[VSPBONDETF]>> DAILY INTICATIVE PRICES
[AIRTELAFRI]>>Corporate Disclosures-<Airtel Africa Plc>
[STANBICETF30]>> DAILY INDICATIVE PRICES
Chart Of The Day - ASI Chart Vs ASI Advance Decline Line (YTD) (23-Jul-2025 15:07:41.590)
InfoWARE AI Analyst Daily Market Report: 23-Jul-2025
[ABBEYBDS]>>Corporate Disclosures-<ABBEY MORTGAGE BANK PLC>
[ACADEMY]>>Corporate Disclosures-<ACADEMY PRESS PLC.>
[XNSA]>> NGX FIXED INCOME INDICATIVE PRICE LIST FOR JUL 23, 2025
[VSPBONDETF]>> DAILY INDICATIVE PRICES
[MERVALUE]>> DAILY INDICATIVE PRICES
[STANBICETF30]>> DAILY INDICATIVE PRICES
[AIRTELAFRI]>>Corporate Disclosures-<Airtel Africa Plc>
[OKOMUOIL]>>Corporate Disclosures-<OKOMU OIL PALM PLC.>
Chart Of The Day - ASI Chart Vs ASI Advance Decline Line (YTD) (22-Jul-2025 15:07:40.102)
InfoWARE AI Analyst Daily Market Report: 22-Jul-2025
[VSPBONDETF]>> DAILY INDICATIVE PRICES
[XNSA]>> CORDROS MILESTONE FUNDS' BID & OFFER PRICES
[MERGROWTH]>> DAILY INDICATIVE PRICES
[XNSA]>> NGX FIXED INCOME INDICATIVE PRICE LIST FOR JUL 22, 2025
[AIRTELAFRI]>>Corporate Disclosures-<Airtel Africa Plc>
[ETERNA]>>Notice of Meeting -<ETERNA PLC.>
[GUINNESS]>>Notice of Meeting -<GUINNESS NIG PLC>
Get IDIA - the stock trading app for the modern investor
Solutions by Business
Product Suites
Company
Contacts
- 8th Floor,
- South Atlantic Petroleum Towers,
- 1 Adeola Odeku Street,
- Victoria Island,
- Lagos, Nigeria.
- Email: solutions@infowarelimited.com
Follow Us
 |
 |
 |
 |