


InfoWARE AI Analyst Daily Market Report: 04-Sep-2025 | InfoWARE Finance
Get IDIA - the stock trading app for the modern investor


InfoWARE AI Analyst Daily Market Report: 04-Sep-2025
(Source: InfoWARE Terminal, Date: 04-Sep-2025)
Dear Investor,
NGX Daily Market Summary – Thursday, September 4, 2025
Key Market Performance & Highlights
The Nigerian All Share Index (ASI) bounced back, closing up by 0.60% at 138,157.16 after the prior session’s dip. YTD performance remains robust at 34.70%, signaling consistent resilience among blue chips and select mid-caps. Market turnover hit 15.37B (+18.99% vs previous day), propelled by an eye-popping 1.80B shares traded — quadrupling yesterday’s volume. Market breadth was strikingly bullish at 2.69x, with 43 advancers far outpacing 16 decliners, reflecting broad-based optimism.
In the currency market, the Naira slipped 0.48% to ₦1,537/$, keeping currency risk on investors’ radar.
Unusual volume surges in SOVRENINS and uptrends in momentum names like HONYFLOUR & CORNERST are drawing both traders’ and institutions’ attention.
Significant Trends in Market Breadth
- Market breadth at 2.69x – strong advancers (43) vs decliners (16); this is one of the broadest bullish sessions in recent weeks.
- Volume up in 58 companies, but declined in 81, signaling selective strong buying pressure on momentum names and financials.
- Turnover jump (+19%) confirms fresh institutional flows, especially into large caps and insurance tickers.
- Insurance sector stood out, dominating both the gainers table (MANSARD, ROYALEX) and unusual volumes (SOVRENINS).
Top Gainers & Losers Today
| Rank | Stock | Close (₦) | Change (%) | RSI | MACD | Sector |
|---|---|---|---|---|---|---|
| 1 | ELLAHLAKES | 12.98 | +10.00 | 49.06 | -0.33 | Agric |
| 2 | VERITASKAP | 1.98 | +10.00 | 50.18 | -0.03 | Insurance |
| 3 | HONYFLOUR | 23.20 | +9.95 | 49.31 | -2.20 | Food Products |
| 4 | ROYALEX | 1.88 | +9.94 | 47.94 | -0.08 | Insurance |
| 5 | MANSARD | 15.82 | +9.94 | 50.37 | -0.38 | Insurance |
| 1 | MERGROWTH | 512.00 | -9.86 | 46.51 | -50.49 | ETF |
| 2 | AUSTINLAZ | 2.87 | -9.75 | 56.23 | 0.00 | Industrial |
| 3 | NEIMETH | 6.05 | -8.33 | 50.59 | -0.56 | Pharma |
| 4 | VSPBONDETF | 265.99 | -4.63 | 51.99 | -33.48 | ETF |
| 5 | DAARCOMM | 0.86 | -4.44 | 48.66 | -0.03 | Media |
- ELLAHLAKES & VERITASKAP: Both surged +10% — attracting swing traders, though RSI remains mid-range, so not technically overbought yet.
- HONYFLOUR: In the limelight for both price momentum (+9.95%) and as a YTD star (+235%), with healthy volume and a bullish 15DMA crossover (see momentum below).
- Insurance sector delivered with ROYALEX, MANSARD also in top gainers; sector-wide risk-on move.
- MERGROWTH ETF: Steep fall (-9.86%), compounding its YTD woes, and signaling persistent pressure on growth equity funds.
Insights & Tactical Predictions
- Turnover spike (+18.99%): Suggests strong institutional re-entry—correlated with block trades in ZENITHBANK, ACCESSCORP, and Insurance names.
- Despite the market’s bull move, 51% of stocks saw volume declines, indicating focus is on selective outliers rather than a pure market-wide rally.
- SOVRENINS: Traded an astronomical 1.42B shares (>100x its typical 90-day volume!); smart money could be repositioning in insurance micro-caps.
- Bullish 15DMA crossovers in HONYFLOUR, CORNERST, TRANSCORP amplify momentum signals—these are likely to see continued buying.
- Bearish 15DMA breakdown in FIDELITYBK, despite institutional attention, warns of latent profit-taking risk in banks.
- RSI check: While several gainers have RSI near or slightly above 50 (neutral), none are flashing overbought/oversold extremes, leaving room for more runs.
- Cross-reference: HONYFLOUR stands out, appearing among daily, 5D, and YTD gainers, and with a recent bullish momentum crossover.
Bullish & Bearish Momentum Patterns (15DMA Crossovers & RSI)
- Bullish Momentum Table Overlap: HONYFLOUR, CORNERST, TRANSCORP, and STANBIC all show price crossing above the 15DMA, reinforced by positive price action and solid volume. These signals suggest room for further rally, particularly for HONYFLOUR, which is also a YTD outlier (+235%).
- Bearish Momentum Table: FIDELITYBK crossed below 15DMA with stagnant price and high institutional activity—a potential short-term profit-taking candidate. Absence of RSI extremes (<30 oversold) signals more of a cooling than a panic sell.
Contrarian Signals
| Stock | RSI | MACD | YTD %Chg | Cross-Indicator Insight |
|---|---|---|---|---|
| CHAMPION | 54.4 | +0.83 | -9.8 | Bullish MACD but negative YTD — possible ‘early reversal’ play |
| VERITASKAP | 50.2 | -0.025 | +94.1 | Uptrend persists, but MACD cooling and RSI mid; caution on sustainability |
| MERGROWTH | 46.5 | -50.5 | -28.0 | ETF: Extremely negative momentum, but RSI stabilizing — ETF flows reversal watch! |
Sector Heatmap
| Sector | Top Performer | Sector Avg %Change | Prevailing Trend |
|---|---|---|---|
| Insurance | MANSARD (+9.94%) | +5.2% | Broad-based buying; high retail & institutional flows |
| Food Products | HONYFLOUR (+9.95%) | +3.9% | Momentum & volume driven |
| Banking | ZENITHBANK (+1.01%) | +1.1% | Mixed: Heavy two-way flows, profit taking in FIDELITYBK |
| ETF | MERGROWTH (-9.86%) | -7.1% | Institutional de-risking |
- Insurance sector leadership is clear: ROYALEX, MANSARD and SOVRENINS (volume spike) all highlight rotational flows into the sector.
- ETF segment saw notable negative outliers.
Dividend-Beta Matrix: Defensive Yield Opportunities
| Stock | Div Yield (%) | Beta | Risk/Reward Insight |
|---|---|---|---|
| FIDELITYBK | 5.48 | 0.89 | Attractive yield; below-market beta, but recent momentum now bearish |
| STANBIC | 3.54 | 0.22 | Very low beta, steady yield – a potential portfolio anchor |
| CORNERST | 5.28 | 0.92 | High yield and insurance uptrend; near-term buy-the-dip |
| AFRIPRUD | 1.27 | 0.64 | Low beta, modest yield – strong defensive if further volatility appears |
- Caution: Watch for conflicts: e.g. FIDELITYBK offers high dividend and low beta but flashed a bearish momentum crossover today.
Institutional Clustering Alerts
-
ZENITHBANK: Stands out with 20.17% of institutional trade value share, coupled with rising price and healthy volume.
Institutional support could keep downside limited even if retail participation decreases. - Insurance sector: SOVRENINS, ROYALEX, and MANSARD also show evidence of increasing institutional footprints.
Top 5 YTD Gainers & Losers (Deep-Dive)
| Top 5 YTD Gainers | ||||||
|---|---|---|---|---|---|---|
| Stock | YTD %Chg | RSI | DivY | PE | Beta | 15DMA vs 50DMA |
| HONYFLOUR | +235.26 | 49.31 | 1.40 | 16.28 | 0.99 | Bullish 15DMA cross |
| VERITASKAP | +94.12 | 32.89 | 4.17 | 48.77 | 0.88 | Bullish price trend |
| NSLTECH | +60.00 | 39.13 | 15.87 | 0.0 | 0.68 | Stable uptrend |
| MULTIVERSE | +36.09 | 42.86 | 0.85 | 0.0 | 0.21 | Above 15/50DMA |
| TRANSCORP | +14.25 | 50.32 | 0.23 | 0.0 | -0.03 | Bullish 15DMA cross |
| Top 5 YTD Losers | ||||||
| Stock | YTD %Chg | RSI | DivY | PE | Beta | Technical |
| MERGROWTH | -28.00 | 46.51 | 0.0 | n/a | -2.31 | Bearish cross, negative MACD |
| DAARCOMM | +26.47 | 48.66 | 0.0 | 0.0 | 0.71 | Below 15DMA, declining |
| CHAMPION | -9.8 | 54.4 | 0.42 | 412.83 | 0.16 | Bullish MACD |
| NEIMETH | -15.74 | 50.59 | 3.38 | 125.52 | 0.25 | Declining but RSI not extreme |
| PZ | +31.68 | 47.68 | 4.59 | 44.17 | 0.56 | Sideways |
- HONYFLOUR & TRANSCORP: Both recurring in multiple leaderboards (daily and YTD) — showing hierarchy of momentum for intermediate to longer-term traders.
- MERGROWTH ETF: Consistent underperformance, but possible mean-reversion set-up as RSI stabilizes despite recent sharp declines.
Unusual Volume & Hidden Insights
| Stock | Volume | vs 90D Avg (%) | Sector |
|---|---|---|---|
| SOVRENINS | 1.42B | +10,468% | Insurance |
| NB | 41.20M | +196% | Beverages |
| GEREGU | 439.8K | +507% | Power/Energy |
| TRANSEXPR | 147.3K | +409% | Courier |
| MORISON | 38.1K | +197% | Medical |
- SOVRENINS: Today's volume is off the charts (~10,000% over 90-day avg) — a classic sign of either deal-driven activity, speculative re-rating, or deep-pocket accumulation.
- NB (Nigerian Breweries) and GEREGU also saw massive volumes, outstripping their recent averages. Monitor for outsized news/insider activity.
Retail vs. Institutional Trade Deep-Dive
| Investor Type | Trade Count | Volume | Value (₦) | % Trades | % Volume | % Value |
|---|---|---|---|---|---|---|
| Institutional | 1,637 | 1.66B | 14.31B | 37% | 91.24% | 89.51% |
| Retail | 23,038 | 159.34M | 1.68B | 63% | 8.76% | 10.49% |
- Institutions are clearly steering the market — responsible for nearly all today's volumes and values, while retail trades are more fragmented (higher count, modest volumes).
-
Top 5 most traded (Institutional): ZENITHBANK (highest value/volume), ACCESSCORP, UBA, MTNN, FIDELITYBK.
These are all financials and telecoms—a strong signal that local and foreign funds are recycling capital into "quality” amid rising turnover. Notably, ZENITHBANK claims 20%+ share of institutional trade value—reaffirming its "safe haven” status in the index. -
Top 5 most traded (Retail): UBA, ACCESSCORP, MTNN, ZENITHBANK, GTCO.
Retail is crowding into large caps, mirroring institutional focus, though often with lag/defensive bias. This "herd” behavior could leave smaller names (especially microcap insurance stocks with unusual volume surges) more vulnerable to sharp moves if sentiment shifts. - Persistent institutional attention on Insurance (e.g., SOVRENINS) signals the sector may experience re-rating/capital inflows soon.
Actionable Suggestions for Traders
- Stay with winners: HONYFLOUR and TRANSCORP have both momentum (15DMA cross) and institutional support; dips are likely to be bought.
- Watch insurance names: SOVRENINS, ROYALEX, and MANSARD attract both speculative volume and yield seekers; potential for sharp swings both ways.
- Yield+Low Beta "Safety”: Consider FIDELITYBK and STANBIC as defensive plays, but watch for FIDELITYBK’s loss of bullish momentum.
- ETF divergence: MERGROWTH, VSPBONDETF are deeply negative YTD — mean-reversion traders might look for stabilization and reversal signals once volume dries up and RSI bottoms out.
- Monitor volume leaders: SOVRENINS (potential "tape reading” opportunities), and NB (always a bellwether for consumer sentiment).
- High dividend & Bullish momentum stocks: CORNERST yields 5.28% and is in an uptrend; good for hybrid income/growth traders.
- Caution: Don’t chase parabolic moves — look for confirmation on follow-through buying and avoid sectors where volume/price action starts diverging from the market (e.g., ETFs today).
|
Top ASI Gainers Over Last 5 Trading Days
|
Top ASI Losers Over Last 5 Trading Days
|
For more detailed analysis, on InfoWARE Market Data Terminal <NSEPERF> <GO>
On InfoWARE Finance Mobile App (Android, iPhone & iPad, Windows Phone and Windows 8/10), "Top Gainers & Losers"
ELLAH LAKES PLC. (ELLAHLAKES) topped the advancers list closing at N12.98 with a gain of 10.00% followed by VERITAS KAPITAL ASSURANCE PLC (VERITASKAP) which closed at N1.98 with a gain of 10.00%.
On the flip side MERISTEM GROWTH EXCHANGE TRADED FUND (MERGROWTH) and AUSTIN LAZ & COMPANY PLC (AUSTINLAZ) topped the decliners log with a loss of -9.86% at a close of N512.00, and -9.75% to close the day at N2.87 respectively.
| Symbol | LClose | %Chg |
|---|---|---|
| ELLAHLAKES | 12.98 | 10.00 |
| VERITASKAP | 1.98 | 10.00 |
| HONYFLOUR | 23.20 | 9.95 |
| ROYALEX | 1.88 | 9.94 |
| MANSARD | 15.82 | 9.94 |
| Symbol | LClose | %Chg |
|---|---|---|
| MERGROWTH | 512.00 | -9.86 |
| AUSTINLAZ | 2.87 | -9.75 |
| NEIMETH | 6.05 | -8.33 |
| VSPBONDETF | 265.99 | -4.63 |
| DAARCOMM | 0.86 | -4.44 |
For more detailed analysis,
- On InfoWARE Market Data Terminal <TOPG> <GO>
- On InfoWARE Finance Mobile App ( Android, iPhone & iPad and Windows 10) , "Top Gainers & Losers"
Currency Market
In the currency market, the Naira fell 0.48%(-7.42) against the Dollar to settle at 1 to 1NSE: Bull Signal - Price crossed above 15 Day MA
This signal implies these stocks are under buying pressure and the price might continue to rise and therefore positions should be monitored closely. Further suggested analysis include looking at the overall market (ASI) to see if the uptrend is market wide, sector wide or specific to the stock. Portfolio managers tend to use this as a signal to do more research to add to their positions or lock in some profits. Typically further analysis should be done using commands like PC and RV on the InfoWARE Market Data Terminal. Another command is ALERTS to set price triggers for possible exit or entry as necessary
For more detailed analysis,
- On InfoWARE Market Data Terminal <NSEPERF> <GO>
- On InfoWARE Finance Mobile App ( Android , iPhone & iPad and Windows 10) , "Top Gainers & Losers"
| Symbol | Price | %Chg | 15DMA | PE | EPS | DivY | MktCap | Vol | Trades | Value | LstTradeTime |
|---|---|---|---|---|---|---|---|---|---|---|---|
| HONYFLOUR | 23.20 | 9.05 | 22.40 | 16.28 | 0.31 | 1.40 | 183.98B | 1.10M | 362.00 | 23.94M | 04-Sep-2025 14:30:11.870 |
| CORNERST | 7.18 | 8.77 | 6.90 | 8.62 | 0.35 | 5.28 | 130.43B | 1.47M | 81.00 | 10.25M | 04-Sep-2025 14:30:11.297 |
| TRANSCORP | 49.70 | 7.44 | 47.89 | 0.00 | 0.00 | 0.23 | 2,020.21B | 1.26M | 254.00 | 59.59M | 04-Sep-2025 14:30:13.050 |
| JAIZBANK | 4.50 | 4.22 | 4.49 | 83.05 | 0.03 | 1.67 | 155.44B | 8.31M | 463.00 | 36.52M | 04-Sep-2025 14:30:37.347 |
| CONHALLPLC | 4.38 | 4.11 | 4.35 | 69.63 | 0.03 | 2.08 | 46.89B | 2.20M | 102.00 | 9.33M | 04-Sep-2025 14:30:11.240 |
| NGXGROUP | 60.00 | 3.67 | 58.99 | 0.00 | 0.00 | 2.73 | 117.85B | 2.26M | 127.00 | 129.87M | 04-Sep-2025 14:30:12.490 |
| STANBICETF30 | 434.99 | 3.45 | 428.50 | 0.00 | 0.00 | 983.00 | 17.00 | 379.22K | 04-Sep-2025 14:30:35.113 | ||
| FGS202760 | 100.00 | 1.00 | 99.07 | 0.00 | 0.00 | 300.00 | 1.00 | 300.00K | 04-Sep-2025 14:30:15.367 | ||
| FGS202677 | 100.00 | 0.00 | 100.00 | 0.00 | 0.00 | 0.00 | 0.00 | 0.00 | 04-Sep-2025 14:30:15.343 | ||
| STANBIC | 99.95 | 0.00 | 99.39 | 6.87 | 8.23 | 3.54 | 1,295.05B | 88.83K | 163.00 | 8.50M | 04-Sep-2025 14:30:12.910 |
NSE: BEAR Signal - Price crossed below 15 Day MA
This signal implies these stocks are under selling pressure and the price might continue to slide and therefore positions should be monitored closely. Further suggested analysis include looking at the overall market (ASI) to see if the downtrend is market wide, sector wide or specific to the stock. If the overal market trend is upwards, then since these stocks are heading in the opposite direction, then further analysis should be done using commands like PC and RV on the InfoWARE Market Data Terminal. Another command is ALERTS to set price triggers for possible exit is necessar
For more detailed analysis,
- On InfoWARE Market Data Terminal <BEARM> <GO>
- On InfoWARE Finance Mobile App ( Android , iPhone & iPad and Windows 10)
| Symbol | Price | %Chg | 15DMA | PE | EPS | DivY | MktCap | Vol | Trades | Value | LstTradeTime |
|---|---|---|---|---|---|---|---|---|---|---|---|
| FIDELITYBK | 21.00 | -0.24 | 21.01 | 13.24 | 1.17 | 5.48 | 608.47B | 30.56M | 665.00 | 642.12M | 04-Sep-2025 14:30:34.870 |
| FG202034S2 | 108.25 | -4.11 | 112.40 | 0.00 | 0.00 | 148.00 | 1.00 | 160.21K | 04-Sep-2025 14:30:14.700 | ||
| FGS202774 | 110.00 | -9.09 | 111.80 | 0.00 | 0.00 | 1.00 | 1.00 | 1.10K | 04-Sep-2025 14:30:15.457 |
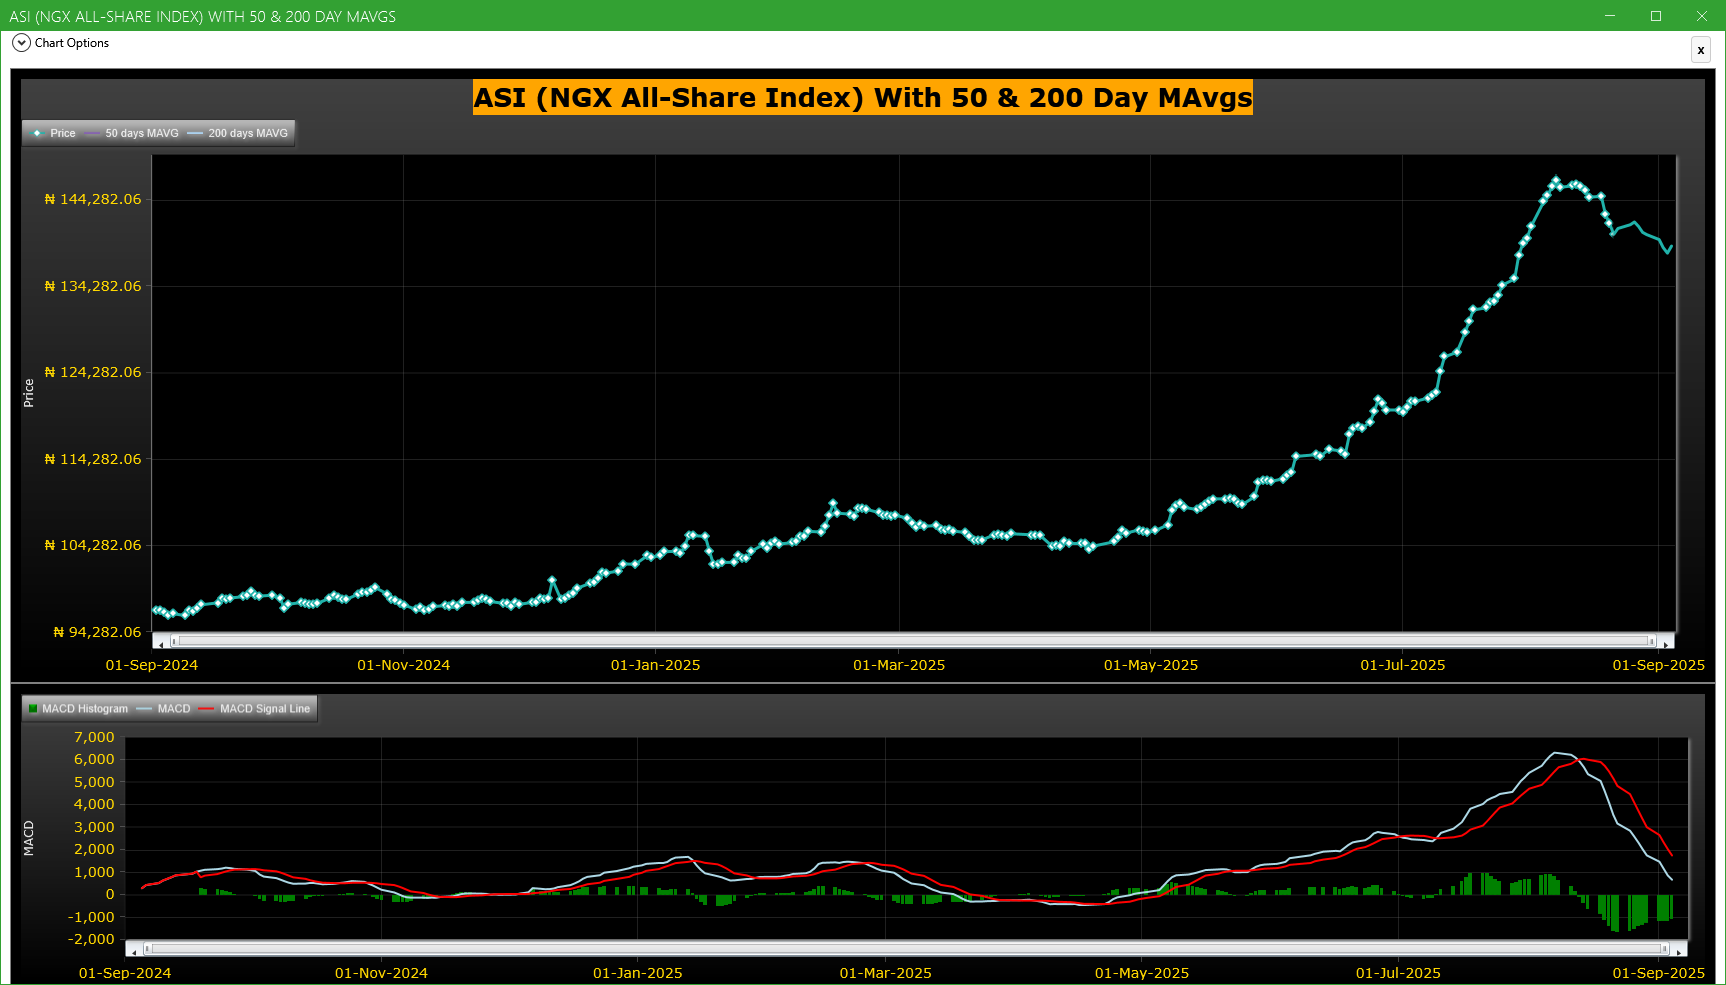
Market Trend - ASI (NGX All-Share-Index) With 50 & 200 Day MAvgs Chart
Technical traders typically use the 50 & 200 day moving averages to aid in choosing
where to enter or exit a position, which then causes these levels to act as strong
support or resistance. As a general guideline, if the price is above a moving average,
the trend is up. If the price is below a moving average, the trend is down.
It is important to note that critics of technical analysis say that moving averages act
as support and resistance because so many traders use these indicators to inform their
trading decisions. Also moving averages tend to work quite well in strong trending conditions
but poorly in choppy or ranging conditions.
Trading Strategies: Crossovers
Crossovers are one of the main moving average strategies. The first type is a price crossover,
which is when the price crosses above or below a moving average to signal a potential change
in trend. Another strategy is to apply two moving averages to a chart: one longer and one
shorter. When the shorter-term MA crosses above the longer-term MA, it is a buy signal, as
it indicates that the trend is shifting up. This is known as a golden cross. Meanwhile, when
the shorter-term MA crosses below the longer-term MA, it is a sell signal, as it indicates that
the trend is shifting down. This is known as a dead/death cross
For more detailed analysis,
- On InfoWARE Market Data Terminal <CI> <GO>
- On InfoWARE Finance Mobile App ( Android , iPhone & iPad and Windows 10) , "Research"
Unusual Volume: Volume traded is more than double the 90 day moving average (All exchanges; ASI & ASem). For more detailed analysis,
- On InfoWARE Market Data Terminal <UV> <GO>
- On InfoWARE Finance Mobile App ( Android , iPhone & iPad and Windows 10)
| Symbol | Name | Volume | 90DAvgVol | %VolChg | Price | LClose | %Chg | Trades | Value |
|---|---|---|---|---|---|---|---|---|---|
| SOVRENINS | SOVEREIGN TRUST INSURANCE PLC | 1.42B | 13.40M | 10,468.39 | 2.97 | 2.85 | 4.21 | 124 | 4.21B |
| NB | NIGERIAN BREW. PLC. | 41.20M | 13.92M | 195.90 | 68.50 | 66.00 | 3.79 | 250 | 2.82B |
| GEREGU | GEREGU Power PLC | 439.79K | 72.48K | 506.73 | 1,141.50 | 1,141.50 | 0.00 | 52 | 451.84M |
| TRANSEXPR | TRANS-NATIONWIDE EXPRESS PLC. | 147.30K | 28.94K | 408.97 | 2.15 | 2.15 | 0.00 | 9 | 336.65K |
| MORISON | MORISON INDUSTRIES PLC. | 38.10K | 12.83K | 197.00 | 3.22 | 3.22 | 0.00 | 6 | 133.40K |
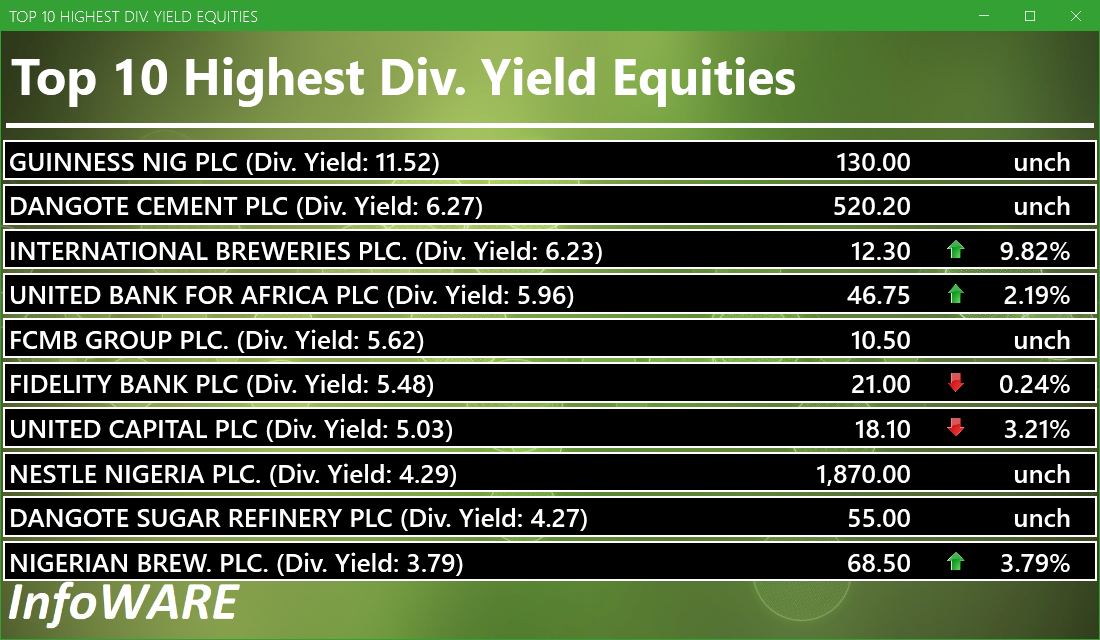
Investment Insights - High Div. Stocks
Dividend stocks distribute a portion of the company earnings to investors on a regular basis and they can a great choice for investors looking for regular income. As an investment or trading strategy, high dividend yield equities provide annual cash payments as against mostly capital gains in the price of a stock. The list in the table below represent the highest dividend paying stocks from the list of the most liquid stocks in the NSE top 30.
For more detailed analysis,
- On InfoWARE Market Data Terminal <HYIELD> <GO>
- On InfoWARE Finance Mobile App ( Android , iPhone & iPad and Windows 10) , "Research"
African Markets
| Name | LClose | Change | %Chg |
|---|---|---|---|
| BRVM Stock Exchange | 320.19 | 0.93 | 0.29 |
| Botswana Stock Exchange | 10,566.38 | 0.00 | 0.00 |
| Egyptian Exchange | 34,761.97 | -393.74 | -1.12 |
| Ghana Stock Exchange | 7,320.21 | 10.23 | 0.14 |
| Lusaka Stock Exchange | 24,534.59 | 168.13 | 0.69 |
| Casablanca Stock Exchange | 20,146.13 | 28.17 | 0.14 |
| Malawi Stock Exchange | 535,138.21 | -2,095.21 | -0.39 |
| Nigeria Stock Exchange | 138,157.16 | -582.71 | -0.42 |
| Nairobi Securities Exchange | 178.04 | 2.84 | 1.62 |
| Rwanda Stock Exchange | 178.88 | 0.00 | 0.00 |
| Uganda Securities Exchange | 1,437.60 | 1.01 | 0.07 |
Nigeria Market Indexes
| Symbol | LClose | %Chg | WTD% | MTD% | QTD% | YTD% | MktCap | Trades |
|---|---|---|---|---|---|---|---|---|
| ASI | 138,980.01 | 0.60 | -0.53 | -0.53 | 16.07 | 34.70 | 23,203 | |
| NGX30 | 5,076.76 | 0.62 | -0.39 | -0.39 | 7.47 | 33.08 | 12,654 | |
| NGXAFRBVI | 3,478.88 | 1.38 | -0.19 | -0.19 | -1.82 | 40.23 | 5,311 | |
| NGXAFRHDYI | 22,266.12 | 0.18 | -1.18 | -1.18 | 6.47 | 30.77 | 6,116 | |
| NGXASEM | 1,538.10 | 0.00 | 0.00 | 0.00 | -3.57 | -2.88 | 2 | |
| NGXBNK | 1,505.37 | 0.98 | -0.40 | -0.40 | -0.36 | 38.44 | 6,005 | |
| NGXCG | 4,010.62 | 0.88 | -0.60 | -0.60 | 16.63 | 41.76 | 12,577 | |
| NGXCNSMRGDS | 3,152.93 | 1.54 | -1.15 | -1.15 | -9.10 | 81.79 | 2,770 | |
| NGXCOMMDTY | 1,067.29 | 0.00 | -0.07 | -0.07 | 1.91 | 6.73 | ||
| NGXGROWTH | 11,216.52 | 0.22 | 0.15 | 0.15 | 17.95 | 44.49 | 203 | |
| NGXINDUSTR | 4,871.08 | 0.00 | -1.24 | -1.24 | 38.27 | 36.38 | 2,044 | |
| NGXINS | 1,279.00 | 6.73 | -0.31 | -0.31 | 73.17 | 62.68 | 1,925 | |
| NGXLOTUSISLM | 11,287.22 | 0.11 | -1.15 | -1.15 | 17.89 | 61.99 | 3,898 | |
| NGXMAINBOARD | 6,753.06 | 0.74 | -0.50 | -0.50 | 14.48 | 34.95 | 16,534 | |
| NGXMERIGRW | 9,842.72 | 0.19 | -1.72 | -1.72 | 1.97 | 50.89 | 2,967 | |
| NGXMERIVAL | 13,256.11 | 0.90 | -0.85 | -0.85 | 10.95 | 27.09 | 6,808 | |
| NGXOILGAS | 2,363.12 | 0.03 | -0.32 | -0.32 | -1.21 | -12.84 | 349 | |
| NGXPENBRD | 2,578.46 | 0.39 | -0.45 | -0.45 | 12.14 | 40.77 | 19,118 | |
| NGXPENSION | 6,599.45 | 0.70 | -0.31 | -0.31 | 3.85 | 45.55 | 14,410 | |
| NGXPREMIUM | 13,682.29 | 0.31 | -0.58 | -0.58 | 19.29 | 40.58 | 6,466 | |
| NGXSOVBND | 655.08 | -0.63 | -0.58 | -0.58 | 0.24 | 8.90 | 1 |
For more detailed analysis,
- On InfoWARE Market Data Terminal <MKTINS> <GO>
- On InfoWARE Finance Mobile App ( Android, iPhone & iPad and Windows 10) , "Market Indexes"
Find the topic interesting? Will like to comment? Contact Us at solutions@infowarelimited.com
Top News

Chart Of The Day - ASI Chart Vs ASI Advance Decline Line (YTD) (04-Sep-2025 15:08:19.781)
InfoWARE AI Analyst Daily Market Report: 04-Sep-2025

[MERGROWTH]>> DAILY INDICATIVE PRICES
[XNSA]>> DAILY FUND PRICE SUBMISSION - FCMB ASSET MANAGEMENT LIMITED
[XNSA]>> NGX FIXED INCOME INDICATIVE PRICE LIST FOR SEP 04, 2025
[VETBANK]>> DAILY INDICATIVE PRICES
RESIGNATION OF DIRECTORS (STANDARD CAPITAL AND ASSET MANAGEMENT LIMITED)
[XNSA]>> PUBLIC HOLIDAY
[XNSA]>> CORDROS MILESTONE FUNDS' BID & OFFER PRICES
[XNSA]>> CLOSING GONG CEREMONY AND FACTS BEHIND THE FIGURES BY DANGOTE CEMENT
[XNSA]>> REGISTRATION FOR BATCH TWO- 2025 DEALING CLERKSHIP CERTIFICATION PROGRA
[XNSA]>> UPDATED- SAVE THE DATE: 29TH ANNUAL STOCKBROKERS CONFERENCE
[XNSA]>> FGN SAVINGS BOND OFFER SEPTEMBER 2025
Chart Of The Day - ASI Chart Vs ASI Advance Decline Line (YTD) (03-Sep-2025 15:07:49.802)
InfoWARE AI Analyst Daily Market Report: 03-Sep-2025
[MERGROWTH]>> DAILY INDICATIVE PRICES
[SIAMLETF40]>> DAILY INDICATIVE PRICES
[VSPBONDETF]>> DAILY INDICATIVE PRICES
[XNSA]>> CORDROS MILESTONE FUNDS' BID & OFFER PRICES
[XNSA]>> NGX FIXED INCOME INDICATIVE PRICE LIST FOR SEP 03, 2025
[XNSA]>> CLOSING GONG CEREMONY AND FACTS BEHIND THE FIGURES BY DANGOTE CEMENT
[XNSA]>> LIFTING OF SUSPENSION - UNIVERSAL INSURANCE PLC
[XNSA]>> REGISTRATION FOR BATCH TWO- 2025 DEALING CLERKSHIP CERTIFICATION PROGRA
[XNSA]>> UPDATED- SAVE THE DATE: 29TH ANNUAL STOCKBROKERS CONFERENCE
[XNSA]>> NOTIFICATION OF PRICE ADJUSTMENT
[XNSA]>> FGN SAVINGS BOND OFFER SEPTEMBER 2025
Chart Of The Day - ASI Chart Vs ASI Advance Decline Line (YTD) (02-Sep-2025 16:57:57.009)
InfoWARE Analyst Daily Market Report (02-Sep-2025 16:57:52.407)
[XNSA]>> OFF MARKET TRADE
[MERGROWTH]>> DAILY INDICATIVE PRICES
Get IDIA - the stock trading app for the modern investor
Solutions by Business
Product Suites
Company
Contacts
- 8th Floor,
- South Atlantic Petroleum Towers,
- 1 Adeola Odeku Street,
- Victoria Island,
- Lagos, Nigeria.
- Email: solutions@infowarelimited.com
Follow Us
 |
 |
 |
 |