


InfoWARE AI Analyst Daily Market Report: 10-Oct-2025 | InfoWARE Finance
Get IDIA - the stock trading app for the modern investor


InfoWARE AI Analyst Daily Market Report: 10-Oct-2025
(Source: InfoWARE Terminal, Date: 10-Oct-2025)
Dear Investor,
NGX Daily Market Summary – Friday, October 10, 2025
Market Wrap: It was an upbeat close to the week on the NGX, as the All Share Index (ASI) gained 0.54% to finish at 146,204.34. However, beneath the green headline, the tone was more nuanced: declines outpaced advances (25 advancers vs 31 decliners), yielding a narrow market breadth of 0.81x. A sharp -59.73% dip in turnover (₦10.45B, down from ₦25.95B) highlights a risk-off sentiment among institutional investors, but overall trading volume rose on the day, buoyed by spikes in certain mid-tier names and selected insurance plays. The YTD performance remains robust at +42.46%, underscoring a still-buoyant market for patient investors.
Key Market Breadth & Trends
- Market Breadth: Decliners (31) outnumbered gainers (25), suggesting the upward move was driven by a few heavyweights rather than broad strength.
- Volume vs Value: Daily traded volume increased to 385.51M shares (+18.6% vs. previous day), but traded value slumped sharply, as institutional focus shifted to lower-priced names and as block trades dried up.
- Unusual Volume: LIVINGTRUST (+2647.7%), MEYER (+298.7%), CHAMS (+119.1%), ETERNA (+121.3%) stood out, signaling either block accumulation/distribution or potential catalytic events. Keep these names on your active radar.
-
Retail vs Institutional Flow:
- Retail: 61.99% of trade count, but only 13.48% of value
- Institutional: 86.52% by value, focused on DANGCEM, ZENITHBANK, UBA, ACCESSCORP, and ARADEL
Top Gainers and Losers – Intra-Day Focus
| Stock | Price (₦) | % Chg | RSI | Beta | MACD |
|---|---|---|---|---|---|
| DANGCEM | 575.00 | +6.48% | 55.7 | 1.94 | 7.12 (Bullish) |
| NEM | 29.15 | +5.23% | 49.3 | 0.69 | 0.09 |
| FTNCOCOA | 5.80 | +3.57% | 47.9 | 0.79 | -0.04 |
| CWG | 17.95 | +3.46% | 53.9 | -0.06 | 0.39 |
| DEAPCAP | 1.80 | +3.45% | 52.9 | 0.89 | 0.01 |
| MERVALUE | 144.00 | -10.00% | 40.0 | 4.95 | -8.16 |
| MEYER | 15.10 | -9.85% | 51.6 | -0.09 | 0.13 |
| STERLINGNG | 7.55 | -9.58% | 57.8 | 1.41 | 0.24 |
| VETGRIF30 | 52.90 | -8.79% | 63.0 | 0.71 | 1.38 |
| NEWGOLD | 53,000.00 | -7.02% | 53.5 | 0.23 | 903.7 |
- DANGCEM powered gains (institutional flows), with a +6.48% jump and strong momentum signals (RSI 55.7, MACD 7.12) supported by above-average institutional volume.
- Notable downside: MERVALUE ETF -10.0% (and also YTD laggard), MEYER -9.85% (unusual volume), and STERLINGNG -9.58%—the last two displaying distribution after a period of speculative accumulation.
- LIVINGTRUST not on top gainers/losers but flagged for 2647.7% volume spike; price dipped -2.80%—suggesting possible unwinding or large block activity.
Momentum Watch: Bullish & Bearish Signals
-
Bullish 15DMA Crossovers: NEM (Insurance), JAIZBANK (Banking), FTNCOCOA (Crop Processing), MBENEFIT (Insurance), ACADEMY (Printing), VERITASKAP (Insurance).
- These names are seeing buying support; insurance stands out for sector-wide momentum.
- Bearish 15DMA Cross-downs: STERLINGNG, NEWGOLD, CORNERST, WAPIC, GUINEAINS, etc.—selling pressure is strongest in Insurance and select Financials. STERLINGNG is a repeat YTD and recent loser.
-
RSI Perspective:
- No names in overbought (RSI > 70) nor oversold (RSI < 30) territory, but EUNISELL, MECURE, MTNN, and SOVRENINS (all recent outperformers) hover above 54 and should be monitored for potential profit-taking/reversal.
- LIVINGTRUST (YTD loser, unusual volume, RSI ~51)—could be at the beginning of a recovery or more selling.
-
MACD:
- DANGCEM's MACD (7.12 vs 5.29 signal) is clearly bullish and supported by volume; MERVALUE deepens into bearish territory (-8.16 MACD).
Year-To-Date (YTD) Top Gainers & Losers
| Stock | Price (₦) | YTD %Chg | RSI | DivY | Beta |
|---|---|---|---|---|---|
| EUNISELL | 44.00 | +128.33 | 80.2 | 0.31 | -0.22 |
| MTNN | 471.00 | +135.50 | 60.2 | 3.29 | 1.31 |
| MECURE | 28.40 | +104.32 | 72.9 | 0.00 | 0.00 |
| SOVRENINS | 3.13 | +160.98 | 54.9 | 3.75 | 1.12 |
| YTD Top Losers | |||||
| LIVINGTRUST | 5.35 | -81.28 | 51.3 | 1.67 | 0.00 |
| MERVALUE | 160.00 | -27.89 | 40.0 | 0.00 | 4.95 |
| STERLINGNG | 8.35 | -70.50 | 57.8 | 3.19 | 1.41 |
| MEYER | 16.75 | -9.85 | 51.6 | 3.91 | -0.09 |
- MEYER, STERLINGNG, LIVINGTRUST, MERVALUE—consistently appearing across both top YTD losers and today's heavy volume/change lists. Expect heightened volatility and caution; possible mean reversion opportunities.
- DANGCEM appears among top recent gainers with heavy institutional trade, suggesting strong market-maker interest.
- SOVRENINS combines strong YTD gains, above-average RSI, and healthy dividend yield (3.75%)—defensive momentum in Insurance.
- Sector rotation? Insurers (NEM, MBENEFIT, VERITASKAP, SOVRENINS) make multiple technical "bullish" lists—evidence of rotation within financials.
Contrarian Signals
- MEYER PLC: -9.85% YTD and -9.85% today, but RSI is 51.6 and MACD is positive (0.13)—suggesting a potential technical rebound or that selling pressure may be overdone.
- STERLINGNG: Appears as one of the top YTD losers and closes down -9.58% today with bearish momentum (below 15DMA), yet RSI remains elevated (57.8). Oversold, or value trap? Wait-and-see.
- MERVALUE ETF: Dumps heavily today and is firmly negative YTD, but with a low RSI (40.0)—contrarian money may begin to take a closer look.
- DANGCEM: Strong positive price action & indicators, but Beta is very high (1.94), so expect volatility swings.
Sector Heatmap Snapshot
| Sector | Key Movers | Performance | Retail/Inst. Interest | Technical Trend |
|---|---|---|---|---|
| Insurance | NEM, MBENEFIT, VERITASKAP, SOVRENINS, WAPIC | Multiple gainers, broad rotation | Heavy Retail & Cross-over Inst. | Bullish (15DMA cross, RSI 50+) |
| Banking | ZENITHBANK, STERLINGNG, UBA, ACCESSCORP | Mixed (access steady, STERLINGNG under pressure) | Inst. focus on ZENITHBANK, ACCESS, UBA | Top banks flat; smaller names weak |
| Building Materials | DANGCEM | DANGCEM leads upside | High Institutional | Clear bullish trend |
| ETF & Funds | MERVALUE, VETGRIF30, NEWGOLD | Acute weakness | Sales/Distribution noted | Bearish (MACD, below 15DMA) |
| Telecom | MTNN | Stable, defensive | Retail dominance | Bullish YTD, technical stable |
Dividend-Beta Matrix (Defensive Buys?)
| Stock | Dividend Yield | Beta | Momentum Status |
|---|---|---|---|
| SOVRENINS | 3.75% | 1.12 | Bullish (YTD +161%) |
| MTNN | 3.29% | 1.31 | Strong YTD, stable |
| FIDELITYBK | 5.48% | 0.89 | Bearish (price below 15DMA) |
| NEM | 6.52% | 0.69 | Bullish (price above 15DMA, RSI 49) |
- NEM & SOVRENINS: High dividend yields, solid momentum signals, relatively low Beta—potential safe havens/candidate for defensive accumulation.
- FIDELITYBK: Tempting yield but price action is bearish—wait for stabilization.
Institutional Clustering Alerts
- DANGCEM: Institutional trades account for 45% of volume and nearly 9.6% of total traded value—a decisive vote of confidence and driver of index movement.
- ZENITHBANK: 20.17% of institutional value share; also top for retail activity. Despite index weight, ZENITHBANK’s price slipped -1.01%—potential profit-taking.
- ARADEL, UBA, ACCESSCORP: Institutions rotated into ARADEL and UBA. ACCESS stagnated, implying perspectives diverge by risk appetite.
Notable Overlaps & Hidden Insights
- STERLINGNG, MEYER, LIVINGTRUST: Present in both YTD losers and today’s highest-selling names by volume and percent change, with bearish technical crossovers. Momentum traders should be cautious—volatility is likely to persist.
- Insurance: NEM, MBENEFIT, VERITASKAP, SOVRENINS all on bullish lists and with dividend yields above 2.5%—supporting sector-wide accumulation for income-seeking investors.
Trader Playbook & Suggestions
- Focus on momentum names with institutional interest—DANGCEM, NEM, SOVRENINS. Institutional clustering and bullish technicals suggest further gains if market participation continues.
- Beware value traps— names like STERLINGNG and MEYER need to prove support holds before considering contrarian (mean-reversion) trades, despite their unusually high volume.
- Defensive rotation— Insurance sector, especially dividend-payers (NEM, SOVRENINS), offers a blend of income and relative outperformance.
- Monitor funds/ETF space— Aggressive selling in MERVALUE and NEWGOLD may offer swing-trade opportunities for bold contrarians as RSI approaches oversold.
- Retail strategy: With retail investors comprising 62% of trades but only 13% of value, stick to high-liquidity, institutional-backed names to avoid "pump-and-dump" scenarios in speculative small caps.
Retail vs. Institutional Trade Patterns & Correlations
- Most traded institutional stocks: DANGCEM, ARADEL, ZENITHBANK, UBA, ACCESSCORP—also among those with greatest price impact and technical momentum, reaffirming data-led conviction trading.
- Most traded retail stocks: MTNN, ZENITHBANK, STERLINGNG, ACCESSCORP, UBA—retail flow often follows or amplifies institutional moves.
- Overlap: ZENITHBANK, ACCESSCORP, UBA actively traded across both groups, increasing relevance for both short-term momentum and long-term accumulation strategies.
- Disparity: Retail focus on MTNN (defensive/telecom) vs. institutional on DANGCEM (cyclical/building). Watch for sectoral shifts if risk sentiment changes.
Summary & Forward-Looking Insights
- Despite today’s index gain, market breadth was negative—be selective; avoid chasing broad-based rallies until participation widens.
- Financials (esp. insurance), some building materials, and select telecommunications stocks are the focal points for new money and sector rotation.
- Turnover drop signals growing caution—likely ahead of external events or expected volatility. Watch next week for confirmation of trend.
- Volume spikes in YTD laggards (LIVINGTRUST, MEYER) suggest possible shakeouts—sharp bounces or further falls possible.
- For income-seekers, insurance sector offers rare combination of decent yield and positive technical momentum in current market backdrop.
|
Top ASI Gainers Over Last 5 Trading Days
|
Top ASI Losers Over Last 5 Trading Days
|
For more detailed analysis, on InfoWARE Market Data Terminal <NSEPERF> <GO>
On InfoWARE Finance Mobile App (Android, iPhone & iPad, Windows Phone and Windows 8/10), "Top Gainers & Losers"
DANGOTE CEMENT PLC (DANGCEM) topped the advancers list closing at N575.00 with a gain of 6.48% followed by N.E.M INSURANCE CO (NIG) PLC. (NEM) which closed at N29.15 with a gain of 5.23%.
On the flip side MERISTEM VALUE EXCHANGE TRADED FUND (MERVALUE) and UNION HOMES REAL ESTATE INVESTMENT TRUST (REIT) (UHOMREIT) topped the decliners log with a loss of -10.00% at a close of N144.00, and -9.98% to close the day at N51.85 respectively.
| Symbol | LClose | %Chg |
|---|---|---|
| DANGCEM | 575.00 | 6.48 |
| NEM | 29.15 | 5.23 |
| JAIZBANK | 4.50 | 4.65 |
| FTNCOCOA | 5.80 | 3.57 |
| CWG | 17.95 | 3.46 |
| Symbol | LClose | %Chg |
|---|---|---|
| MERVALUE | 144.00 | -10.00 |
| UHOMREIT | 51.85 | -9.98 |
| MEYER | 15.10 | -9.85 |
| STERLINGNG | 7.55 | -9.58 |
| LOTUSHAL15 | 103.00 | -9.54 |
For more detailed analysis,
- On InfoWARE Market Data Terminal <TOPG> <GO>
- On InfoWARE Finance Mobile App ( Android, iPhone & iPad and Windows 10) , "Top Gainers & Losers"
Currency Market
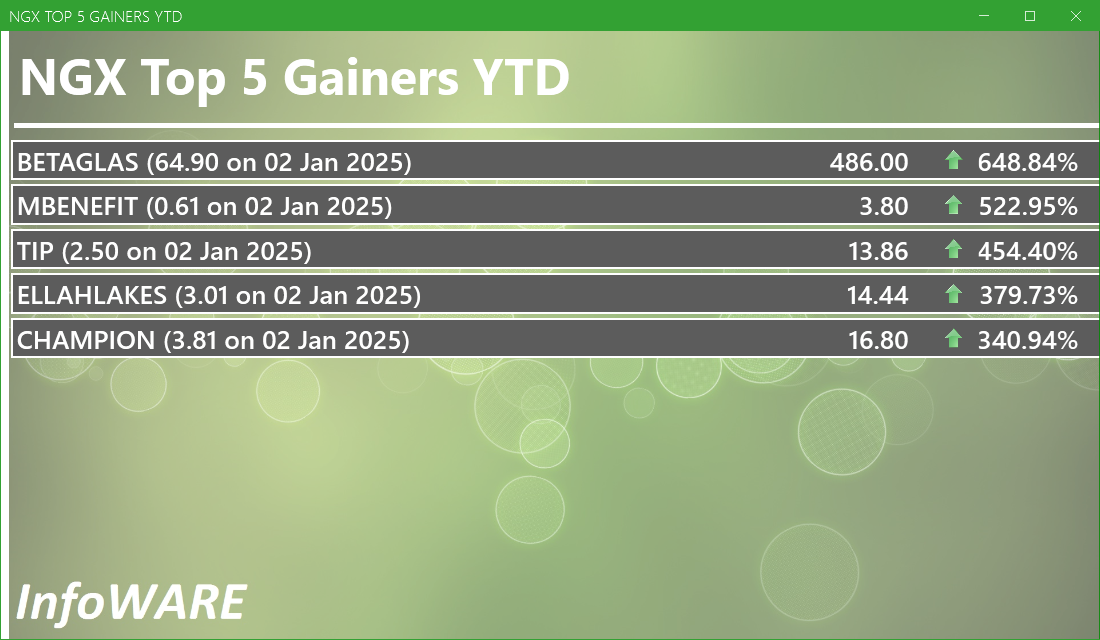
In the currency market, the Naira fell 0.12%(-1.76) against the Dollar to settle at 1 to 1Investment Insights - Top 5 Gainers YTD
These stocks are the best performers whose price has risen faster than the market as a whole with the best returns year to date. Momentum investors believe that stocks that have outperformed the market will often continue to do so because the factors that caused them to outperform will not suddenly disappear. In addition, other investors seeking to benefit from the stock’s outperformance will often purchase the stock, further bidding its price higher and pushing the stock higher still
For more detailed analysis,
- On InfoWARE Market Data Terminal <T5YTD2> <GO>
- On InfoWARE Finance Mobile App ( Android , iPhone & iPad and Windows 10) , "Research"
NSE: Bull Signal - Price crossed above 15 Day MA
This signal implies these stocks are under buying pressure and the price might continue to rise and therefore positions should be monitored closely. Further suggested analysis include looking at the overall market (ASI) to see if the uptrend is market wide, sector wide or specific to the stock. Portfolio managers tend to use this as a signal to do more research to add to their positions or lock in some profits. Typically further analysis should be done using commands like PC and RV on the InfoWARE Market Data Terminal. Another command is ALERTS to set price triggers for possible exit or entry as necessary
For more detailed analysis,
- On InfoWARE Market Data Terminal <NSEPERF> <GO>
- On InfoWARE Finance Mobile App ( Android , iPhone & iPad and Windows 10) , "Top Gainers & Losers"
| Symbol | Price | %Chg | 15DMA | PE | EPS | DivY | MktCap | Vol | Trades | Value | LstTradeTime |
|---|---|---|---|---|---|---|---|---|---|---|---|
| NEM | 29.15 | 4.97 | 27.96 | 24.99 | 0.37 | 6.52 | 146.23B | 240.50K | 60.00 | 6.90M | 10-Oct-2025 15:03:55.513 |
| JAIZBANK | 4.50 | 4.44 | 4.40 | 83.05 | 0.03 | 1.67 | 155.44B | 9.42M | 368.00 | 41.85M | 10-Oct-2025 15:03:57.953 |
| FTNCOCOA | 5.80 | 3.45 | 5.72 | 0.00 | 0.00 | 1.60 | 22.62B | 1.90M | 156.00 | 11.28M | 10-Oct-2025 15:03:53.737 |
| MBENEFIT | 3.80 | 2.63 | 3.79 | 5.43 | 0.11 | 3.28 | 76.23B | 2.64M | 165.00 | 9.92M | 10-Oct-2025 15:03:55.390 |
| ACADEMY | 9.60 | 2.60 | 9.44 | 0.00 | 0.00 | 3.51 | 7.26B | 726.03K | 42.00 | 6.96M | 10-Oct-2025 15:03:53.610 |
| VERITASKAP | 2.07 | 0.48 | 2.06 | 48.77 | 0.02 | 4.17 | 28.70B | 3.29M | 84.00 | 6.79M | 10-Oct-2025 15:03:48.693 |
NSE: BEAR Signal - Price crossed below 15 Day MA
This signal implies these stocks are under selling pressure and the price might continue to slide and therefore positions should be monitored closely. Further suggested analysis include looking at the overall market (ASI) to see if the downtrend is market wide, sector wide or specific to the stock. If the overal market trend is upwards, then since these stocks are heading in the opposite direction, then further analysis should be done using commands like PC and RV on the InfoWARE Market Data Terminal. Another command is ALERTS to set price triggers for possible exit is necessar
For more detailed analysis,
- On InfoWARE Market Data Terminal <BEARM> <GO>
- On InfoWARE Finance Mobile App ( Android , iPhone & iPad and Windows 10)
| Symbol | Price | %Chg | 15DMA | PE | EPS | DivY | MktCap | Vol | Trades | Value | LstTradeTime |
|---|---|---|---|---|---|---|---|---|---|---|---|
| GUINNESS | 183.75 | 0.00 | 183.83 | 31.75 | 1.95 | 11.52 | 402.48B | 278.99K | 83.00 | 49.57M | 10-Oct-2025 15:03:55.443 |
| FIDELITYBK | 20.30 | -0.99 | 20.43 | 13.24 | 1.17 | 5.48 | 588.19B | 47.34M | 421.00 | 959.32M | 10-Oct-2025 15:03:51.843 |
| WAPIC | 3.00 | -3.33 | 3.08 | 72.55 | 0.02 | 2.56 | 71.98B | 6.85M | 97.00 | 20.75M | 10-Oct-2025 15:03:49.533 |
| HMCALL | 4.12 | -4.13 | 4.19 | 0.00 | 0.00 | 0.00 | 0.00 | 843.74K | 31.00 | 3.51M | 10-Oct-2025 15:03:54.087 |
| GUINEAINS | 1.43 | -4.90 | 1.48 | 66.79 | 0.01 | 1.96 | 8.78B | 3.95M | 533.00 | 5.69M | 10-Oct-2025 15:03:55.310 |
| TRANSCORP | 46.10 | -6.29 | 47.45 | 0.00 | 0.00 | 0.23 | 1,873.87B | 823.36K | 163.00 | 38.74M | 10-Oct-2025 15:03:49.387 |
| NEIMETH | 6.01 | -6.49 | 6.22 | 125.52 | 0.02 | 3.38 | 25.68B | 654.75K | 83.00 | 4.03M | 10-Oct-2025 15:03:55.537 |
| CORNERST | 6.21 | -7.41 | 6.26 | 8.62 | 0.35 | 5.28 | 112.81B | 739.38K | 60.00 | 4.69M | 10-Oct-2025 15:03:52.133 |
| NEWGOLD | 53,000.00 | -7.55 | 54,142.20 | 0.00 | 0.00 | 0.00 | 0.00 | 30.00 | 6.00 | 1.69M | 10-Oct-2025 15:03:48.057 |
| STERLINGNG | 7.55 | -10.60 | 7.72 | 15.75 | 0.30 | 3.19 | 217.37B | 16.71M | 947.00 | 132.77M | 10-Oct-2025 15:03:53.677 |
| FGSUK2033S6 | 92.10 | -16.13 | 98.72 | 0.00 | 0.00 | 430.00K | 4.00 | 396.12M | 10-Oct-2025 15:03:58.007 |
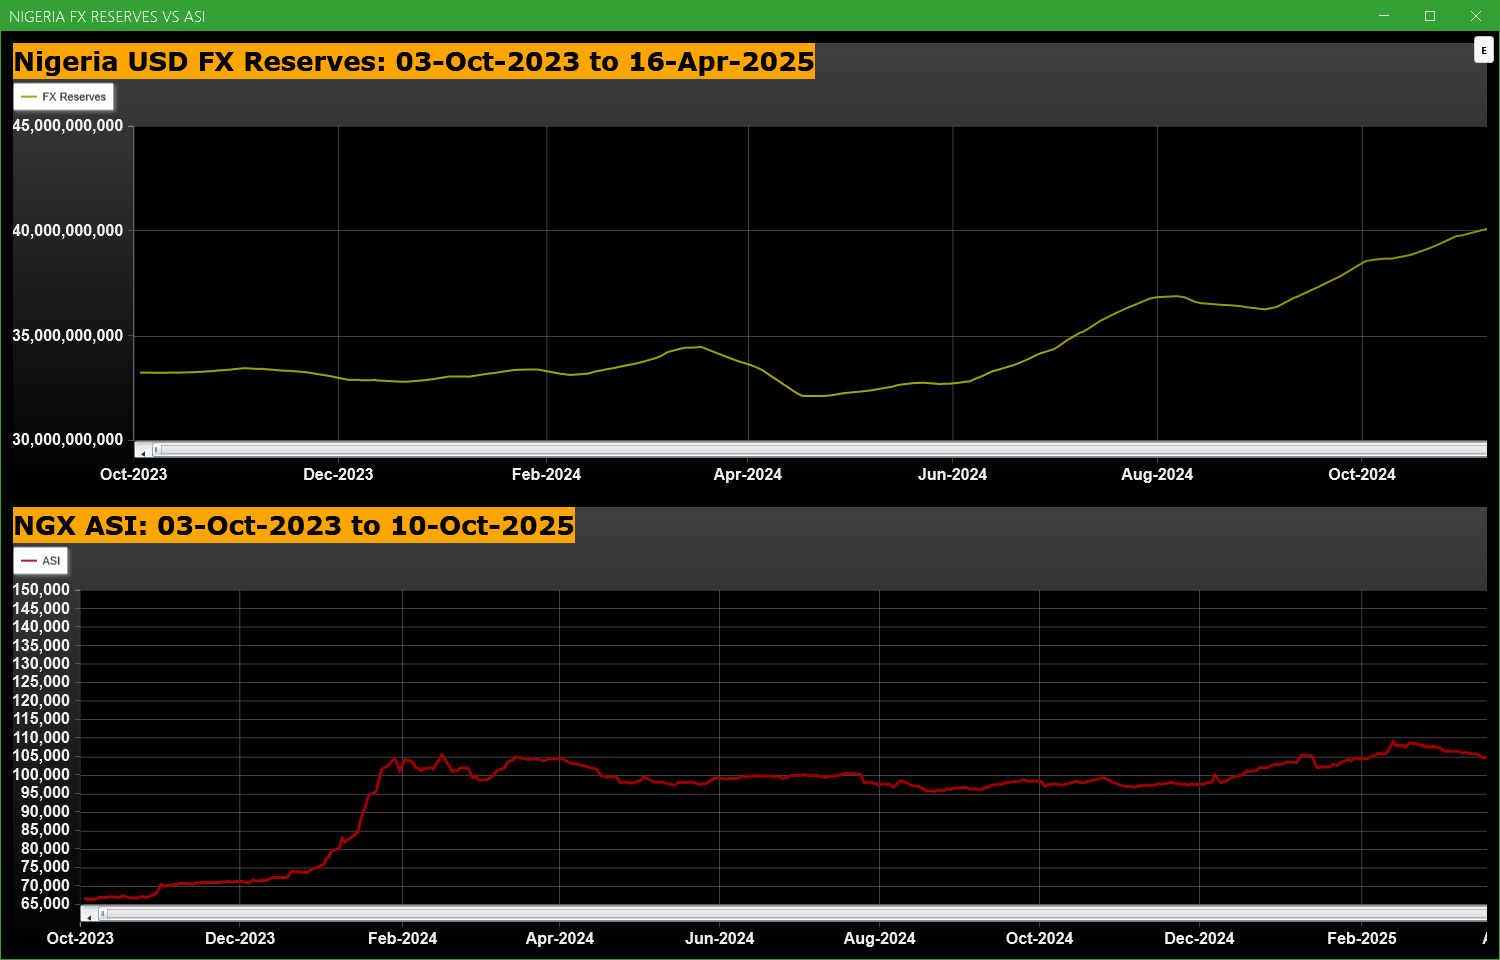
Economic Indicators - Nigeria FX Reserves Vs ASI Chart
Nigeria FX Reserves are assets held on reserve by CBN in foreign currencies. These reserves are used to back liabilities and influence monetary policy. Given the nature of the Nigeria economy, FX Reserves can appear to have an outsize influence on the economy and hence on the capital market. The chart below allows comparison of FX Reserves against the ASI to make investment decisions
For more detailed analysis,
- On InfoWARE Market Data Terminal <CI> <GO>
- On InfoWARE Finance Mobile App ( Android , iPhone & iPad and Windows 10) , "Research"
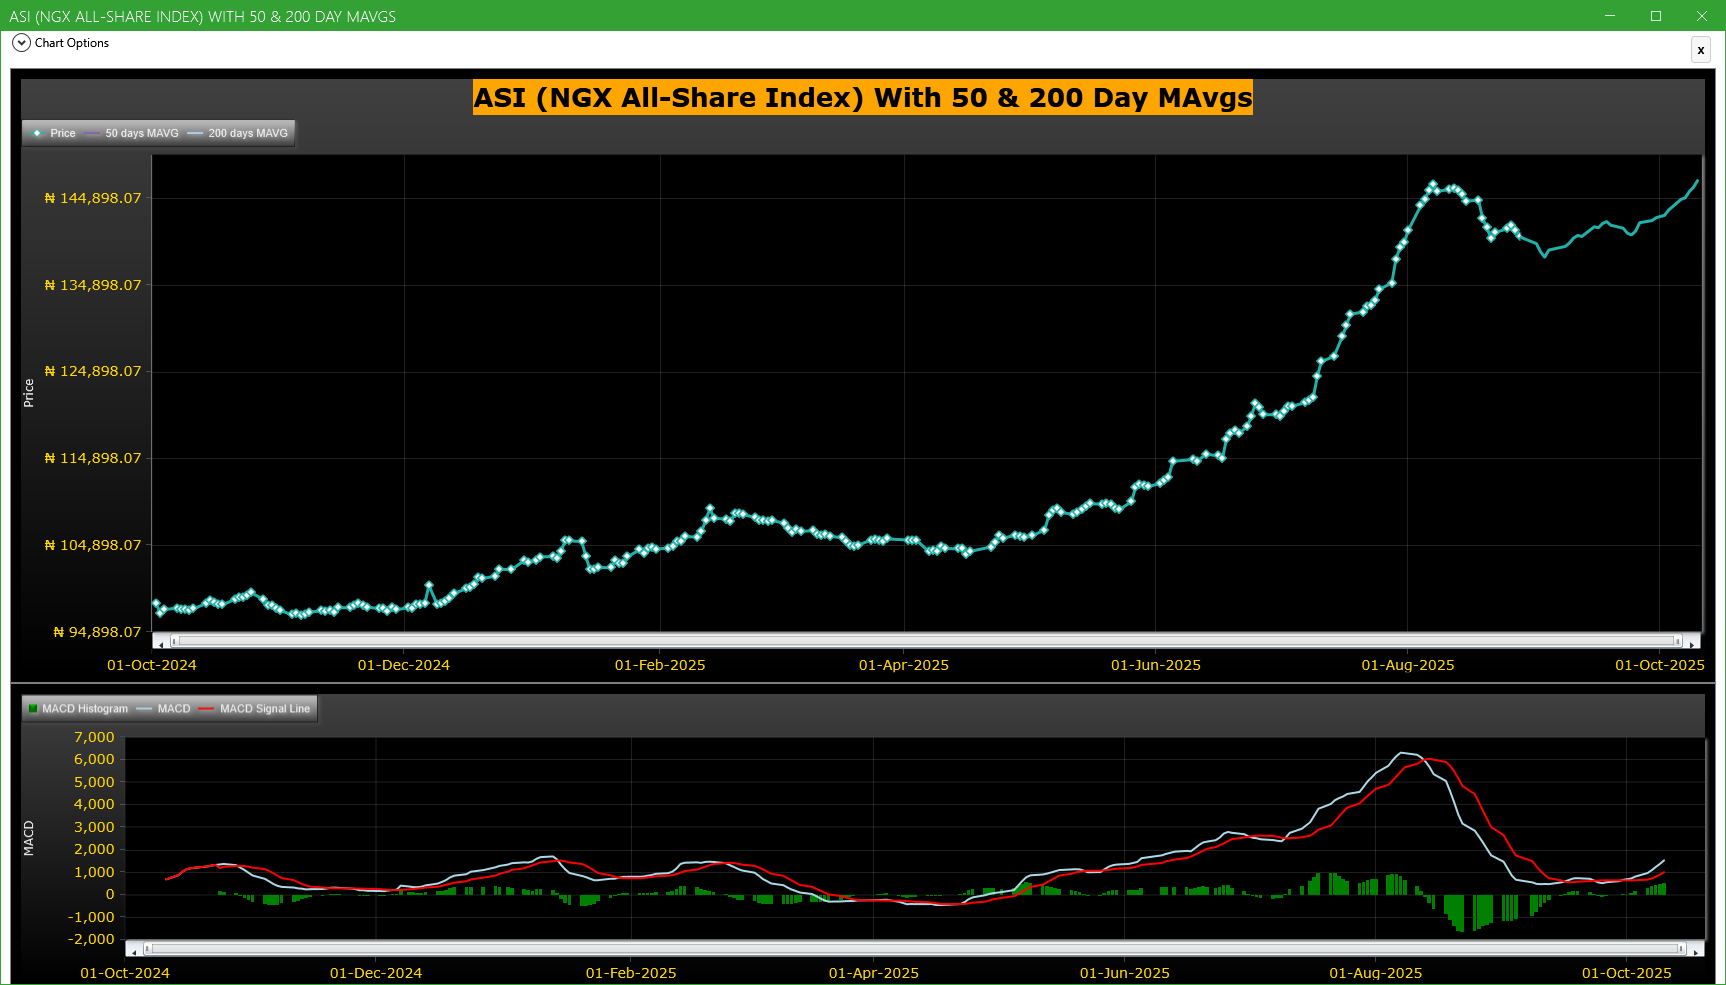
Market Trend - ASI (NGX All-Share-Index) With 50 & 200 Day MAvgs Chart
Technical traders typically use the 50 & 200 day moving averages to aid in choosing
where to enter or exit a position, which then causes these levels to act as strong
support or resistance. As a general guideline, if the price is above a moving average,
the trend is up. If the price is below a moving average, the trend is down.
It is important to note that critics of technical analysis say that moving averages act
as support and resistance because so many traders use these indicators to inform their
trading decisions. Also moving averages tend to work quite well in strong trending conditions
but poorly in choppy or ranging conditions.
Trading Strategies: Crossovers
Crossovers are one of the main moving average strategies. The first type is a price crossover,
which is when the price crosses above or below a moving average to signal a potential change
in trend. Another strategy is to apply two moving averages to a chart: one longer and one
shorter. When the shorter-term MA crosses above the longer-term MA, it is a buy signal, as
it indicates that the trend is shifting up. This is known as a golden cross. Meanwhile, when
the shorter-term MA crosses below the longer-term MA, it is a sell signal, as it indicates that
the trend is shifting down. This is known as a dead/death cross
For more detailed analysis,
- On InfoWARE Market Data Terminal <CI> <GO>
- On InfoWARE Finance Mobile App ( Android , iPhone & iPad and Windows 10) , "Research"
Unusual Volume: Volume traded is more than double the 90 day moving average (All exchanges; ASI & ASem). For more detailed analysis,
- On InfoWARE Market Data Terminal <UV> <GO>
- On InfoWARE Finance Mobile App ( Android , iPhone & iPad and Windows 10)
| Symbol | Name | Volume | 90DAvgVol | %VolChg | Price | LClose | %Chg | Trades | Value |
|---|---|---|---|---|---|---|---|---|---|
| CHAMS | CHAMS PLC | 38.45M | 17.55M | 119.12 | 4.30 | 4.29 | 0.23 | 599 | 169.81M |
| LIVINGTRUST | LIVINGTRUST MORTGAGE BANK PLC | 12.23M | 445.17K | 2,647.73 | 5.20 | 5.35 | -2.80 | 17 | 59.01M |
| MEYER | MEYER PLC. | 979.81K | 245.74K | 298.71 | 15.10 | 16.75 | -9.85 | 20 | 14.80M |
| ETERNA | ETERNA PLC. | 878.27K | 396.84K | 121.32 | 39.70 | 41.50 | -4.34 | 111 | 33.50M |
| UHOMREIT | UNION HOMES REAL ESTATE INVESTMENT TRUST (REIT) | 317.32K | 116.85K | 171.56 | 51.85 | 57.60 | -9.98 | 38 | 16.48M |
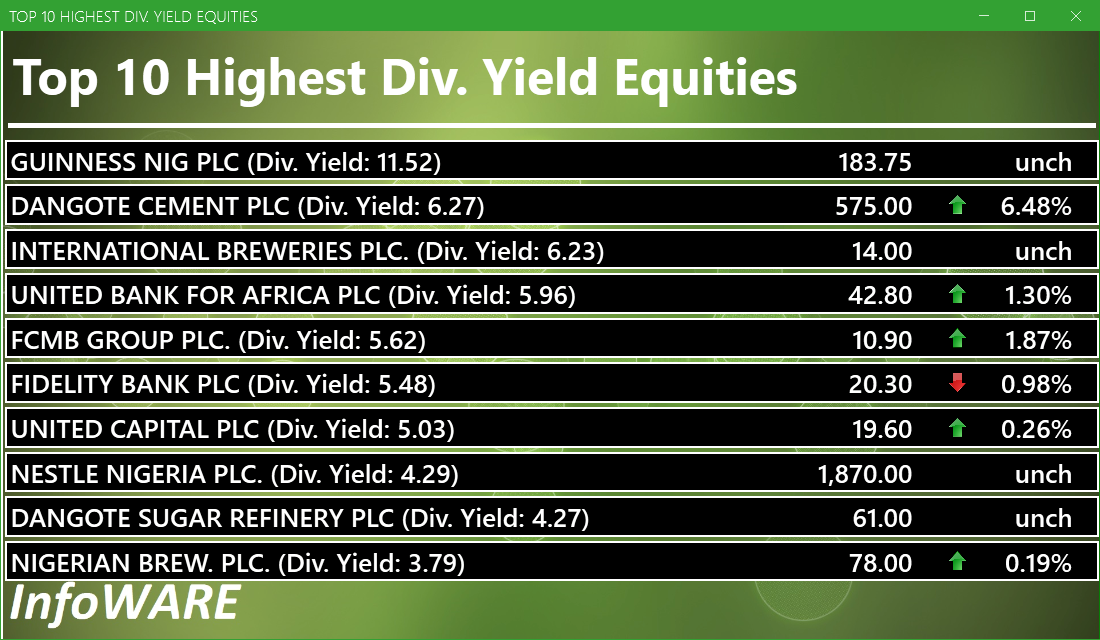
Investment Insights - High Div. Stocks
Dividend stocks distribute a portion of the company earnings to investors on a regular basis and they can a great choice for investors looking for regular income. As an investment or trading strategy, high dividend yield equities provide annual cash payments as against mostly capital gains in the price of a stock. The list in the table below represent the highest dividend paying stocks from the list of the most liquid stocks in the NSE top 30.
For more detailed analysis,
- On InfoWARE Market Data Terminal <HYIELD> <GO>
- On InfoWARE Finance Mobile App ( Android , iPhone & iPad and Windows 10) , "Research"
Investment Insights - Stocks outperforming the ASI but with approximately the same risk
These list of stocks represent equities that are less risky than the ASI but doing better than the ASI (All Shares Index) using the YTD (Year to Date) returns as the measure. The risk is measured by Beta. Beta is an assessment of a stock's tendency to undergo price changes, (its volatility), as well as its potential returns compared to the ASI. It is expressed as a ratio, where a score of 1 represents performance comparable to the ASI, and returns above or below the market may receive scores greater or lower than 1.
For a full list of both positively and negatively corelated stocks visit InfoWARE Market Data Terminal
- On InfoWARE Market Data Terminal <BANL> <GO>
- On InfoWARE Finance Mobile App ( Android , iPhone & iPad and Windows 10)
| Symbol | DivYield | PE | EPS | Beta | %ChgYTD | ASIYTDReturn | BetaDiff |
|---|---|---|---|---|---|---|---|
| HONYFLOUR | 1.40 | 16.28 | 0.31 | 0.99 | 232.37 | 42.46 | 0.01 |
| CAVERTON | 5.52 | 1.15 | 1.57 | 0.98 | 171.76 | 42.46 | 0.02 |
| ROYALEX | 7.81 | 0.00 | 0.00 | 0.96 | 96.36 | 42.46 | 0.04 |
| CORNERST | 5.28 | 8.62 | 0.35 | 0.93 | 56.82 | 42.46 | 0.07 |
| DEAPCAP | 13.76 | 188.84 | 0.01 | 0.89 | 50.00 | 42.46 | 0.11 |
| UNIVINSURE | 0.00 | 0.00 | 0.00 | 0.83 | 54.17 | 42.46 | 0.17 |
| FTNCOCOA | 1.60 | 0.00 | 0.00 | 0.79 | 208.51 | 42.46 | 0.21 |
| NB | 3.79 | 16.95 | 1.60 | 0.79 | 143.75 | 42.46 | 0.21 |
| MAYBAKER | 3.75 | 58.94 | 0.14 | 0.78 | 84.04 | 42.46 | 0.22 |
| UNILEVER | 2.81 | 67.09 | 0.40 | 0.75 | 105.56 | 42.46 | 0.25 |
African Markets
| Name | LClose | Change | %Chg |
|---|---|---|---|
| BRVM Stock Exchange | 331.11 | 2.14 | 0.65 |
| Egyptian Exchange | 37,097.37 | 3.71 | 0.01 |
| Nairobi Securities Exchange | 173.75 | -2.54 | -1.44 |
| Tunis Stock Exchange | 12,298.61 | -23.41 | -0.19 |
Nigeria Market Indexes
| Symbol | LClose | %Chg | WTD% | MTD% | QTD% | YTD% | MktCap | Trades |
|---|---|---|---|---|---|---|---|---|
| ASI | 146,988.04 | 0.54 | 1.50 | 2.80 | 2.80 | 42.46 | 21,680 | |
| NGX30 | 5,362.52 | 0.57 | 1.59 | 2.77 | 2.77 | 40.57 | 11,894 | |
| NGXAFRBVI | 3,533.28 | -0.05 | -1.25 | -0.46 | -0.46 | 42.43 | 4,010 | |
| NGXAFRHDYI | 22,249.71 | 0.06 | 0.32 | -0.05 | -0.05 | 30.67 | 5,389 | |
| NGXASEM | 1,392.88 | 0.00 | -9.44 | -9.44 | -9.44 | -12.05 | 17 | |
| NGXBNK | 1,520.43 | -0.08 | -1.04 | 0.24 | 0.24 | 39.82 | 5,832 | |
| NGXCG | 4,157.03 | 0.09 | 0.43 | 2.62 | 2.62 | 46.93 | 10,438 | |
| NGXCNSMRGDS | 3,429.45 | 0.02 | 0.70 | 1.38 | 1.38 | 97.74 | 2,561 | |
| NGXCOMMDTY | 1,153.06 | -0.06 | -0.06 | 2.78 | 2.78 | 15.30 | 1,132 | |
| NGXGROWTH | 15,427.24 | -0.81 | 1.30 | 2.36 | 2.36 | 98.73 | 314 | |
| NGXINDUSTR | 5,292.32 | 2.84 | 4.22 | 4.43 | 4.43 | 48.18 | 1,986 | |
| NGXINS | 1,257.46 | -1.30 | 0.54 | 5.13 | 5.13 | 59.94 | 1,865 | |
| NGXLOTUSISLM | 12,355.16 | 1.02 | 2.66 | 4.08 | 4.08 | 77.32 | 4,237 | |
| NGXMAINBOARD | 7,084.48 | -0.16 | -0.30 | 0.56 | 0.56 | 41.58 | 15,144 | |
| NGXMERIGRW | 10,213.07 | 0.35 | 0.66 | 3.13 | 3.13 | 56.56 | 2,822 | |
| NGXMERIVAL | 13,644.36 | 0.04 | 0.09 | 2.07 | 2.07 | 30.81 | 4,460 | |
| NGXOILGAS | 2,660.22 | -0.14 | -0.43 | 5.31 | 5.31 | -1.88 | 1,205 | |
| NGXPENBRD | 2,732.62 | 0.58 | 1.63 | 3.07 | 3.07 | 49.19 | 17,144 | |
| NGXPENSION | 6,883.66 | 0.02 | 0.57 | 2.17 | 2.17 | 51.82 | 13,159 | |
| NGXPREMIUM | 14,712.18 | 1.83 | 5.03 | 7.45 | 7.45 | 51.16 | 5,855 | |
| NGXSOVBND | 662.67 | 0.68 | 0.68 | 0.82 | 0.82 | 10.16 | 1 |
For more detailed analysis,
- On InfoWARE Market Data Terminal <MKTINS> <GO>
- On InfoWARE Finance Mobile App ( Android, iPhone & iPad and Windows 10) , "Market Indexes"
Find the topic interesting? Will like to comment? Contact Us at solutions@infowarelimited.com
Top News

InfoWARE AI Analyst Weekly Market Report: 10-Oct-2025
Chart Of The Day - ASI Chart Vs ASI Advance Decline Line (YTD) (10-Oct-2025 15:06:58.197)
InfoWARE AI Analyst Daily Market Report: 10-Oct-2025

[XNSA]>> NORRENBERGER MUTUAL FUNDS WEEKLY UPDATE
[MERGROWTH]>> DAILY INDICATIVE PRICES
[VETINDETF]>> DAILY INDICATIVE PRICES
[XNSA]>> NGX FIXED INCOME INDICATIVE PRICE LIST FOR OCT 10, 2025
[XNSA]>> CLOSING GONG CEREMONY IN COMMEMORATION OF WORLD MENTAL HEALTH DAY
[XNSA]>> CLOSING GONG CEREMONY BY ZENITH BANK PLC
[XNSA]>> CORDROS MILESTONE FUNDS' BID & OFFER PRICES
[XNSA]>> UPDATED- SAVE THE DATE: 29TH ANNUAL STOCKBROKERS CONFERENCE
[XNSA]>> AELP CAPACITY BUILDING & ASSDA FORUM
Chart Of The Day - ASI Chart Vs ASI Advance Decline Line (YTD) (09-Oct-2025 15:11:54.102)
InfoWARE AI Analyst Daily Market Report: 09-Oct-2025
[XNSA]>> CLOSING GONG CEREMONY IN COMMEMORATION OF WORLD MENTAL HEALTH DAY
[VETGOODS]>> DAILY INDICATIVE PRICES
[XNSA]>> RESIGNATION OF MANAGING DIRECTOR (AVA SECURITIES LIMITED)
[XNSA]>> NGX FIXED INCOME INDICATIVE PRICE LIST FOR OCT 09, 2025
[XNSA]>> CLOSING GONG CEREMONY BY ZENITH BANK PLC
[XNSA]>> UPDATED- SAVE THE DATE: 29TH ANNUAL STOCKBROKERS CONFERENCE
[XNSA]>> CIRCULAR TO TRADING LICENSE HOLDERS
[XNSA]>> AELP CAPACITY BUILDING & ASSDA FORUM
[XNSA]>> CORDROS MILESTONE FUNDS' BID & OFFER PRICES
[STANBICETF30]>> DAILY INDICATIVE PRICES
InfoWARE AI Analyst Daily Market Report: 01-Jan-0001
Chart Of The Day - ASI Chart Vs ASI Advance Decline Line (YTD) (08-Oct-2025 15:06:38.730)
InfoWARE AI Analyst Daily Market Report: 08-Oct-2025
[XNSA]>> RESIGNATION OF A DIRECTOR (FIRST INTEGRATED CAPITAL MANAGEMENT LIMITED)
[VSPBONDETF]>> DAILY INDICATIVE PRICES
[XNSA]>> NGX FIXED INCOME INDICATIVE PRICE LIST FOR OCT 08, 2025
Get IDIA - the stock trading app for the modern investor
Solutions by Business
Product Suites
Company
Contacts
- 8th Floor,
- South Atlantic Petroleum Towers,
- 1 Adeola Odeku Street,
- Victoria Island,
- Lagos, Nigeria.
- Email: solutions@infowarelimited.com
Follow Us
 |
 |
 |
 |