


InfoWARE AI Analyst Daily Market Report: 04-Aug-2025 | InfoWARE Finance
Get IDIA - the stock trading app for the modern investor


InfoWARE AI Analyst Daily Market Report: 04-Aug-2025
(Source: InfoWARE Terminal, Date: 04-Aug-2025)
Dear Investor,
NGX Market Wrap – Monday, August 4, 2025
Market Highlights: The NGX All Share Index surged by 1.99% today, closing at 141,263.05, as robust buying sent a ripple across risk assets and ETF segments. The Year-To-Date (YTD) return stands tall at 39.63%, reflecting sustained enthusiasm even in the new quarter. Market turnover exploded by 239.37% (₦18.15B vs. ₦5.35B prior), on the back of unusually high trade volumes (up nearly threefold to 752.49M shares). Breadth remained strongly positive at 2.16x (54 advancers vs. 25 decliners), led by a dramatic 61.88% jump in VETIVA S & P Nigeria Sovereign Bond ETF (VSPBONDETF). However, the currency market offered little cheer, with the Naira sliding 0.03% to ₦1,531/$.
Significant Market Trends
- Breadth: A 2.16x advancer-decliner ratio signals robust risk-on appetite, especially with volume gains in 70 stocks.
- Turnover Spike: The leap in turnover (+239.37%) and volume highlights heavy institutional activity (64.41% of volume, 83.92% of value), centered on the financial sector.
- Unusual Volume:
- CONHALLPLC (+9.84%, 368.66% of 90-day avg vol), UNIVINSURE (+5.56%, 273.58% vol), VERITASKAP (+9.35%, 245.25% vol), and REGALINS (+5.95%, 252.10% vol) – all insurers under aggressive accumulation.
- ETF Swings: ETFs dominated both gainers (VSPBONDETF +61.88%) and losers (GREENWETF, -10.00%), hinting at active fund flows and possible asset allocation shifts.
Top Gainers & Losers (%Chg/%Chg)
| Stock | Chg% | Close | RSI | Technical Note |
|---|---|---|---|---|
| VETIVA S & P NIGERIA SOV. BOND ETF (VSPBONDETF) | +61.88 | 518.00 | 47.11 | Broke above 15DMA (Bullish), surging ETF flow |
| GREENWICH ASSET ETF (GREENWETF) | +10.00 | 320.65 | 60.72 | Strong bounce, but high volatility |
| UPDC PLC | +10.00 | 5.94 | 68.49 | Approaching RSI overbought zone |
| ROYAL EXCHANGE PLC (ROYALEX) | +10.00 | 1.65 | 61.15 | Momentum in small cap financials |
| LASACO ASSURANCE PLC | +10.00 | 2.86 | 36.72 | Moderate RSI, but strong % gain |
| ACADEMY PRESS PLC (ACADEMY) | -10.00 | 9.90 | 76.98 | RSI sharply overbought, possible exhaustion; on YTD Losers List too |
| TRANSCORP POWER (TRANSPOWER) | -10.00 | 288.00 | 40.23 | Bears in large-caps, flat momentum |
| JOHN HOLT PLC (JOHNHOLT) | -9.59 | 6.60 | 35.85 | Extending YTD losing streak |
| TOTAL NIGERIA PLC | -9.22 | 640.00 | 51.21 | Energy names under pressure |
| ECOBANK TRANSNAT. (ETI) | -9.21 | 34.00 | 72.21 | Broke below 15DMA, near overbought RSI |
Key Insights & Predictions
- Turnover Surge: +239% in turnover signals strong fresh institutional inflows, most visible across financial and insurance stocks. Historically, such spikes are often followed by a volatile consolidation window as positions are digested.
- Breadth Trends: The outsized number of gainers, in tandem with aggressive buying in ETFs and insurers, suggests risk acceptance across large and small caps.
- Unusual Volume: Insurers (CONHALLPLC, UNIVINSURE, VERITASKAP, REGALINS) all saw buying volume >2.5x the 90-day average—a possible start of a sector-wide rerating. Momentum plays should monitor these for sustained follow-through.
- YTD Winners: The overlap of VSPBONDETF and VERITASKAP in both today's and YTD top gainers lists reinforces their ongoing momentum. Caution: many YTD movers are crowd favorites and susceptible to sharp mean reversions if sentiment flips.
-
Bullish Momentum Table:
- VSPBONDETF, CHAMPION, ELLAHLAKES, CONHALLPLC, NAHCO—all closed above their 15DMA, indicating strong technical buying signals. Only UPDC approaches overbought RSI; most have room for further rally.
- Insurance sector dominates bullish signals (AIICO, WAPIC, CONHALLPLC, UNIVINSURE).
-
Bearish Momentum Table:
- ETI, CWG and MAYBAKER broke beneath 15DMA, indicating caution. Notably, ETI is on the day's losers and bearish technical list, amplifying its short-term downside risk.
- STANBICETF30 ETF and VFDGROUP also slipped, revealing profit taking in previously strong names.
Contrarian Signals
- CHAMPION BREWERIES (CHAMPION): RSI 54.4 (neutral), bullish MACD crossover, YTD -9.8%. Despite languishing performance, technicals suggest a potential reversal. Contrarians may consider early accumulation if sector support emerges.
- JOHNHOLT PLC: Strong negative YTD, on both today's and YTD losers, but MACD histogram turning slightly less negative; traders could watch for capitulation bottoming.
- ETI: High RSI, but price broke below 15DMA and was a top loser today. Mixed signals call for close monitoring.
Sector Heatmaps & Institutional/Retail Activity
| Sector | Trend | Leadership | Technical Strength |
|---|---|---|---|
| Insurance | Bullish | CONHALLPLC, AIICO, WAPIC, UNIVINSURE, VERITASKAP | Strong volume, multiple bullish crossovers |
| Banking | Mixed | FCMB (institutional), UBA, ZENITHBANK | Heavy trades but price fatigue in ETI, ACCESSCORP |
| Energy | Bearish | TOTAL, OANDO | Both on YTD and daily loser lists, profit-taking evident |
| ETF | Volatile/Bullish | VSPBONDETF, STANBICETF30 | ETFs among largest movers, asset allocation shifts |
Dividend-Beta Matrix (Defensive Play Radar)
| Stock | Div. Yield (%) | Beta | Interpretation |
|---|---|---|---|
| AIICO | 4.13 | 1.33 | Attractive yield but higher Beta, not for risk-averse |
| CONHALLPLC | 2.08 | 0.96 | Mildly defensive; strong volume confirms safe-haven buying |
| AFRIPRUD | 1.27 | 0.64 | Low Beta, above-market yield – classic defensive profile |
- Note: High-yield, low-beta names with bullish signals (e.g., CONHALLPLC) should attract defensive flows, especially in uncertain conditions.
Institutional Clustering Alerts
- FCMB: Top institutional trade name (8.89% by volume), with sustained buying. ZENITHBANK also shows high institutional flows (20.17% of trade value).
- MTNN remains a favorite among both retail and institutional, but institutional trades mostly dominate value (₦561.5M institutional vs. ₦154.2M retail).
- Trade value and volume skewed toward financials; institutions consolidating positions in leading bank and insurance stocks.
High Dividend Yield in Bullish/Bearish Tables
- AIICO: 4.13% yield, part of bullish momentum cross; higher beta means strong upside potential but more volatility.
- CONHALLPLC (2.08% yield) also featured; accumulating in risk-off environments.
- No high-dividend names on bearish table—signaling current defensive appetite supports such stocks.
Actionable Takeaways for Traders
- Opportunities: Consider scaling into insurance leaders with bullish crossovers and unusual volumes (CONHALLPLC, UNIVINSURE, VERITASKAP, AIICO).
- Caution: YTD favorites (VSPBONDETF, VERITASKAP, UACN) may soon face profit-taking; rising RSI on many suggests trail stops to lock in gains.
- Monitor: Names with both high institutional flows and positive technicals (FCMB, ZENITHBANK) often foreshadow sector-wide rallies.
- Contrarian Play: CHAMPION and ETI—keep on radar as both sport mixed signals and could snap back on short covering.
- Watch ETFs: Surging flows may continue as asset allocators move capital rapidly in/out of sectors—intraday reversals possible.
YTD Top 5 Gainers & Losers
| Gainers | YTD % | Losers | YTD % |
|---|---|---|---|
| UACN | +194.69 | JOHNHOLT | -15.28 |
| VERITASKAP | +2.01 | ABBEYBDS | -75.67 |
| WEMABANK | +171.43 | LEARN AFRICA | -26.67 |
| FCMB | +25.40 | CAVERTON | -168.63 |
| CUSTODIAN | +128.95 | INTENEGINS | -14.97 |
Weekly Trend Recap (Prior Week)
Last week was characterized by moderate oscillation as investors weighed Q2 earnings and macro risk. The ASI posted a net gain, but sector rotation was evident—money flowed out of late-cyclical names into defensives like insurance and select financials. ETF activity picked up steam toward week's end, laying the groundwork for today's explosive flows.
Market Activity & Trades Summaries: Institutional vs Retail Patterns
-
Institutional Investors: Accounted for only 39.7% of trades but a dominant 64.4% of volume and a massive 83.92% of value.
- Focus: Large caps— FCMB, ZENITHBANK, ACCESSCORP, MTNN, UBA all feature as top institutional trades. Heavy presence here often signals intermediate trend recognition.
-
Retail Investors: Contribute 60.3% of trade count, but just 35.6% of volume and 16% of value—highlighting small lot trading.
- Favorites: MTNN leads by deal count, followed by ACCESSCORP, UBA, DANGSUGAR, ZENITHBANK—indicative of speculative churn and momentum chasing.
- Correlation: Institutional clusters prime early sector rallies (FCMB, ZENITHBANK), while retail follows momentum cues (AIICO, VERITASKAP, DANGSUGAR). Similar symbols across both (e.g., MTNN, ZENITHBANK, ACCESSCORP) reinforce conviction moves.
- Hidden Insight: Watch for a switch in institutional flows: if they begin selling top retail favorites (especially insurance), reversal risk rises.
Hidden Insights for Competitive Edge:
- Insurers sweep both volume and technical breakouts—expect continued rotation into this sector barring external shock.
- YTD momentum leaders attract both institutional and retail activity, but high RSI readings suggest some fatigue—trail stops recommended.
- ETF volatility is a double-edged sword: sharp moves may offer tactical entries/exits for nimble funds.
- Dividend+Defensive stocks (low beta, high yield) accumulating volume in risk-off mini-windows; best for cautious portfolios.
- Stocks like CHAMPION and ETI with conflicting technicals warrant close monitoring for snapback rallies or deeper corrections.
Remember: Aggressive sector flows and technical breakouts offer opportunity, but increased volatility and institutional-rhythm trading call for disciplined risk management.
|
Top ASI Gainers Over Last 5 Trading Days
|
Top ASI Losers Over Last 5 Trading Days
|
For more detailed analysis, on InfoWARE Market Data Terminal <NSEPERF> <GO>
On InfoWARE Finance Mobile App (Android, iPhone & iPad, Windows Phone and Windows 8/10), "Top Gainers & Losers"
VETIVA S & P NIGERIA SOVEREIGN BOND ETF (VSPBONDETF) topped the advancers list closing at N518.00 with a gain of 61.88% followed by GREENWICH ASSET ETF (GREENWETF) which closed at N320.65 with a gain of 10.00%.
On the flip side ACADEMY PRESS PLC. (ACADEMY) and TRANSCORP POWER PLC (TRANSPOWER) topped the decliners log with a loss of -10.00% at a close of N9.90, and -10.00% to close the day at N288.00 respectively.
| Symbol | LClose | %Chg |
|---|---|---|
| VSPBONDETF | 518.00 | 61.88 |
| GREENWETF | 320.65 | 10.00 |
| LASACO | 2.86 | 10.00 |
| ROYALEX | 1.65 | 10.00 |
| UPDC | 5.94 | 10.00 |
| Symbol | LClose | %Chg |
|---|---|---|
| ACADEMY | 9.90 | -10.00 |
| TRANSPOWER | 288.00 | -10.00 |
| JOHNHOLT | 6.60 | -9.59 |
| TOTAL | 640.00 | -9.22 |
| ETI | 34.00 | -9.21 |
For more detailed analysis,
- On InfoWARE Market Data Terminal <TOPG> <GO>
- On InfoWARE Finance Mobile App ( Android, iPhone & iPad and Windows 10) , "Top Gainers & Losers"
Currency Market
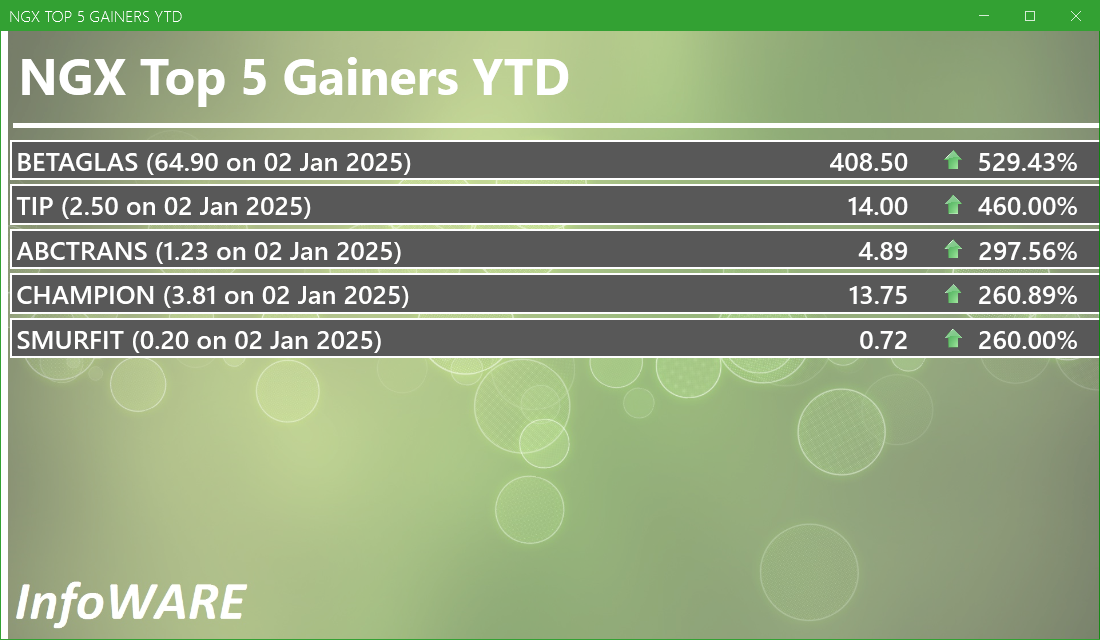
In the currency market, the Naira fell 0.03%(-0.50) against the Dollar to settle at 1 to 1Investment Insights - Top 5 Gainers YTD
These stocks are the best performers whose price has risen faster than the market as a whole with the best returns year to date. Momentum investors believe that stocks that have outperformed the market will often continue to do so because the factors that caused them to outperform will not suddenly disappear. In addition, other investors seeking to benefit from the stock’s outperformance will often purchase the stock, further bidding its price higher and pushing the stock higher still
For more detailed analysis,
- On InfoWARE Market Data Terminal <T5YTD2> <GO>
- On InfoWARE Finance Mobile App ( Android , iPhone & iPad and Windows 10) , "Research"
NSE: Bull Signal - Price crossed above 15 Day MA
This signal implies these stocks are under buying pressure and the price might continue to rise and therefore positions should be monitored closely. Further suggested analysis include looking at the overall market (ASI) to see if the uptrend is market wide, sector wide or specific to the stock. Portfolio managers tend to use this as a signal to do more research to add to their positions or lock in some profits. Typically further analysis should be done using commands like PC and RV on the InfoWARE Market Data Terminal. Another command is ALERTS to set price triggers for possible exit or entry as necessary
For more detailed analysis,
- On InfoWARE Market Data Terminal <NSEPERF> <GO>
- On InfoWARE Finance Mobile App ( Android , iPhone & iPad and Windows 10) , "Top Gainers & Losers"
| Symbol | Price | %Chg | 15DMA | PE | EPS | DivY | MktCap | Vol | Trades | Value | LstTradeTime |
|---|---|---|---|---|---|---|---|---|---|---|---|
| VSPBONDETF | 518.00 | 38.22 | 389.40 | 0.00 | 0.00 | 389.00 | 4.00 | 201.50K | 04-Aug-2025 14:35:48.550 | ||
| CHAMPION | 13.75 | 9.02 | 12.83 | 412.83 | 0.01 | 0.41 | 107.66B | 1.65M | 169.00 | 21.97M | 04-Aug-2025 14:30:41.327 |
| ELLAHLAKES | 10.65 | 9.01 | 9.99 | 0.00 | 0.00 | 0.00 | 21.30B | 26.64M | 630.00 | 277.58M | 04-Aug-2025 14:35:47.030 |
| CONHALLPLC | 3.46 | 8.96 | 3.22 | 69.63 | 0.03 | 2.08 | 37.04B | 37.47M | 332.00 | 125.87M | 04-Aug-2025 14:35:46.960 |
| NAHCO | 108.90 | 8.82 | 107.06 | 92.98 | 0.41 | 6.66 | 212.25B | 3.32M | 317.00 | 354.95M | 04-Aug-2025 14:30:47.687 |
| AIICO | 2.40 | 8.75 | 2.23 | 2.01 | 0.60 | 4.13 | 87.85B | 40.15M | 438.00 | 94.29M | 04-Aug-2025 14:35:46.793 |
| WAPIC | 2.48 | 7.26 | 2.40 | 72.55 | 0.02 | 2.56 | 59.50B | 1.77M | 94.00 | 4.26M | 04-Aug-2025 14:30:55.117 |
| JULI | 10.00 | 7.00 | 9.41 | 0.00 | 0.00 | 0.68 | 2.00B | 621.43K | 12.00 | 5.72M | 04-Aug-2025 14:30:55.303 |
| NGXASEM | 1,553.39 | 6.89 | 1,463.71 | 1.55 | 0.34 | 0.00 | 0.00 | 621.43K | 12.00 | 5.72M | 04-Aug-2025 14:33:08.547 |
| UNIVINSURE | 0.76 | 5.26 | 0.75 | 0.00 | 0.00 | 0.00 | 12.16B | 82.51M | 184.00 | 61.68M | 04-Aug-2025 14:30:54.500 |
| INTBREW | 14.50 | 4.83 | 14.13 | 0.00 | 0.00 | 6.23 | 389.50B | 3.62M | 165.00 | 52.10M | 04-Aug-2025 14:30:44.363 |
| NGXINS | 917.43 | 3.32 | 890.78 | 10.41 | 2.09 | 0.00 | 0.00 | 219.46M | 1,992.00 | 354.23M | 04-Aug-2025 14:33:09.390 |
| FGS202890 | 90.00 | 0.00 | 90.00 | 0.00 | 0.00 | 0.00 | 0.00 | 0.00 | 04-Aug-2025 14:33:03.670 |
NSE: BEAR Signal - Price crossed below 15 Day MA
This signal implies these stocks are under selling pressure and the price might continue to slide and therefore positions should be monitored closely. Further suggested analysis include looking at the overall market (ASI) to see if the downtrend is market wide, sector wide or specific to the stock. If the overal market trend is upwards, then since these stocks are heading in the opposite direction, then further analysis should be done using commands like PC and RV on the InfoWARE Market Data Terminal. Another command is ALERTS to set price triggers for possible exit is necessar
For more detailed analysis,
- On InfoWARE Market Data Terminal <BEARM> <GO>
- On InfoWARE Finance Mobile App ( Android , iPhone & iPad and Windows 10)
| Symbol | Price | %Chg | 15DMA | PE | EPS | DivY | MktCap | Vol | Trades | Value | LstTradeTime |
|---|---|---|---|---|---|---|---|---|---|---|---|
| FG202031S1 | 108.75 | 0.00 | 108.77 | 0.00 | 0.00 | 0.00 | 0.00 | 0.00 | 04-Aug-2025 14:32:41.577 | ||
| ARADEL | 514.00 | -1.17 | 515.47 | 0.00 | 0.00 | 1.72 | 2,233.25B | 1.22M | 689.00 | 632.00M | 04-Aug-2025 14:30:40.400 |
| NGXCOMMDTY | 1,074.03 | -2.04 | 1,076.18 | 0.00 | 0.00 | 04-Aug-2025 14:33:09.133 | |||||
| VFDGROUP | 13.40 | -3.73 | 13.80 | 0.00 | 0.00 | 0.00 | 0.00 | 5.92M | 395.00 | 79.97M | 04-Aug-2025 14:30:55.037 |
| MAYBAKER | 16.90 | -5.03 | 17.20 | 58.94 | 0.14 | 3.75 | 29.16B | 2.48M | 167.00 | 42.34M | 04-Aug-2025 14:30:46.217 |
| STANBICETF30 | 450.01 | -10.00 | 487.60 | 0.00 | 0.00 | 4.88K | 42.00 | 2.38M | 04-Aug-2025 14:35:48.460 | ||
| CWG | 17.00 | -10.00 | 17.35 | 0.00 | 0.00 | 2.46 | 42.92B | 5.62M | 323.00 | 97.28M | 04-Aug-2025 14:30:41.907 |
| ETI | 34.00 | -10.15 | 35.15 | 5.00 | 5.10 | 2.00 | 623.88B | 2.40M | 168.00 | 83.69M | 04-Aug-2025 14:30:42.747 |
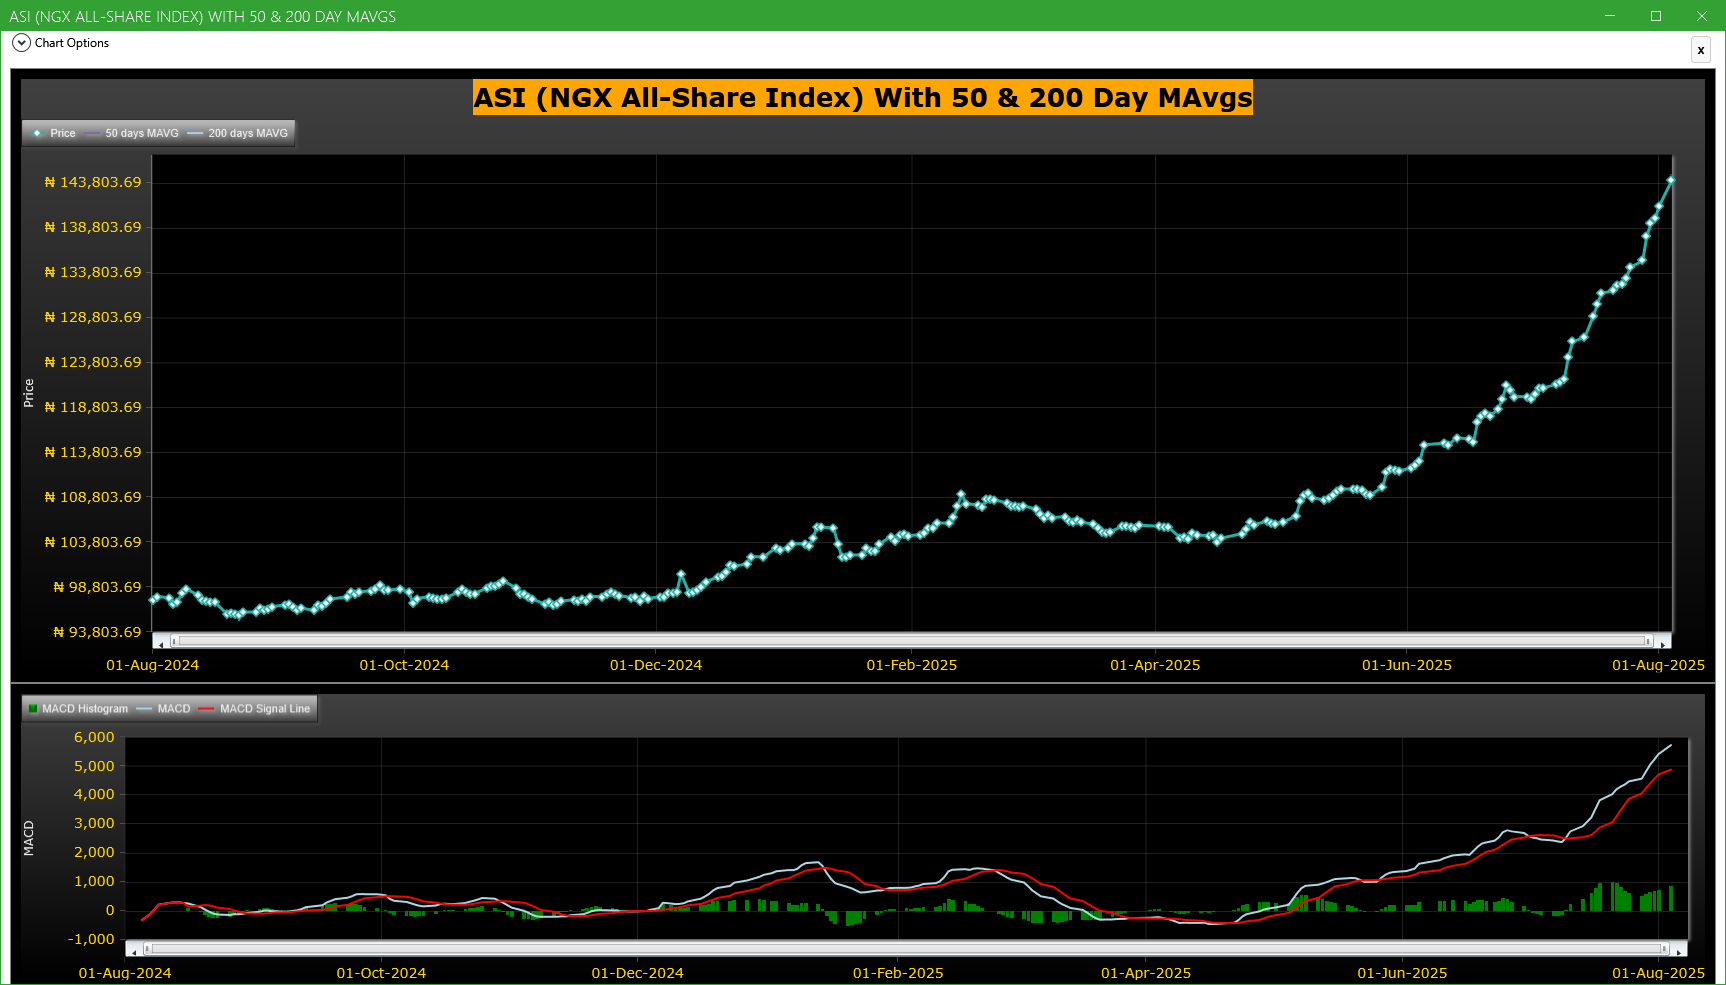
Market Trend - ASI (NGX All-Share-Index) With 50 & 200 Day MAvgs Chart
Technical traders typically use the 50 & 200 day moving averages to aid in choosing
where to enter or exit a position, which then causes these levels to act as strong
support or resistance. As a general guideline, if the price is above a moving average,
the trend is up. If the price is below a moving average, the trend is down.
It is important to note that critics of technical analysis say that moving averages act
as support and resistance because so many traders use these indicators to inform their
trading decisions. Also moving averages tend to work quite well in strong trending conditions
but poorly in choppy or ranging conditions.
Trading Strategies: Crossovers
Crossovers are one of the main moving average strategies. The first type is a price crossover,
which is when the price crosses above or below a moving average to signal a potential change
in trend. Another strategy is to apply two moving averages to a chart: one longer and one
shorter. When the shorter-term MA crosses above the longer-term MA, it is a buy signal, as
it indicates that the trend is shifting up. This is known as a golden cross. Meanwhile, when
the shorter-term MA crosses below the longer-term MA, it is a sell signal, as it indicates that
the trend is shifting down. This is known as a dead/death cross
For more detailed analysis,
- On InfoWARE Market Data Terminal <CI> <GO>
- On InfoWARE Finance Mobile App ( Android , iPhone & iPad and Windows 10) , "Research"
Unusual Volume: Volume traded is more than double the 90 day moving average (All exchanges; ASI & ASem). For more detailed analysis,
- On InfoWARE Market Data Terminal <UV> <GO>
- On InfoWARE Finance Mobile App ( Android , iPhone & iPad and Windows 10)
| Symbol | Name | Volume | 90DAvgVol | %VolChg | Price | LClose | %Chg | Trades | Value |
|---|---|---|---|---|---|---|---|---|---|
| UNIVINSURE | UNIVERSAL INSURANCE COMPANY PLC | 82.51M | 22.09M | 273.58 | 0.76 | 0.72 | 5.56 | 184 | 61.68M |
| VERITASKAP | VERITAS KAPITAL ASSURANCE PLC | 39.77M | 11.52M | 245.25 | 1.52 | 1.39 | 9.35 | 343 | 60.26M |
| CONHALLPLC | CONSOLIDATED HALLMARK INSURANCE PLC | 37.47M | 8.00M | 368.66 | 3.46 | 3.15 | 9.84 | 332 | 125.87M |
| REGALINS | REGENCY ALLIANCE INSURANCE COMPANY PLC | 25.48M | 7.24M | 252.10 | 0.89 | 0.84 | 5.95 | 109 | 22.40M |
| STERLINGNG | STERLING FINANCIAL HOLDINGS COMPANY PLC | 24.78M | 10.54M | 134.98 | 6.75 | 6.50 | 3.85 | 534 | 175.30M |
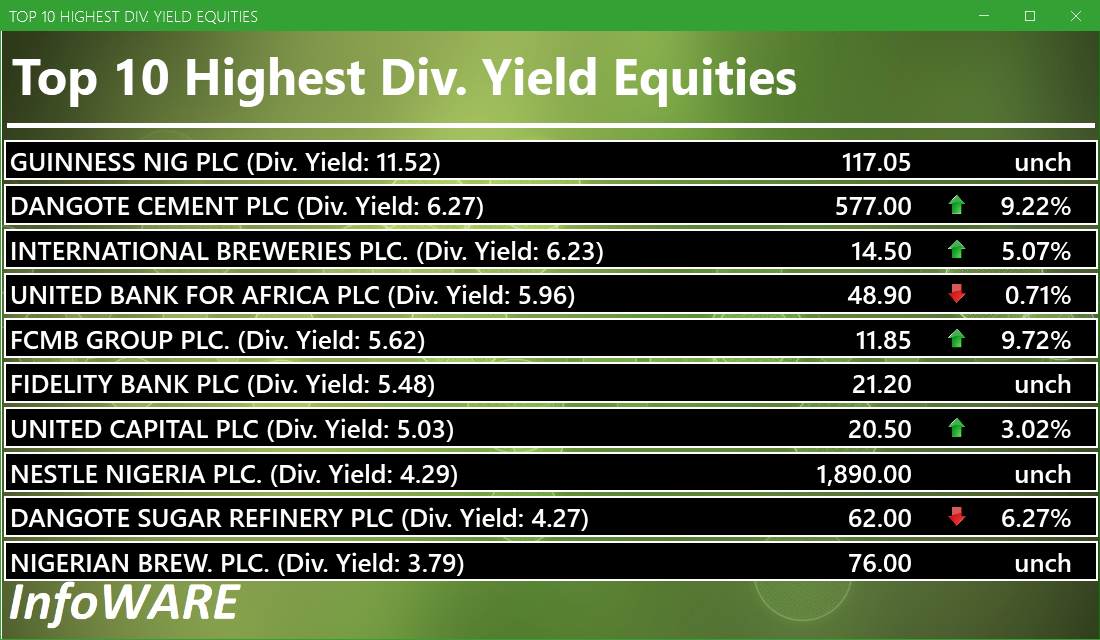
Investment Insights - High Div. Stocks
Dividend stocks distribute a portion of the company earnings to investors on a regular basis and they can a great choice for investors looking for regular income. As an investment or trading strategy, high dividend yield equities provide annual cash payments as against mostly capital gains in the price of a stock. The list in the table below represent the highest dividend paying stocks from the list of the most liquid stocks in the NSE top 30.
For more detailed analysis,
- On InfoWARE Market Data Terminal <HYIELD> <GO>
- On InfoWARE Finance Mobile App ( Android , iPhone & iPad and Windows 10) , "Research"
Investment Insights - Stocks outperforming the ASI but with approximately the same risk
These list of stocks represent equities that are less risky than the ASI but doing better than the ASI (All Shares Index) using the YTD (Year to Date) returns as the measure. The risk is measured by Beta. Beta is an assessment of a stock's tendency to undergo price changes, (its volatility), as well as its potential returns compared to the ASI. It is expressed as a ratio, where a score of 1 represents performance comparable to the ASI, and returns above or below the market may receive scores greater or lower than 1.
For a full list of both positively and negatively corelated stocks visit InfoWARE Market Data Terminal
- On InfoWARE Market Data Terminal <BANL> <GO>
- On InfoWARE Finance Mobile App ( Android , iPhone & iPad and Windows 10)
| Symbol | DivYield | PE | EPS | Beta | %ChgYTD | ASIYTDReturn | BetaDiff |
|---|---|---|---|---|---|---|---|
| HONYFLOUR | 1.40 | 16.28 | 0.31 | 0.99 | 254.05 | 39.63 | 0.01 |
| CAVERTON | 5.52 | 1.15 | 1.57 | 0.98 | 168.63 | 39.63 | 0.02 |
| ROYALEX | 7.81 | 0.00 | 0.00 | 0.96 | 50.00 | 39.63 | 0.04 |
| FTNCOCOA | 1.60 | 0.00 | 0.00 | 0.79 | 224.47 | 39.63 | 0.21 |
| NB | 3.79 | 16.95 | 1.60 | 0.79 | 137.50 | 39.63 | 0.21 |
| MAYBAKER | 3.75 | 58.94 | 0.14 | 0.78 | 79.79 | 39.63 | 0.22 |
| UNILEVER | 2.81 | 67.09 | 0.40 | 0.75 | 106.94 | 39.63 | 0.25 |
| VETGOODS | 0.00 | 0.71 | 106.40 | 39.63 | 0.29 | ||
| CUTIX | 6.52 | 8.81 | 0.26 | 0.70 | 54.15 | 39.63 | 0.30 |
| Ikejahotel | 0.94 | 51.55 | 0.16 | 0.70 | 65.99 | 39.63 | 0.30 |
African Markets
| Name | LClose | Change | %Chg |
|---|---|---|---|
| BRVM Stock Exchange | 313.10 | 2.21 | 0.71 |
| Botswana Stock Exchange | 10,498.75 | 0.00 | 0.00 |
| Egyptian Exchange | 34,198.00 | 338.59 | 1.00 |
| Ghana Stock Exchange | 6,994.45 | 2.10 | 0.03 |
| Johannesburg Stock Exchange | 97,744.15 | -778.33 | -0.79 |
| Lusaka Stock Exchange | 21,290.87 | 250.38 | 1.19 |
| Casablanca Stock Exchange | 19,570.63 | -64.80 | -0.33 |
| Malawi Stock Exchange | 393,087.82 | 6,798.69 | 1.76 |
| Nigeria Stock Exchange | 141,263.05 | 1,398.64 | 1.00 |
| Nairobi Securities Exchange | 158.95 | -1.27 | -0.79 |
| Namibian Stock Exchange | 1,752.44 | -30.31 | -1.70 |
| Tunis Stock Exchange | 11,851.41 | 16.57 | 0.14 |
| Uganda Securities Exchange | 1,364.93 | 7.47 | 0.55 |
Nigeria Market Indexes
| Symbol | LClose | %Chg | WTD% | MTD% | QTD% | YTD% | MktCap | Trades |
|---|---|---|---|---|---|---|---|---|
| ASI | 144,071.76 | 1.99 | 0.00 | 1.99 | 20.32 | 39.63 | 33,598 | |
| NGX30 | 5,288.95 | 1.99 | 0.00 | 1.99 | 11.97 | 38.64 | 18,957 | |
| NGXAFRBVI | 3,816.28 | 0.06 | 0.00 | 0.06 | 7.70 | 53.83 | 6,372 | |
| NGXAFRHDYI | 23,405.59 | 0.78 | 0.00 | 0.78 | 11.91 | 37.46 | 8,481 | |
| NGXASEM | 1,553.39 | 7.40 | 0.00 | 7.40 | -2.62 | -1.91 | 12 | |
| NGXBNK | 1,620.27 | 0.08 | 0.00 | 0.08 | 7.25 | 49.00 | 7,971 | |
| NGXCG | 4,316.50 | 0.35 | 0.00 | 0.35 | 25.53 | 52.57 | 17,285 | |
| NGXCNSMRGDS | 3,123.27 | 4.93 | 0.00 | 4.93 | -9.96 | 80.08 | 4,815 | |
| NGXCOMMDTY | 1,074.03 | -1.99 | 0.00 | -1.99 | 2.56 | 7.40 | ||
| NGXGROWTH | 11,654.27 | 5.30 | 0.00 | 5.30 | 22.55 | 50.13 | 385 | |
| NGXINDUSTR | 5,344.77 | 5.72 | 0.00 | 5.72 | 51.72 | 49.65 | 3,233 | |
| NGXINS | 917.43 | 3.44 | 0.00 | 3.44 | 24.21 | 16.69 | 1,992 | |
| NGXLOTUSISLM | 11,982.91 | 3.07 | 0.00 | 3.07 | 25.15 | 71.97 | 6,759 | |
| NGXMAINBOARD | 6,750.53 | 1.68 | 0.00 | 1.68 | 14.44 | 34.90 | 24,532 | |
| NGXMERIGRW | 10,564.92 | 2.48 | 0.00 | 2.48 | 9.46 | 61.96 | 4,685 | |
| NGXMERIVAL | 14,493.85 | -0.22 | 0.00 | -0.22 | 21.31 | 38.96 | 10,307 | |
| NGXOILGAS | 2,409.40 | -1.12 | 0.00 | -1.12 | 0.72 | -11.13 | 495 | |
| NGXPENBRD | 2,658.22 | 2.00 | 0.00 | 2.00 | 15.61 | 45.13 | 28,318 | |
| NGXPENSION | 6,949.63 | 0.51 | 0.00 | 0.51 | 9.36 | 53.28 | 21,609 | |
| NGXPREMIUM | 15,136.93 | 2.51 | 0.00 | 2.51 | 31.97 | 55.52 | 8,681 | |
| NGXSOVBND | 672.87 | 0.00 | 0.00 | 0.00 | 2.96 | 11.86 | 0 |
For more detailed analysis,
- On InfoWARE Market Data Terminal <MKTINS> <GO>
- On InfoWARE Finance Mobile App ( Android, iPhone & iPad and Windows 10) , "Market Indexes"
Find the topic interesting? Will like to comment? Contact Us at solutions@infowarelimited.com
Top News

Chart Of The Day - ASI Chart Vs ASI Advance Decline Line (YTD) (04-Aug-2025 15:11:04.157)
InfoWARE AI Analyst Daily Market Report: 04-Aug-2025

[ABBEYBDS]>>Corporate Disclosures-<ABBEY MORTGAGE BANK PLC>
[XNSA]>> EAAML MUTUAL FUNDS YIELDS AND PRICES
[XNSA]>> CIS ACADEMY TRAINING
[XNSA]>> CORDROS MILESTONE FUNDS' BID & OFFER PRICES
[XNSA]>> NGX FIXED INCOME INDICATIVE PRICE LIST FOR AUG 04, 2025
[VSPBONDETF]>> DAILY INDICATIVE PRICES
[CILEASING]>>Notice of Meeting -<C AND I LEASING PLC.>
[MCNICHOLS]>>Notice of Meeting -<MCNICHOLS CONSOLIDATED PLC>
[MERVALUE]>> DAILY INDICATIVE PRICES
[STANBICETF30]>> DAILY INDICATIVE PRICES
InfoWARE AI Analyst Weekly Market Report: 01-Aug-2025
Chart Of The Day - ASI Chart Vs ASI Advance Decline Line (YTD) (01-Aug-2025 15:07:02.003)
InfoWARE AI Analyst Daily Market Report: 01-Aug-2025
[AIRTELAFRI]>>Corporate Disclosures-<Airtel Africa Plc>
[XNSA]>> CORDROS MILESTONE FUNDS' BID & OFFER PRICES
[FIDSON]>>Corporate Disclosures-<FIDSON HEALTHCARE PLC>
[MERVALUE]>> DAILY INDICATIVE PRICES
[OANDO]>>Corporate Disclosures-<OANDO PLC>
[AIICO]>>Corporate Disclosures-<AIICO INSURANCE PLC.>
[XNSA]>> CIS ACADEMY TRAINING
[UCAP]>>Corporate Disclosures-<UNITED CAPITAL PLC>
[XNSA]>> LISTING OF 11,500,000 ORDINARY SHARES OF SEPLAT ENERGY PLC'S EMPLOYEE S
[STAMBICETF30]>> DAILY INDICATIVE PRICES
[AIRTELAFRI]>>Corporate Disclosures-<Airtel Africa Plc>
Chart Of The Day - ASI Chart Vs ASI Advance Decline Line (YTD) (31-Jul-2025 15:08:02.482)
InfoWARE AI Analyst Daily Market Report: 31-Jul-2025
[XNSA]>> OFF MARKET TRADE
[UNILEVER]>>Corporate Disclosures-<UNILEVER NIGERIA PLC.>
Get IDIA - the stock trading app for the modern investor
Solutions by Business
Product Suites
Company
Contacts
- 8th Floor,
- South Atlantic Petroleum Towers,
- 1 Adeola Odeku Street,
- Victoria Island,
- Lagos, Nigeria.
- Email: solutions@infowarelimited.com
Follow Us
 |
 |
 |
 |