


InfoWARE AI Analyst Daily Market Report: 01-Aug-2025 | InfoWARE Finance
Get IDIA - the stock trading app for the modern investor


InfoWARE AI Analyst Daily Market Report: 01-Aug-2025
(Source: InfoWARE Terminal, Date: 01-Aug-2025)
Dear Investor,
NGX Market Recap – Friday, August 1, 2025
The NGX All Share Index (ASI) staged a strong rebound today, closing up +1.00% at 139,863.52. Year-to-date, the ASI remains robust, delivering an impressive +36.91%. Volume surged as 256.03 million shares changed hands, a significant jump versus the prior day. Market turnover soared by +60.22% to 5.35B Naira, signifying renewed interest—particularly from institutional investors, who accounted for an outsized share of trade value. Despite this buoyancy, market breadth was narrowly negative at 0.95x, with decliners (40) just surpassing advancers (38).
ETF volatility defined the leaderboard: GREENWETF led gainers, while MERGROWTH (ironically, also among top five YTD performers) was the largest daily loser. Large caps like UACN and BUA CEMENT posted high-single digit gains, while financials like FCMB stood out for unusually high volumes.
Key Market Trends & Insights
- Market Breadth: Slight negative skew (Advancers: 38; Decliners: 40). Despite the index gain, more stocks fell than rose—suggesting breadth is not backing headline bullishness.
- Turnover: +60.22% boost in traded value (to 5.35B NGN) signals strong institutional participation. Volume traded jumped to 256.03M shares (~2.7x yesterday's).
- Sector Flows: Large portions of value traded, especially in Banking (e.g., FCMB, UBA, GTCO, ZENITHBANK), underscored by outsized volumes and trade value clustering.
- Top Gainers:
- GREENWETF +10.00% (Closed: 291.50) – ETF bounce with RSI moderately strong (52.29).
- UACN +9.96% (Closed: 88.30) – Explosive run with extreme RSI (99.55) and sustained MACD bullishness—also the best YTD gainer (+167.98% YTD).
- BUACEMENT +9.63% (Closed: 148.00) – Bullish MACD and RSI (89.33) confirm strong buying.
- VERITASKAP +9.45% (Closed: 1.39) – Notable for unusual volume (277% of avg), bullish price cross above 15DMA (1.20).
- Top Losers:
- MERGROWTH -10.00% (Closed: 665.50) – YTD top gainer, but pressure mounting (RSI: 75.65 → 97.00 prev. day, possible overbought correction).
- DANGSUGAR -10.00% (Closed: 66.15) – Sharp drop with high RSI (87.04)—possible exhaustion selloff.
- OANDO -10.00% (Closed: 53.10) – Bearish cross below 15DMA signals. YTD: -19.30%.
- ABBEYBDS -9.76% (Closed: 5.27) – YTD deep loser (-75.67%), low RSI (29.95) implies possible oversold/reversal risk for shorters.
- Unusual Volume:
- FCMB – +553% above 90d average, up on the day; points to significant accumulation.
- VERITASKAP – Volume up +276% and strong price move (+9.45%).
- STERLINGNG – Volume spike +501%, yet fell -7.14% (watch for forced sellers or blow-off).
Momentum & Technical Insights
-
Bullish Momentum (Price Cross Above 15DMA): LEGENDINT, PRESTIGE, REGALINS, FIRSTHOLDCO, FIDELITYBK.
- FIRSTHOLDCO and FIDELITYBK show Banking sector's resilience; keep an eye for follow-through.
- REGALINS demonstrates insurance sector cross-sector flows.
-
Bearish Momentum (Price Cross Below 15DMA): (Key stocks) NGXINS, AFRIPRUD, VETBANK, CAVERTON, MCNICHOLS, TRANSCORP, NGXGROUP, UNIVINSURE, LEARNAFRCA, INTENEGINS, CORNERST, CHAMPION, OANDO.
- AFRIPRUD: High dividend yielder 1.27% but bearish cross below 15DMA—caution warranted.
- CORNERST & OANDO also feature among top YTD losers—momentum remains negative.
- CHAMPION & DANGSUGAR at high RSI but sharp daily selloff—possible exhaustion rather than structural trend change.
-
RSI Extremes:
- UACN (99.55), MERGROWTH (75.65), BUACEMENT (89.33): all deeply overbought, caution for late buyers.
- ABBEYBDS (29.95): Approaching oversold; risk/reward improves for contrarians.
Contrarian Signals
- CHAMPION: Despite a neutral RSI (62.7) and bullish MACD, YTD is -9.8% but saw a -10% daily drawdown—potential turn if support holds and momentum picks up.
- AFRIPRUD: High yield (1.27%), beta 0.64 (defensive), but stock is breaking down on momentum. Contrarian yield seekers may watch for a reversal sign.
- VERITASKAP: Smallcap insurer, large volume surge + price spike, but RSI not in danger zone—room for more upside if speculative flow continues.
- STERLINGNG: High volume but large price drop; may indicate capitulation or a forced exit. Short-term bounce plausible if buyers absorb supply.
Sector Heatmap & Technical Overview
| Sector | Most Active Stock(s) | Price Move (%) | Volume vs Avg | Technical Trend | Institutional Activity |
|---|---|---|---|---|---|
| Banking | FCMB, UBA, GTCO, ACCESSCORP, FIDELITYBK |
FCMB +8.00% ACCESSCORP +0.36% |
FCMB +553% ACCESSCORP normal |
FCMB: Bullish surge, above avg vol./momentum; FIDELITYBK: Price cross above 15DMA. |
ZENITHBANK: 20.17% of inst'l trade value. |
| Insurance | PRESTIGE, REGALINS, VERITASKAP, CORNERST |
VERITASKAP +9.45% CORNERST -9.78% |
VERITASKAP +277% (UV) | Mixed: PRESTIGE, REGALINS bullish cross; CORNERST bearish below 15DMA | None significant |
| Commodities/Beverages | DANGSUGAR, CHAMPION, OANDO |
DANGSUGAR -10.00% OANDO -10.00% |
Modest | RSI overbought; bearish cross | None notable |
| Other Financials (Registrars/Exchanges) | AFRIPRUD, NGXGROUP |
AFRIPRUD -1.57% NGXGROUP -6.57% |
Not significant | Bearish below 15DMA for both | None notable |
Dividend Yield – Beta Matrix (Defensive Opportunities)
| Symbol | Company | Dividend Yield (%) | Beta | Status |
|---|---|---|---|---|
| AFRIPRUD | Africa Prudential | 1.27 | 0.64 | Bearish; Crossed below 15DMA |
| CAVERTON | Caverton Offshore | 5.52 | 0.98 | Bearish |
| FIDELITYBK | Fidelity Bank | 5.48 | 0.89 | Bullish: Price crossed above 15DMA |
| CORNERST | Cornerstone Insurance | 5.28 | 0.93 | Bearish |
Insight: High dividend stocks like AFRIPRUD and FIDELITYBK show opposite momentum signals. Watch for reversals or stabilization among defensive plays.
Institutional Clustering Alert
- ZENITHBANK: 20.17% of institutional trade value—the single largest clustering. It closed flat on the day with moderate momentum and volume. Suggests continued institutional buy-side focus.
- FCMB: Significant volume (259M shares; +553% UV) and value from institutional accounts. Price rose strongly as well—potential accumulation phase.
- WAPCO, GTCO, UBA: High institutional volumes, though moves were muted or negative. Look for any divergence in institutional vs. retail behavior for these.
YTD Top 5 Gainers
| Stock | Price | YTD % Change | 5-Day % | RSI | Momentum |
|---|---|---|---|---|---|
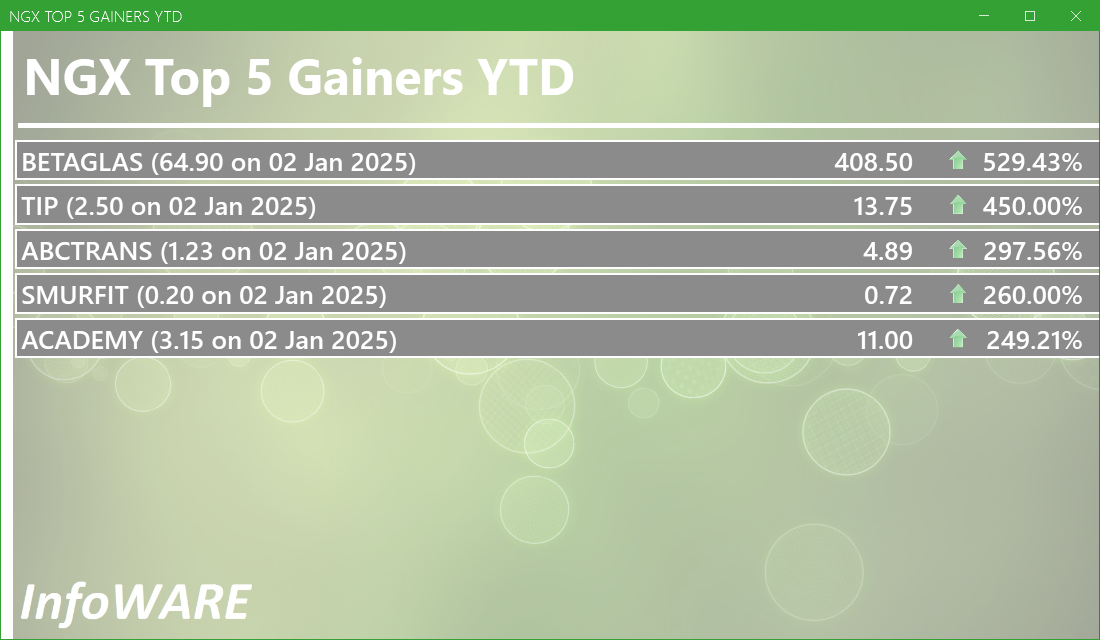
| UACN | 88.30 | +167.98 | +46.19 | 99.55 | Super overbought, extreme RSI + MACD histogram positive |
| CUSTODIAN | 36.00 | +128.07 | +27.87 | 90.84 | Strong bullish momentum |
| WEMABANK | 22.00 | +162.64 | +19.80 | 84.62 | Bullish with recent crossovers |
| MERGROWTH (ETF) | 665.50 | +66.38 | +21.00 | 75.65 | Correction day; previous overbought signal (RSI 97) |
| SIAMLETF40 (ETF) | 423.50 | +45.03 | +21.00 | -47.06 | Extreme RSI; check fund flows |
YTD Top 5 Losers
| Stock | Price | YTD % Change | 5-Day % | RSI | Momentum |
|---|---|---|---|---|---|
| ABBEYBDS | 5.27 | -75.67 | -34.13 | 29.95 | Approaching oversold territory, short risk rising |
| FTNCOCOA | 5.67 | +206.91 | -17.57 | 49.72 | Correction but long term still up |
| CORNERST | 4.60 | +4.80 | -15.31 | 56.44 | Bearish momentum, falling below 15DMA |
| OANDO | 53.10 | -19.30 | -13.24 | 57.22 | Bearish breakdown |
| LASACO | 2.84 | -23.30 | -13.33 | 43.32 | Trendless to mild bearish |
Trading Activity: Institutional vs Retail
-
Institutional Investors:
- Account for 41.45% of all trades, but dominate in volume (+72.07%) and trade value (+89.01%).
- Core trades: ZENITHBANK, WAPCO, GTCO, FCMB, UBA.
- FCMB stands out—the top by volume (259M shares) and value (2.65B NGN; +553% UV). Likely institution-driven accumulation.
- Financials dominate institutional focus, with large trade clustering in leading banks.
-
Retail Investors:
- 58.55% of all trades, but only 27.93% of volume and 10.99% of value—suggesting they're trading more in small-cap, less liquid names.
- Top symbols: UBA, MTNN, ACCESSCORP, GTCO, DANGSUGAR. Retail flows skew to liquid, well-known stocks.
- Noteworthy: Retail sold into DANGSUGAR weakness and participated in MTNN’s strength.
-
Insights for traders:
- Institutional buying on high-volume spikes (e.g., FCMB) can precede price momentum and may signal accumulation— watch for follow-through in sessions ahead.
- Retail crowd moving into liquid stocks (UBA, MTNN) but little sign of "froth" yet in high-risk names.
- Spread between institutional vs. retail volumes largest in banks — sector rotation in play.
Trader Suggestions & Watchlist
-
Bullish watch:
- FCMB, UACN, FIDELITYBK – momentum, high volume, or price crossing above key averages.
- VERITASKAP – volume-driven speculation, potential breakout play.
-
Bearish/risk-caution:
- ABBEYBDS, OANDO, CORNERST – breaking down with little technical support, avoid bottom-fishing without reversal confirmation.
- DANGSUGAR, CHAMPION– Overbought on RSI, but large one-day sell-off; avoid chasing but monitor for reversal setups.
-
Dividend/Defensive:
- Monitor AFRIPRUD or FIDELITYBK for yield-driven rebounds—be patient on confirmation of trend reversal.
- General Caution: Breadth not confirming the index move. Chasing overbought leaders like UACN, MERGROWTH, or BUACEMENT is risky—expect mean-reversion soon.
Currency Market: The Naira depreciated by -0.06% to 1,530 per Dollar—cautious market risk mood persists.
Hidden Insights & Patterns Worth Tracking
- Several top YTD gainers (UACN, MERGROWTH) are now extremely overbought by RSI but still supported by positive MACD—watch for a momentum unwind if volume stalls.
- Institutions are heavily clustered in banking stocks, especially FCMB (both value and volume). Such moves often precede a sector breakout or trend continuation—short-term traders should monitor for follow-through.
- High Dividend, Low Beta, and Bearish Cross Candidates: AFRIPRUD displays all—raising the odds of a tactical, low-risk entry for dividend investors IF price stabilizes post-selloff.
- Stocks with both bearish price momentum and unusual volume (e.g., STERLINGNG, ROYALEX) may indicate forced selling or portfolio rotation—watch for reversal signals in upcoming sessions.
|
Top ASI Gainers Over Last 5 Trading Days
|
Top ASI Losers Over Last 5 Trading Days
|
For more detailed analysis, on InfoWARE Market Data Terminal <NSEPERF> <GO>
On InfoWARE Finance Mobile App (Android, iPhone & iPad, Windows Phone and Windows 8/10), "Top Gainers & Losers"
GREENWICH ASSET ETF (GREENWETF) topped the advancers list closing at N291.50 with a gain of 10.00% followed by MERISTEM GROWTH EXCHANGE TRADED FUND (MERGROWTH) which closed at N665.50 with a gain of 10.00%.
On the flip side CHAMPION BREW. PLC. (CHAMPION) and DANGOTE SUGAR REFINERY PLC (DANGSUGAR) topped the decliners log with a loss of -10.00% at a close of N12.51, and -10.00% to close the day at N66.15 respectively.
| Symbol | LClose | %Chg |
|---|---|---|
| GREENWETF | 291.50 | 10.00 |
| MERGROWTH | 665.50 | 10.00 |
| UACN | 88.30 | 9.96 |
| BUACEMENT | 148.00 | 9.63 |
| VERITASKAP | 1.39 | 9.45 |
For more detailed analysis,
- On InfoWARE Market Data Terminal <TOPG> <GO>
- On InfoWARE Finance Mobile App ( Android, iPhone & iPad and Windows 10) , "Top Gainers & Losers"
Currency Market
In the currency market, the Naira fell 0.06%(-0.90) against the Dollar to settle at 1 to 1Investment Insights - Top 5 Gainers YTD
These stocks are the best performers whose price has risen faster than the market as a whole with the best returns year to date. Momentum investors believe that stocks that have outperformed the market will often continue to do so because the factors that caused them to outperform will not suddenly disappear. In addition, other investors seeking to benefit from the stock’s outperformance will often purchase the stock, further bidding its price higher and pushing the stock higher still
For more detailed analysis,
- On InfoWARE Market Data Terminal <T5YTD2> <GO>
- On InfoWARE Finance Mobile App ( Android , iPhone & iPad and Windows 10) , "Research"
NSE: Bull Signal - Price crossed above 15 Day MA
This signal implies these stocks are under buying pressure and the price might continue to rise and therefore positions should be monitored closely. Further suggested analysis include looking at the overall market (ASI) to see if the uptrend is market wide, sector wide or specific to the stock. Portfolio managers tend to use this as a signal to do more research to add to their positions or lock in some profits. Typically further analysis should be done using commands like PC and RV on the InfoWARE Market Data Terminal. Another command is ALERTS to set price triggers for possible exit or entry as necessary
For more detailed analysis,
- On InfoWARE Market Data Terminal <NSEPERF> <GO>
- On InfoWARE Finance Mobile App ( Android , iPhone & iPad and Windows 10) , "Top Gainers & Losers"
| Symbol | Price | %Chg | 15DMA | PE | EPS | DivY | MktCap | Vol | Trades | Value | LstTradeTime |
|---|---|---|---|---|---|---|---|---|---|---|---|
| LEGENDINT | 6.40 | 8.13 | 6.13 | 0.00 | 0.00 | 794.78K | 66.00 | 4.94M | 01-Aug-2025 14:30:24.267 | ||
| PRESTIGE | 1.26 | 7.94 | 1.21 | 10.49 | 0.08 | 2.50 | 16.70B | 7.19M | 93.00 | 8.93M | 01-Aug-2025 14:31:04.257 |
| REGALINS | 0.84 | 4.76 | 0.80 | 4.35 | 0.11 | 6.52 | 5.60B | 21.38M | 133.00 | 17.49M | 01-Aug-2025 14:31:04.263 |
| FIRSTHOLDCO | 33.40 | 3.44 | 33.30 | 0.00 | 0.00 | 9.02M | 563.00 | 296.26M | 01-Aug-2025 14:31:09.607 | ||
| FIDELITYBK | 21.20 | 0.71 | 21.12 | 13.24 | 1.17 | 5.48 | 614.27B | 85.55M | 931.00 | 1.80B | 01-Aug-2025 14:31:03.983 |
NSE: BEAR Signal - Price crossed below 15 Day MA
This signal implies these stocks are under selling pressure and the price might continue to slide and therefore positions should be monitored closely. Further suggested analysis include looking at the overall market (ASI) to see if the downtrend is market wide, sector wide or specific to the stock. If the overal market trend is upwards, then since these stocks are heading in the opposite direction, then further analysis should be done using commands like PC and RV on the InfoWARE Market Data Terminal. Another command is ALERTS to set price triggers for possible exit is necessar
For more detailed analysis,
- On InfoWARE Market Data Terminal <BEARM> <GO>
- On InfoWARE Finance Mobile App ( Android , iPhone & iPad and Windows 10)
| Symbol | Price | %Chg | 15DMA | PE | EPS | DivY | MktCap | Vol | Trades | Value | LstTradeTime |
|---|---|---|---|---|---|---|---|---|---|---|---|
| NGXINS | 886.95 | -0.29 | 889.89 | 10.41 | 2.09 | 0.00 | 0.00 | 40.60M | 676.00 | 145.70M | 01-Aug-2025 14:30:40.047 |
| AFRIPRUD | 15.95 | -1.57 | 16.06 | 19.57 | 0.61 | 1.27 | 31.90B | 3.77M | 192.00 | 60.44M | 01-Aug-2025 14:30:21.337 |
| NGXOILGAS | 2,436.63 | -1.76 | 2,439.17 | 8.74 | 228.15 | 0.00 | 0.00 | 4.60M | 637.00 | 474.99M | 01-Aug-2025 14:30:40.360 |
| VETBANK | 15.00 | -3.33 | 15.41 | 0.00 | 0.00 | 194.92K | 12.00 | 2.83M | 01-Aug-2025 14:31:05.267 | ||
| CAVERTON | 7.10 | -4.23 | 7.12 | 1.15 | 1.57 | 5.52 | 23.79B | 2.83M | 173.00 | 20.60M | 01-Aug-2025 14:30:22.170 |
| MCNICHOLS | 3.50 | -5.71 | 3.67 | 26.80 | 0.05 | 5.88 | 2.52B | 3.24M | 83.00 | 11.08M | 01-Aug-2025 14:31:09.920 |
| TRANSCORP | 50.00 | -6.00 | 50.55 | 0.00 | 0.00 | 0.23 | 2,032.40B | 5.26M | 393.00 | 263.83M | 01-Aug-2025 14:30:26.313 |
| NGXGROUP | 70.00 | -6.57 | 72.68 | 0.00 | 0.00 | 2.73 | 137.49B | 1.99M | 168.00 | 138.29M | 01-Aug-2025 14:30:24.810 |
| UNIVINSURE | 0.72 | -8.33 | 0.75 | 0.00 | 0.00 | 0.00 | 11.52B | 44.72M | 138.00 | 32.77M | 01-Aug-2025 14:31:04.343 |
| LEARNAFRCA | 5.70 | -10.53 | 6.18 | 5.79 | 0.51 | 8.53 | 4.40B | 2.35M | 84.00 | 13.44M | 01-Aug-2025 14:30:24.173 |
| INTENEGINS | 2.13 | -10.80 | 2.26 | 0.52 | 2.85 | 3.40 | 2.74B | 1.22M | 41.00 | 2.73M | 01-Aug-2025 14:30:23.823 |
| CORNERST | 4.15 | -10.84 | 4.48 | 8.62 | 0.35 | 5.28 | 75.39B | 2.49M | 66.00 | 10.51M | 01-Aug-2025 14:30:22.470 |
| CHAMPION | 12.51 | -11.11 | 12.91 | 412.83 | 0.01 | 0.41 | 97.95B | 6.95M | 179.00 | 87.26M | 01-Aug-2025 14:30:22.213 |
| OANDO | 53.10 | -11.11 | 54.73 | 24.10 | 2.53 | 1.15 | 660.11B | 10.38M | 712.00 | 551.19M | 01-Aug-2025 14:30:24.997 |
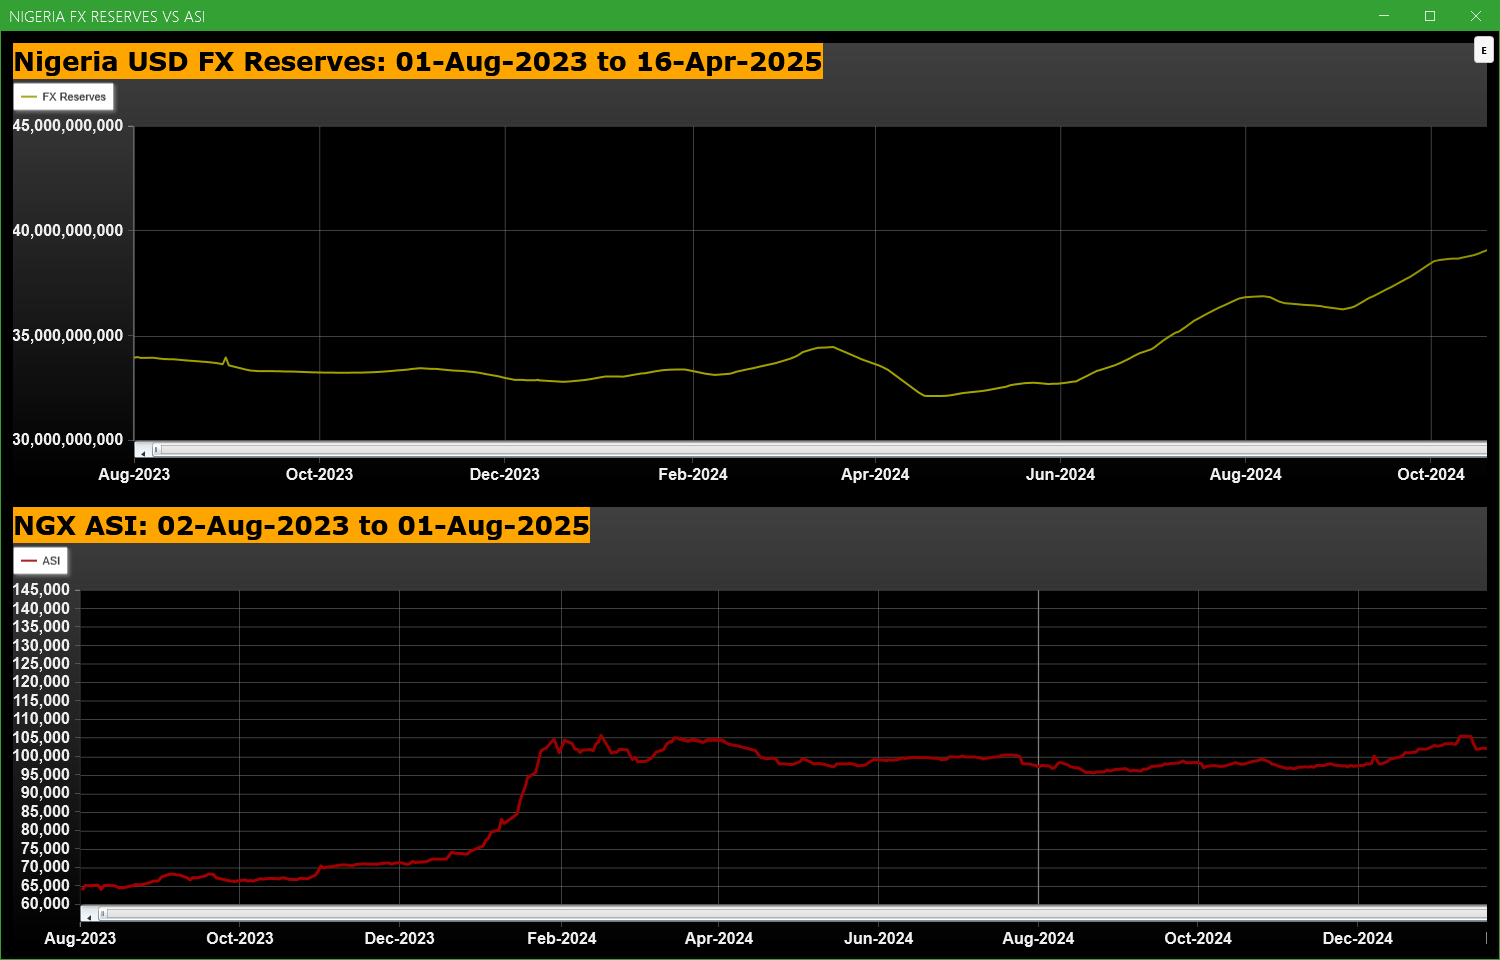
Economic Indicators - Nigeria FX Reserves Vs ASI Chart
Nigeria FX Reserves are assets held on reserve by CBN in foreign currencies. These reserves are used to back liabilities and influence monetary policy. Given the nature of the Nigeria economy, FX Reserves can appear to have an outsize influence on the economy and hence on the capital market. The chart below allows comparison of FX Reserves against the ASI to make investment decisions
For more detailed analysis,
- On InfoWARE Market Data Terminal <CI> <GO>
- On InfoWARE Finance Mobile App ( Android , iPhone & iPad and Windows 10) , "Research"
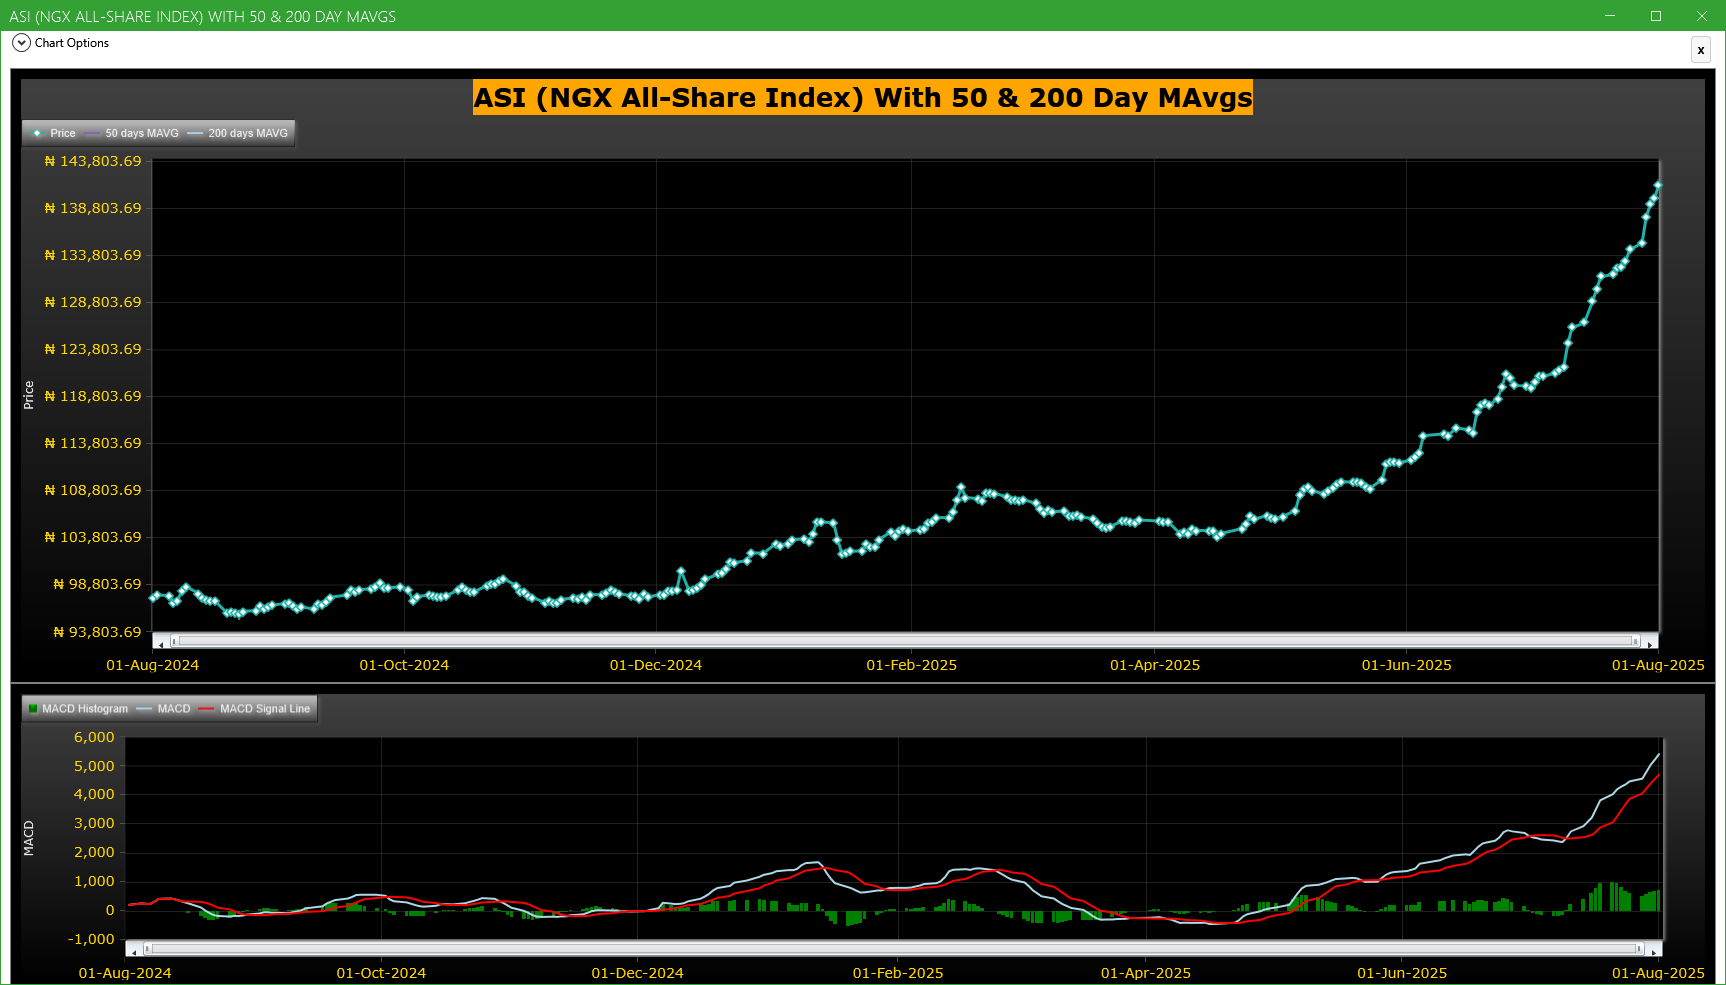
Market Trend - ASI (NGX All-Share-Index) With 50 & 200 Day MAvgs Chart
Technical traders typically use the 50 & 200 day moving averages to aid in choosing
where to enter or exit a position, which then causes these levels to act as strong
support or resistance. As a general guideline, if the price is above a moving average,
the trend is up. If the price is below a moving average, the trend is down.
It is important to note that critics of technical analysis say that moving averages act
as support and resistance because so many traders use these indicators to inform their
trading decisions. Also moving averages tend to work quite well in strong trending conditions
but poorly in choppy or ranging conditions.
Trading Strategies: Crossovers
Crossovers are one of the main moving average strategies. The first type is a price crossover,
which is when the price crosses above or below a moving average to signal a potential change
in trend. Another strategy is to apply two moving averages to a chart: one longer and one
shorter. When the shorter-term MA crosses above the longer-term MA, it is a buy signal, as
it indicates that the trend is shifting up. This is known as a golden cross. Meanwhile, when
the shorter-term MA crosses below the longer-term MA, it is a sell signal, as it indicates that
the trend is shifting down. This is known as a dead/death cross
For more detailed analysis,
- On InfoWARE Market Data Terminal <CI> <GO>
- On InfoWARE Finance Mobile App ( Android , iPhone & iPad and Windows 10) , "Research"
Unusual Volume: Volume traded is more than double the 90 day moving average (All exchanges; ASI & ASem). For more detailed analysis,
- On InfoWARE Market Data Terminal <UV> <GO>
- On InfoWARE Finance Mobile App ( Android , iPhone & iPad and Windows 10)
| Symbol | Name | Volume | 90DAvgVol | %VolChg | Price | LClose | %Chg | Trades | Value |
|---|---|---|---|---|---|---|---|---|---|
| FCMB | FCMB GROUP PLC. | 277.21M | 42.42M | 553.55 | 10.80 | 10.00 | 8.00 | 936 | 2.84B |
| STERLINGNG | STERLING FINANCIAL HOLDINGS COMPANY PLC | 58.37M | 9.70M | 501.59 | 6.50 | 7.00 | -7.14 | 740 | 396.75M |
| UNIVINSURE | UNIVERSAL INSURANCE COMPANY PLC | 44.72M | 21.62M | 106.86 | 0.72 | 0.78 | -7.69 | 138 | 32.77M |
| VERITASKAP | VERITAS KAPITAL ASSURANCE PLC | 41.54M | 11.03M | 276.75 | 1.39 | 1.27 | 9.45 | 145 | 57.18M |
| ROYALEX | ROYAL EXCHANGE PLC. | 36.45M | 14.71M | 147.85 | 1.50 | 1.65 | -9.09 | 369 | 58.24M |
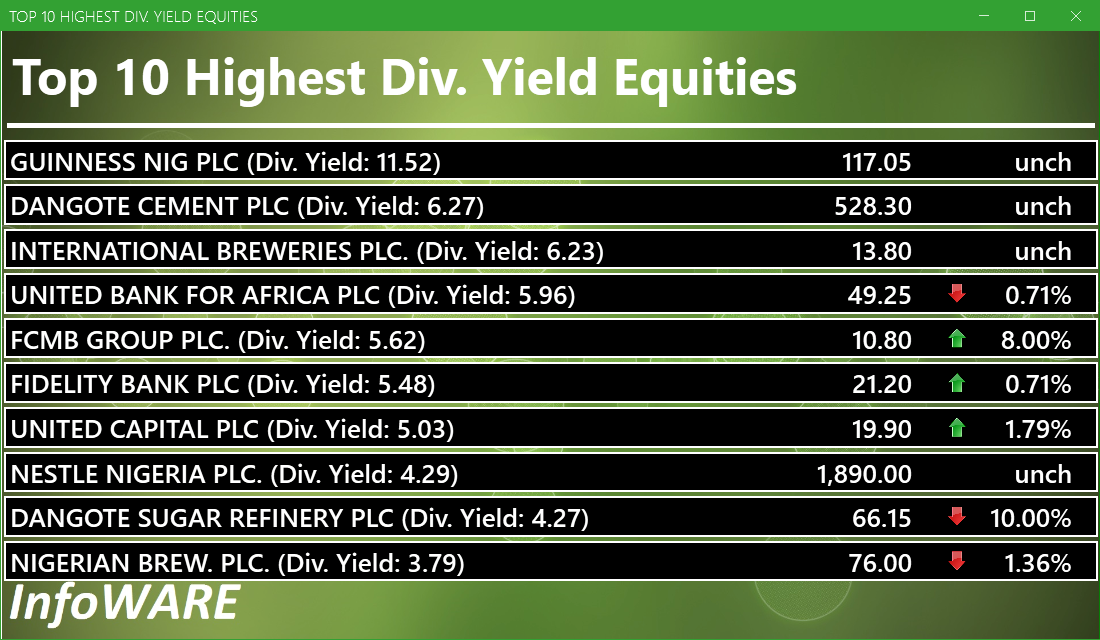
Investment Insights - High Div. Stocks
Dividend stocks distribute a portion of the company earnings to investors on a regular basis and they can a great choice for investors looking for regular income. As an investment or trading strategy, high dividend yield equities provide annual cash payments as against mostly capital gains in the price of a stock. The list in the table below represent the highest dividend paying stocks from the list of the most liquid stocks in the NSE top 30.
For more detailed analysis,
- On InfoWARE Market Data Terminal <HYIELD> <GO>
- On InfoWARE Finance Mobile App ( Android , iPhone & iPad and Windows 10) , "Research"
Investment Insights - Stocks outperforming the ASI but with approximately the same risk
These list of stocks represent equities that are less risky than the ASI but doing better than the ASI (All Shares Index) using the YTD (Year to Date) returns as the measure. The risk is measured by Beta. Beta is an assessment of a stock's tendency to undergo price changes, (its volatility), as well as its potential returns compared to the ASI. It is expressed as a ratio, where a score of 1 represents performance comparable to the ASI, and returns above or below the market may receive scores greater or lower than 1.
For a full list of both positively and negatively corelated stocks visit InfoWARE Market Data Terminal
- On InfoWARE Market Data Terminal <BANL> <GO>
- On InfoWARE Finance Mobile App ( Android , iPhone & iPad and Windows 10)
| Symbol | DivYield | PE | EPS | Beta | %ChgYTD | ASIYTDReturn | BetaDiff |
|---|---|---|---|---|---|---|---|
| HONYFLOUR | 1.40 | 16.28 | 0.31 | 0.99 | 246.82 | 36.91 | 0.01 |
| CAVERTON | 5.52 | 1.15 | 1.57 | 0.98 | 178.43 | 36.91 | 0.02 |
| FTNCOCOA | 1.60 | 0.00 | 0.00 | 0.79 | 206.91 | 36.91 | 0.21 |
| NB | 3.79 | 16.95 | 1.60 | 0.79 | 137.50 | 36.91 | 0.21 |
| MAYBAKER | 3.75 | 58.94 | 0.14 | 0.78 | 88.83 | 36.91 | 0.22 |
| UNILEVER | 2.81 | 67.09 | 0.40 | 0.75 | 106.94 | 36.91 | 0.25 |
| VETGOODS | 0.00 | 0.71 | 103.49 | 36.91 | 0.29 | ||
| CUTIX | 6.52 | 8.81 | 0.26 | 0.70 | 54.15 | 36.91 | 0.30 |
| Ikejahotel | 0.94 | 51.55 | 0.16 | 0.70 | 68.42 | 36.91 | 0.30 |
| ABBEYBDS | 1.43 | 0.00 | 0.00 | 0.70 | 75.67 | 36.91 | 0.30 |
African Markets
| Name | LClose | Change | %Chg |
|---|---|---|---|
| BRVM Stock Exchange | 311.27 | 0.50 | 0.16 |
| Botswana Stock Exchange | 10,498.75 | 0.00 | 0.00 |
| Egyptian Exchange | 33,859.68 | -224.96 | -0.66 |
| Lusaka Stock Exchange | 20,964.27 | 75.20 | 0.36 |
| Malawi Stock Exchange | 382,576.41 | 305.82 | 0.08 |
| Nigeria Stock Exchange | 139,278.67 | 1,365.34 | 0.99 |
| Nairobi Securities Exchange | 163.67 | -0.82 | -0.50 |
| Rwanda Stock Exchange | 150.39 | 0.00 | 0.00 |
| Uganda Securities Exchange | 1,338.54 | 6.13 | 0.46 |
Nigeria Market Indexes
| Symbol | LClose | %Chg | WTD% | MTD% | QTD% | YTD% | MktCap | Trades |
|---|---|---|---|---|---|---|---|---|
| ASI | 141,263.05 | 1.00 | 4.51 | 0.00 | 17.97 | 36.91 | 11,015 | |
| NGX30 | 5,185.55 | 0.97 | 4.67 | 0.00 | 9.78 | 35.93 | 6,609 | |
| NGXAFRBVI | 3,814.10 | -0.38 | 4.74 | 0.00 | 7.64 | 53.75 | 2,080 | |
| NGXAFRHDYI | 23,224.98 | 0.41 | 2.11 | 0.00 | 11.05 | 36.40 | 2,787 | |
| NGXASEM | 1,446.38 | 0.00 | 0.00 | 0.00 | -9.32 | -8.67 | 1 | |
| NGXBNK | 1,618.91 | 0.52 | 4.21 | 0.00 | 7.16 | 48.88 | 3,195 | |
| NGXCG | 4,301.61 | 0.24 | 4.98 | 0.00 | 25.09 | 52.04 | 5,882 | |
| NGXCNSMRGDS | 2,976.61 | 1.61 | 1.42 | 0.00 | -14.19 | 71.63 | 1,572 | |
| NGXCOMMDTY | 1,095.89 | -0.32 | 0.80 | 0.00 | 4.64 | 9.59 | 752 | |
| NGXGROWTH | 11,067.79 | 0.00 | 10.40 | 0.00 | 16.39 | 42.57 | 212 | |
| NGXINDUSTR | 5,055.71 | 3.49 | 9.42 | 0.00 | 43.51 | 41.55 | 916 | |
| NGXINS | 886.95 | -0.29 | -3.67 | 0.00 | 20.09 | 12.82 | 676 | |
| NGXLOTUSISLM | 11,625.81 | 1.06 | 7.24 | 0.00 | 21.42 | 66.85 | 2,210 | |
| NGXMAINBOARD | 6,639.09 | 1.21 | 2.29 | 0.00 | 12.55 | 32.68 | 7,904 | |
| NGXMERIGRW | 10,309.45 | 2.25 | 7.12 | 0.00 | 6.81 | 58.04 | 1,632 | |
| NGXMERIVAL | 14,525.98 | -0.07 | 5.54 | 0.00 | 21.58 | 39.27 | 2,851 | |
| NGXOILGAS | 2,436.63 | -1.73 | -0.70 | 0.00 | 1.86 | -10.13 | 637 | |
| NGXPENBRD | 2,606.20 | 1.22 | 5.64 | 0.00 | 13.35 | 42.29 | 9,203 | |
| NGXPENSION | 6,914.46 | 0.13 | 4.44 | 0.00 | 8.81 | 52.50 | 7,048 | |
| NGXPREMIUM | 14,766.15 | 0.64 | 8.58 | 0.00 | 28.74 | 51.71 | 2,899 | |
| NGXSOVBND | 672.87 | 0.00 | 0.46 | 0.00 | 2.96 | 11.86 | 0 |
For more detailed analysis,
- On InfoWARE Market Data Terminal <MKTINS> <GO>
- On InfoWARE Finance Mobile App ( Android, iPhone & iPad and Windows 10) , "Market Indexes"
Find the topic interesting? Will like to comment? Contact Us at solutions@infowarelimited.com
Top News

InfoWARE AI Analyst Weekly Market Report: 01-Aug-2025
Chart Of The Day - ASI Chart Vs ASI Advance Decline Line (YTD) (01-Aug-2025 15:07:02.003)
InfoWARE AI Analyst Daily Market Report: 01-Aug-2025

[AIRTELAFRI]>>Corporate Disclosures-<Airtel Africa Plc>
[XNSA]>> CORDROS MILESTONE FUNDS' BID & OFFER PRICES
[FIDSON]>>Corporate Disclosures-<FIDSON HEALTHCARE PLC>
[MERVALUE]>> DAILY INDICATIVE PRICES
[OANDO]>>Corporate Disclosures-<OANDO PLC>
[AIICO]>>Corporate Disclosures-<AIICO INSURANCE PLC.>
[XNSA]>> CIS ACADEMY TRAINING
[UCAP]>>Corporate Disclosures-<UNITED CAPITAL PLC>
[XNSA]>> LISTING OF 11,500,000 ORDINARY SHARES OF SEPLAT ENERGY PLC'S EMPLOYEE S
[STAMBICETF30]>> DAILY INDICATIVE PRICES
[AIRTELAFRI]>>Corporate Disclosures-<Airtel Africa Plc>
Chart Of The Day - ASI Chart Vs ASI Advance Decline Line (YTD) (31-Jul-2025 15:08:02.482)
InfoWARE AI Analyst Daily Market Report: 31-Jul-2025
[XNSA]>> OFF MARKET TRADE
[UNILEVER]>>Corporate Disclosures-<UNILEVER NIGERIA PLC.>
[BETAGLAS]>>Corporate Disclosures-<BETA GLASS PLC>
[INTBREW]>>Corporate Disclosures-<INTERNATIONAL BREWERIES PLC.>
[XNSA]>> CIS ACADEMY TRAINING
[XNSA]>> CORDROS MILESTONE FUNDS' BID & OFFER PRICES
[XNSA]>> NGX FIXED INCOME INDICATIVE PRICE LIST FOR JUL 31, 2025
[VETINDETF]>> DAILY INDICATIVE PRICES
[XNSA]>> EMERGING AFRICA DAILY FUND PRICES
[XNSA]>> ACTIVATION OF CODE FOR TRADING IN RIGHTS
[SIAMLETF40]>> DAILY INDICATIVE PRICES
Chart Of The Day - ASI Chart Vs ASI Advance Decline Line (YTD) (30-Jul-2025 15:07:26.100)
InfoWARE AI Analyst Daily Market Report: 30-Jul-2025
[UBA]>>Corporate Disclosures-<UNITED BANK FOR AFRICA PLC>
Get IDIA - the stock trading app for the modern investor
Solutions by Business
Product Suites
Company
Contacts
- 8th Floor,
- South Atlantic Petroleum Towers,
- 1 Adeola Odeku Street,
- Victoria Island,
- Lagos, Nigeria.
- Email: solutions@infowarelimited.com
Follow Us
 |
 |
 |
 |