


InfoWARE AI Analyst Daily Market Report: 19-Aug-2025 | InfoWARE Finance
Get IDIA - the stock trading app for the modern investor


InfoWARE AI Analyst Daily Market Report: 19-Aug-2025
(Source: InfoWARE Terminal, Date: 19-Aug-2025)
Dear Investor,
NGX Daily Market Summary – Tuesday, August 19, 2025
The Nigerian equities market delivered a turbulent session today, with the NGX All Share Index (ASI) shedding -1.46% to close at 144,722.47. Despite this correction, the ASI remains up +38.22% on a YTD basis—a testament to the market's resilience and preceding strength. Notably, market turnover surged by 22.54% to ₦16.69B, hinting at heightened activity despite the overall selloff. Breadth was negative at 0.64x, with decliners outpacing advancers (44 vs. 28), signifying broad-based profit-taking and a cautious investor mood. While champions emerged among gainers such as LOTUSHAL15 and DAARCOMM, losses were steep for the likes of ENAMELWA and prominent blue-chip DANGCEM.
Significant Market Breadth & Trends
- Breadth: Advancers (28) were overwhelmed by Decliners (44)—bears controlled the tape.
- Turnover: Market value traded +22.54% higher despite lower total volume—signals preference for large-cap selling and institutional repositioning.
- Volume & Participation: Volume rose in 70 companies and fell in 71, underscoring sectoral rotation and selective accumulation/distribution.
- Unusual Volume Clusters: Notable spikes in insurance names (MBENEFIT, AIICO, UNIVINSURE), with volumes 2-4x 90D averages.
Top Gainers & Losers – Today
| Symbol | Name | % Change | RSI | MACD | Notes |
|---|---|---|---|---|---|
| LOTUSHAL15 | Lotus Halal Eqty ETF | +10.00% | N/A | N/A | ETF surge: possible sector index buy flows |
| DAARCOMM | Daar Communications | +9.82% | 69.3 | 0.08 ↑ | Approaching overbought, strong YTD performer and high recent momentum |
| DEAPCAP | Deap Capital | +9.60% | 67.8 | 0.11 ↑ | Surging YTD with bullish technicals, >31% gain in 5 days |
| ACADEMY | Academy Press | +8.43% | 48.1 | 0.25 ↑ | Gaining traction; below overbought, steady trend |
| INTBREW | International Breweries | +6.95% | 44.9 | -0.19 | Bullish momentum—closed above 15DMA, but RSI below 50, watch for follow-through |
| Symbol | Name | % Change | RSI | MACD | Notes |
|---|---|---|---|---|---|
| ROYALEX | Royal Exchange | -10.00% | 69.2 | 0.43 ↑ | High RSI despite steep fall—potential trend reversal? |
| DANGCEM | Dangote Cement | -9.88% | 90.0 | 30.83 | Extremely overbought but sharp drop—profit-taking or deeper correction? |
| RTBRISCOE | RT Briscoe | -9.87% | 58.0 | 0.13 | Loss on high volatility, MACD positive |
| STANBICETF30 | Stanbic IBTC ETF 30 | -9.82% | 57.3 | 14.19 | ETF pressured, index-related selling |
| WAPIC | Wapic Insurance | -9.77% | 66.6 | 0.45 | High RSI + loss—a warning of near-term exhaustion? |
Year-To-Date (YTD) Top Gainers and Losers
| Symbol | Name | YTD % | 5D % | RSI | Notes |
|---|---|---|---|---|---|
| MBENEFIT | Mutual Ben. Assurance | +604.92% | +22.86% | 85.49 | Massive YTD rally, highly overbought |
| CHAMPION | Champion Brew. | +371.13% | +9.25% | 69.40 | Momentum intact but moderating RSI |
| TIP | The Initiates Plc | +420.00% | -10.34% | 51.80 | Pullback after strong run |
| ENAMELWA | Nigerian Enamelware | +86.01% | +9.95% | 97.26 | Extreme RSI—overheated, profit-taking risk |
| DEAPCAP | Deap Capital | +61.67% | +31.97% | 67.79 | High volume, strong technicals |
| Symbol | Name | YTD % | 5D % | RSI | Notes |
|---|---|---|---|---|---|
| GREENWETF | Greenwich Asset ETF | -40.82% | -18.97% | 47.68 | ETF, pressure persists |
| NEIMETH | Neimeth Phar. | +176.89% | -12.91% | 47.49 | Profit-taking phase |
| LASACO | LASACO Assurance | +6.19% | -20.00% | 57.34 | Price correction deepens |
| ROYALEX | Royal Exchange | +129.09% | -11.58% | 69.18 | Big fall despite YTD gain |
| WAPIC | Wapic Insurance | +45.75% | -10.67% | 66.55 | Correction phase |
Bullish Momentum Table (15DMA Crossovers, RSI, MACD, etc.)
| Symbol | Name | Price | % Chg | 15DMA | RSI | Sparkline (15D/50D) |
Notes |
|---|---|---|---|---|---|---|---|
| INTBREW | International Breweries | 13.85 | +6.50% | 13.48 | 44.89 | ↗ | Positive breakout above 15DMA MACD improving, RSI below 50 (still early stage) |
| DANGSUGAR | Dangote Sugar Refinery | 61.90 | +0.81% | 61.42 | 57.05 | ↗ | 15DMA > 50DMA, bullish structure, moderate RSI |
Bearish Momentum Table (15DMA Breakdowns, RSI, MACD, etc.)
| Symbol | Name | Price | % Chg | 15DMA | RSI | Sparkline (15D/50D) |
Notes |
|---|---|---|---|---|---|---|---|
| DANGCEM | Dangote Cement | 520.00 | -10.96% | 562.21 | 89.98 | ↘ | Extremely overbought RSI pairs with sharp 15DMA breakdown—watch for deeper retrace |
| LASACO | LASACO Assurance | 3.60 | -10.83% | 3.68 | 57.34 | ↘ | Bearish breakdown: technical selling pressure, insurance sector risk |
| CAP | CAP PLC | 64.10 | -10.76% | 69.64 | N/A | ↘ | Substantial correction as 15DMA turns down |
Contrarian Signals
- ENAMELWA: RSI at 97.26!—almost unprecedented overbought, huge 9.95% daily gain, YTD +86%. Contrarians should be alert for potential sharp reversal or profit-taking.
- DANGCEM: RSI sky-high at 89.98 yet suffered -9.88% drop. Despite bullish trends, this move points to exhaustion and perhaps the start of significant mean reversion.
- ROYALEX: Down -10.00% but maintains high RSI (69.2). Such divergence often precedes a bounce or further sharp move—close monitoring required.
- MBENEFIT: Up +22.86% over 5 days and YTD up +604.92%—RSI at 85.49 (overbought). Trend continuation or imminent cooling?
- CHAMPION: RSI at 69.4 with -3% yesterday despite massive YTD gain—mixed signals, potential for sharp moves either side.
Sector Heatmaps & Performance Table
| Sector | Trend | Institutional Flow | Tech Signal |
|---|---|---|---|
| Building Materials | Bearish | High (e.g. DANGCEM & CAP saw big drops, turnover up) | Major 15DMA breakdowns, high RSI reversals |
| Food/Beverages/Brewers | Bullish | Net buyers (e.g. INTBREW, DANGSUGAR rising) | INTBREW crosses above 15DMA, DANGSUGAR bullish crossover |
| Insurance | Mixed | Pockets of activity (MBENEFIT high vol, others selling) | Many stocks at/near overbought, unusual volumes |
| Banking | Choppy | Dominate top institutional and retail trades | Broad profit-taking after recent runs; mixed RSI |
Dividend-Beta Matrix: Defensive Screen
| Symbol | Div. Yield | Beta | Momentum | Comment |
|---|---|---|---|---|
| FIDSON | 4.14% | 0.25 | Bearish (Below 15DMA, -5.02%) | Stable, but under selling pressure, defensive yield |
| DANGSUGAR | 4.27% | 1.35 | Bullish (Above 15DMA) | Attracts yield and growth investors, sweet spot if trend holds |
| RTBRISCOE | 4.35% | -0.16 | Bearish | Yield play but technicals weak; caution |
| AFRIPRUD | 1.27% | 0.64 | n/a | Low risk-profile with solid yield, but not flashing on momentum today |
Institutional Clustering Alerts
- ZENITHBANK: 20.17% of total institutional trade value—clear sign of "smart money” consolidation or repositioning. The trade count was low but value very high; price down -7.26%, possible block exits or rebalancing.
- ACCESSCORP, UBA, GTCO also saw outsized institutional flows, suggesting that banks, despite today's red close, remain central in fund manager strategies.
- Notable Divergence: Many institutional favorites are under pressure—possible contrarian/rebound opportunities if reversal signals emerge.
High Dividend Yield & Momentum Overlaps
- Stocks such as DANGSUGAR offer both generous dividends and are showing bullish price action, making them attractive anchors for income-seeking momentum players.
- Yield names flashing technical sell signals (like RTBRISCOE and FIDSON) warrant close monitoring—watch for oversold bounces or confirmation of downtrend.
Trader Suggestions & Tactics
- Bullish Names: For DANGSUGAR and INTBREW, current uptrends and improving technicals make them candidates for continued momentum buys—but watch for overbought levels (RSI over 70).
- Bearish Flagged: DANGCEM (now deeply overbought on RSI, but tanking hard) suggests further caution—avoid chasing, look for mean reversion entries if panic overshoot occurs.
- Unusual Volume Plays: Insurance stocks with surging volume may offer ultra-short term opportunities but are likely very crowded and volatile—rapid profit-taking is advised.
- Defensive Rotation: For volatility-averse investors, focus on stable, low-beta, high-dividend stocks not flashing negative momentum.
Tuesday Focus: Top 3-5 YTD Gainers & Losers
Top 5 Gainers:| Symbol | Name | YTD % | RSI | 5D % |
|---|---|---|---|---|
| MBENEFIT | Mutual Benefits Assurance | +604.92% | 85.5 | +22.86% |
| TIP | The Initiates Plc | +420.00% | 51.80 | -10.34% |
| CHAMPION | Champion Brew. | +371.13% | 69.40 | +9.25% |
| ABCTRANS | Associated Bus Co. | +310.57% | 58.36 | +11.48% |
| WEMABANK | Wema Bank | +160.44% | 62.97 | +14.49% |
| Symbol | Name | YTD % | RSI | 5D % |
|---|---|---|---|---|
| GREENWETF | Greenwich Asset ETF | -40.82% | 47.68 | -18.97% |
| LASACO | LASACO Assurance | +6.19% | 57.34 | -20.00% |
| ROYALEX | Royal Exchange | +129.09% | 69.18 | -11.58% |
| WAPIC | Wapic Insurance | +45.75% | 66.55 | -10.67% |
| TIP | The Initiates Plc | +420.00% | 51.80 | -10.34% |
Market Trades Analysis (Activity/Trades Summary)
Retail vs. Institutional:- Retail: 59.9% of trade count, 38.6% of volume, 16.6% of value — Many smaller trades, favoring less liquid/cheaper stocks.
- Institutional: 40% of trade count, but 61.4% of total volume, and a dominant 83.4% of traded value — Concentrated block trades, likely driving the turnover surge despite lower volume.
- Top Institutional Stocks: ZENITHBANK, ACCESSCORP, UBA, GTCO, FIDELITYBK — All banks, indicating "big money” sector focus.
- Top Retail Stocks: AIICO, MTNN, UBA, GTCO, ACCESSCORP — Blend of banking and insurance; UBA/GTCO/ACCESSCORP overlap in both tables, amplifying volatility in these stocks.
- Bank stocks remain central for both institutional and retail players—the heavy flows suggest that price action in these names will set the tone for the broader market.
- Institutional selling in banks (negative price change in ZENITHBANK, ACCESSCORP, GTCO) could create oversold "snapback rally” opportunities.
- Insurance stocks (AIICO, MBENEFIT, PRESTIGE): high retail engagement and unusual volumes signal retail-driven momentum, but often with sharp reversals—exercise discipline.
Hidden Insights & Patterns
- Insurance Sector contains multiple "momentum burnout” candidates: MBENEFIT, WAPIC, ROYALEX all have high RSI, strong YTD, and now some negative daily moves—this could mark an inflection point.
- Bullish/Bearish Overlaps: Several YTD gainers (ENAMELWA, MBENEFIT) also appear in unusual volume or high RSI tables, heightening reversal risk.
- Banking & Large Caps: Concentrated institutional selling in ZENITHBANK, ACCESSCORP, GTCO on high value and negative price could present near-term mean reversion setups.
- Sector Divergence: Building Materials flashing broad-based bear signals, but Food & Beverages/Consumer names (INTBREW, DANGSUGAR) bucking the trend.
- Bullish 15DMA Crossovers: DANGSUGAR, INTBREW—seek continuation setups; but confirm via RSI and trend strength.
Strategy Takeaways for Investors & Traders
- Momentum traders: focus on recent bullish 15DMA/50DMA crossovers with moderate RSI (INTBREW, DANGSUGAR).
- Contrarians: Watch for reversal setups in ENAMELWA, DANGCEM, and crowded insurance names now showing technical ‘burnout’ signs.
- Yield/Defensive Investors: Favor lower-beta, high dividend stocks not in clear downtrend.
- Caution: Avoid stocks with extreme RSI (>80) after big runs unless you are short-term profit taking.
- Market-wide: Bank stocks are action centers; buy the dip if technical reversal signals confirm (oversold bounces likely if panic persists).
- Insurance names with unusual volume and high RSI should be monitored for reversal or "blowoff” moves—don’t chase late rallies.
|
Top ASI Gainers Over Last 5 Trading Days
|
Top ASI Losers Over Last 5 Trading Days
|
For more detailed analysis, on InfoWARE Market Data Terminal <NSEPERF> <GO>
On InfoWARE Finance Mobile App (Android, iPhone & iPad, Windows Phone and Windows 8/10), "Top Gainers & Losers"
LOTUS HALAL EQUITY ETF (LOTUSHAL15) topped the advancers list closing at N115.55 with a gain of 10.00% followed by NIGERIAN ENAMELWARE PLC. (ENAMELWA) which closed at N35.90 with a gain of 9.95%.
On the flip side ROYAL EXCHANGE PLC. (ROYALEX) and DANGOTE CEMENT PLC (DANGCEM) topped the decliners log with a loss of -10.00% at a close of N2.52, and -9.88% to close the day at N520.00 respectively.
| Symbol | LClose | %Chg |
|---|---|---|
| LOTUSHAL15 | 115.55 | 10.00 |
| ENAMELWA | 35.90 | 9.95 |
| DAARCOMM | 1.23 | 9.82 |
| DEAPCAP | 1.94 | 9.60 |
| ACADEMY | 9.00 | 8.43 |
| Symbol | LClose | %Chg |
|---|---|---|
| ROYALEX | 2.52 | -10.00 |
| DANGCEM | 520.00 | -9.88 |
| RTBRISCOE | 3.56 | -9.87 |
| STANBICETF30 | 450.00 | -9.82 |
| JAIZBANK | 4.32 | -9.81 |
For more detailed analysis,
- On InfoWARE Market Data Terminal <TOPG> <GO>
- On InfoWARE Finance Mobile App ( Android, iPhone & iPad and Windows 10) , "Top Gainers & Losers"
Currency Market
In the currency market, the Naira was unchanged against the dollar at 1 to 1NSE: Bull Signal - Price crossed above 15 Day MA
This signal implies these stocks are under buying pressure and the price might continue to rise and therefore positions should be monitored closely. Further suggested analysis include looking at the overall market (ASI) to see if the uptrend is market wide, sector wide or specific to the stock. Portfolio managers tend to use this as a signal to do more research to add to their positions or lock in some profits. Typically further analysis should be done using commands like PC and RV on the InfoWARE Market Data Terminal. Another command is ALERTS to set price triggers for possible exit or entry as necessary
For more detailed analysis,
- On InfoWARE Market Data Terminal <NSEPERF> <GO>
- On InfoWARE Finance Mobile App ( Android , iPhone & iPad and Windows 10) , "Top Gainers & Losers"
| Symbol | Price | %Chg | 15DMA | PE | EPS | DivY | MktCap | Vol | Trades | Value | LstTradeTime |
|---|---|---|---|---|---|---|---|---|---|---|---|
| INTBREW | 13.85 | 6.50 | 13.48 | 0.00 | 0.00 | 6.23 | 372.04B | 4.59M | 184.00 | 61.79M | 19-Aug-2025 14:31:20.610 |
| REDSTAREX | 12.00 | 4.17 | 11.90 | 5.93 | 0.74 | 6.12 | 11.45B | 426.01K | 67.00 | 5.02M | 19-Aug-2025 14:30:28.400 |
| MULTIVERSE | 10.20 | 3.92 | 10.11 | 0.00 | 0.00 | 0.85 | 4.35B | 394.49K | 38.00 | 4.02M | 19-Aug-2025 14:30:27.403 |
| CAVERTON | 7.20 | 2.78 | 7.11 | 1.15 | 1.57 | 5.52 | 24.12B | 5.37M | 173.00 | 37.89M | 19-Aug-2025 14:30:24.173 |
| CADBURY | 64.00 | 2.34 | 63.87 | 33.25 | 0.64 | 1.88 | 120.20B | 3.79M | 262.00 | 239.45M | 19-Aug-2025 14:30:24.077 |
| DANGSUGAR | 61.90 | 0.81 | 61.42 | 11.48 | 3.06 | 4.27 | 751.89B | 12.39M | 1,101.00 | 765.93M | 19-Aug-2025 14:31:20.480 |
NSE: BEAR Signal - Price crossed below 15 Day MA
This signal implies these stocks are under selling pressure and the price might continue to slide and therefore positions should be monitored closely. Further suggested analysis include looking at the overall market (ASI) to see if the downtrend is market wide, sector wide or specific to the stock. If the overal market trend is upwards, then since these stocks are heading in the opposite direction, then further analysis should be done using commands like PC and RV on the InfoWARE Market Data Terminal. Another command is ALERTS to set price triggers for possible exit is necessar
For more detailed analysis,
- On InfoWARE Market Data Terminal <BEARM> <GO>
- On InfoWARE Finance Mobile App ( Android , iPhone & iPad and Windows 10)
| Symbol | Price | %Chg | 15DMA | PE | EPS | DivY | MktCap | Vol | Trades | Value | LstTradeTime |
|---|---|---|---|---|---|---|---|---|---|---|---|
| NGX30 | 5,199.52 | -1.45 | 5,272.64 | 575.61 | 329.08 | 0.00 | 0.00 | 211.75M | 14,311.00 | 11.66B | 19-Aug-2025 14:30:49.073 |
| ASI | 142,613.47 | -1.48 | 144,174.31 | 11.84 | 457.69 | 0.00 | 0.00 | 993.37M | 32,665.00 | 16.69B | 19-Aug-2025 14:30:49.057 |
| NGXPENBRD | 2,632.49 | -1.70 | 2,662.77 | 348.78 | 389.18 | 0.00 | 0.00 | 671.93M | 25,346.00 | 15.20B | 19-Aug-2025 14:30:50.330 |
| NGXAFRHDYI | 23,042.90 | -1.76 | 23,275.15 | 7.46 | 39.30 | 0.00 | 0.00 | 65.63M | 6,452.00 | 4.53B | 19-Aug-2025 14:30:49.160 |
| NGXLOTUSISLM | 11,650.82 | -2.00 | 11,882.10 | 1,270.93 | 62.77 | 0.00 | 0.00 | 19.97M | 4,409.00 | 2.70B | 19-Aug-2025 14:30:49.920 |
| JAPAULGOLD | 2.81 | -3.20 | 2.82 | 0.19 | 12.01 | 0.90 | 17.60B | 14.79M | 254.00 | 41.83M | 19-Aug-2025 14:30:26.727 |
| UPDC | 6.85 | -4.38 | 6.86 | 0.00 | 0.00 | 34.25 | 127.14B | 3.96M | 348.00 | 28.87M | 19-Aug-2025 14:30:31.080 |
| NGXINDUSTR | 5,207.17 | -4.57 | 5,351.36 | 39.90 | 18.97 | 0.00 | 0.00 | 13.18M | 2,165.00 | 2.08B | 19-Aug-2025 14:30:49.653 |
| FIDSON | 41.80 | -5.02 | 42.78 | 22.54 | 0.64 | 4.14 | 95.93B | 1.19M | 308.00 | 48.06M | 19-Aug-2025 14:30:25.587 |
| VETGOODS | 32.00 | -9.38 | 33.59 | 0.00 | 0.00 | 12.61K | 9.00 | 485.36K | 19-Aug-2025 14:31:22.637 | ||
| CAP | 64.10 | -10.76 | 69.64 | 12.92 | 2.90 | 4.13 | 52.23B | 722.27K | 64.00 | 46.61M | 19-Aug-2025 14:30:24.113 |
| LASACO | 3.60 | -10.83 | 3.68 | 21.56 | 0.11 | 4.05 | 6.60B | 18.78M | 257.00 | 69.00M | 19-Aug-2025 14:30:26.800 |
| JAIZBANK | 4.32 | -10.88 | 4.57 | 83.05 | 0.03 | 1.67 | 149.22B | 10.82M | 600.00 | 49.21M | 19-Aug-2025 14:31:32.747 |
| STANBICETF30 | 450.00 | -10.89 | 491.88 | 0.00 | 0.00 | 1.92K | 18.00 | 878.81K | 19-Aug-2025 14:31:22.513 | ||
| RTBRISCOE | 3.56 | -10.96 | 3.75 | 0.00 | 0.00 | 4.35 | 4.19B | 824.81K | 55.00 | 2.97M | 19-Aug-2025 14:30:28.510 |
| DANGCEM | 520.00 | -10.96 | 562.21 | 761.31 | 0.63 | 6.27 | 8,861.06B | 2.60M | 664.00 | 1.35B | 19-Aug-2025 14:31:23.020 |
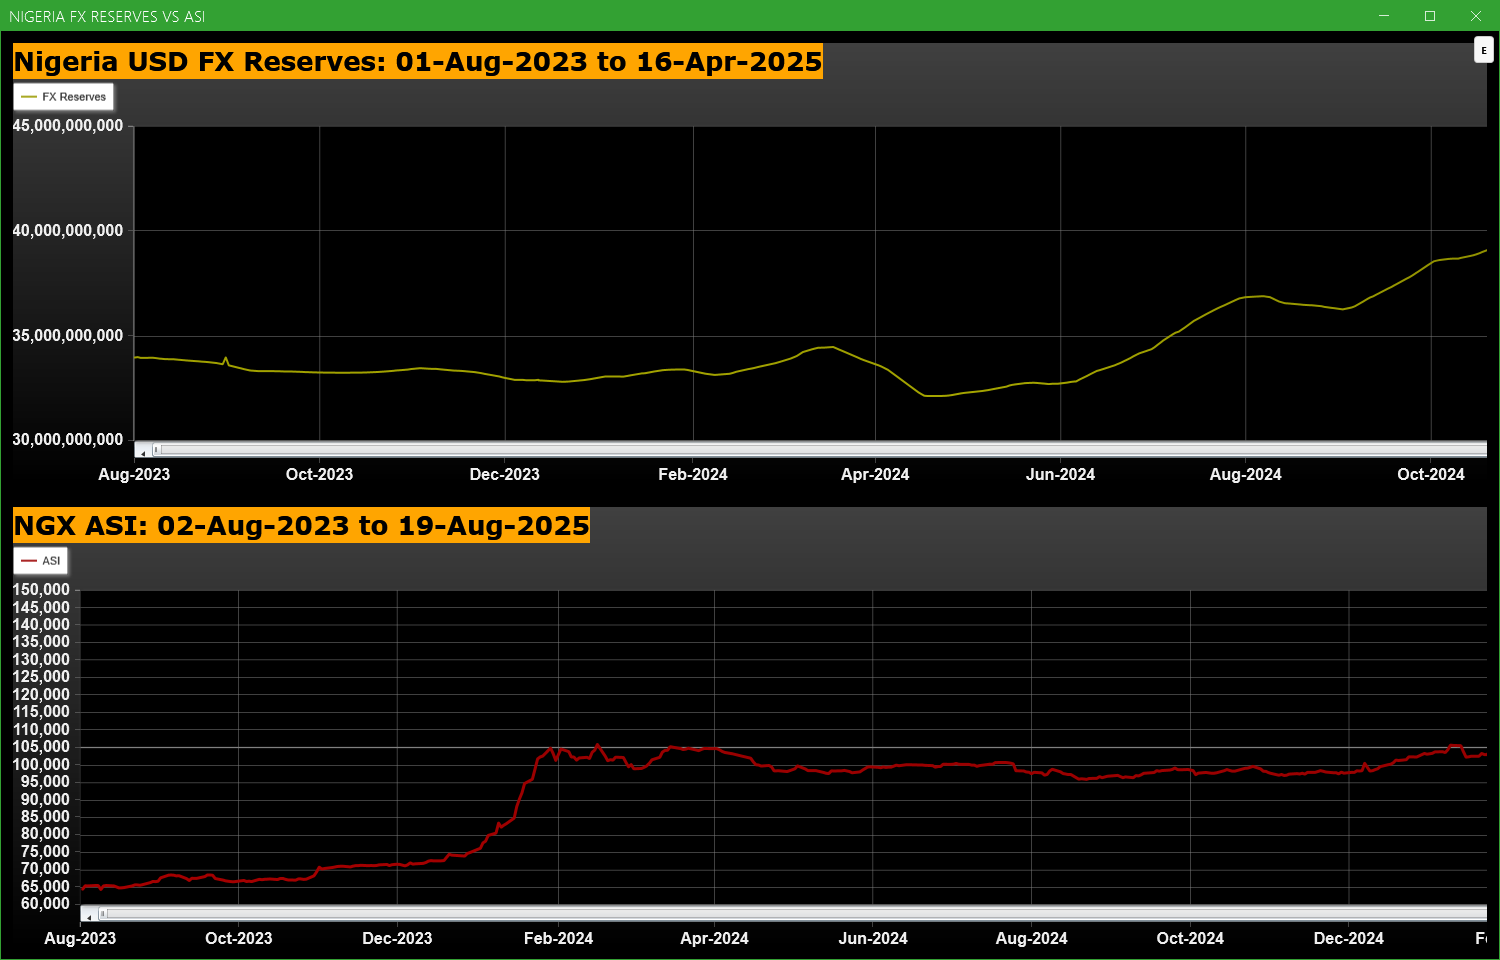
Economic Indicators - Nigeria FX Reserves Vs ASI Chart
Nigeria FX Reserves are assets held on reserve by CBN in foreign currencies. These reserves are used to back liabilities and influence monetary policy. Given the nature of the Nigeria economy, FX Reserves can appear to have an outsize influence on the economy and hence on the capital market. The chart below allows comparison of FX Reserves against the ASI to make investment decisions
For more detailed analysis,
- On InfoWARE Market Data Terminal <CI> <GO>
- On InfoWARE Finance Mobile App ( Android , iPhone & iPad and Windows 10) , "Research"
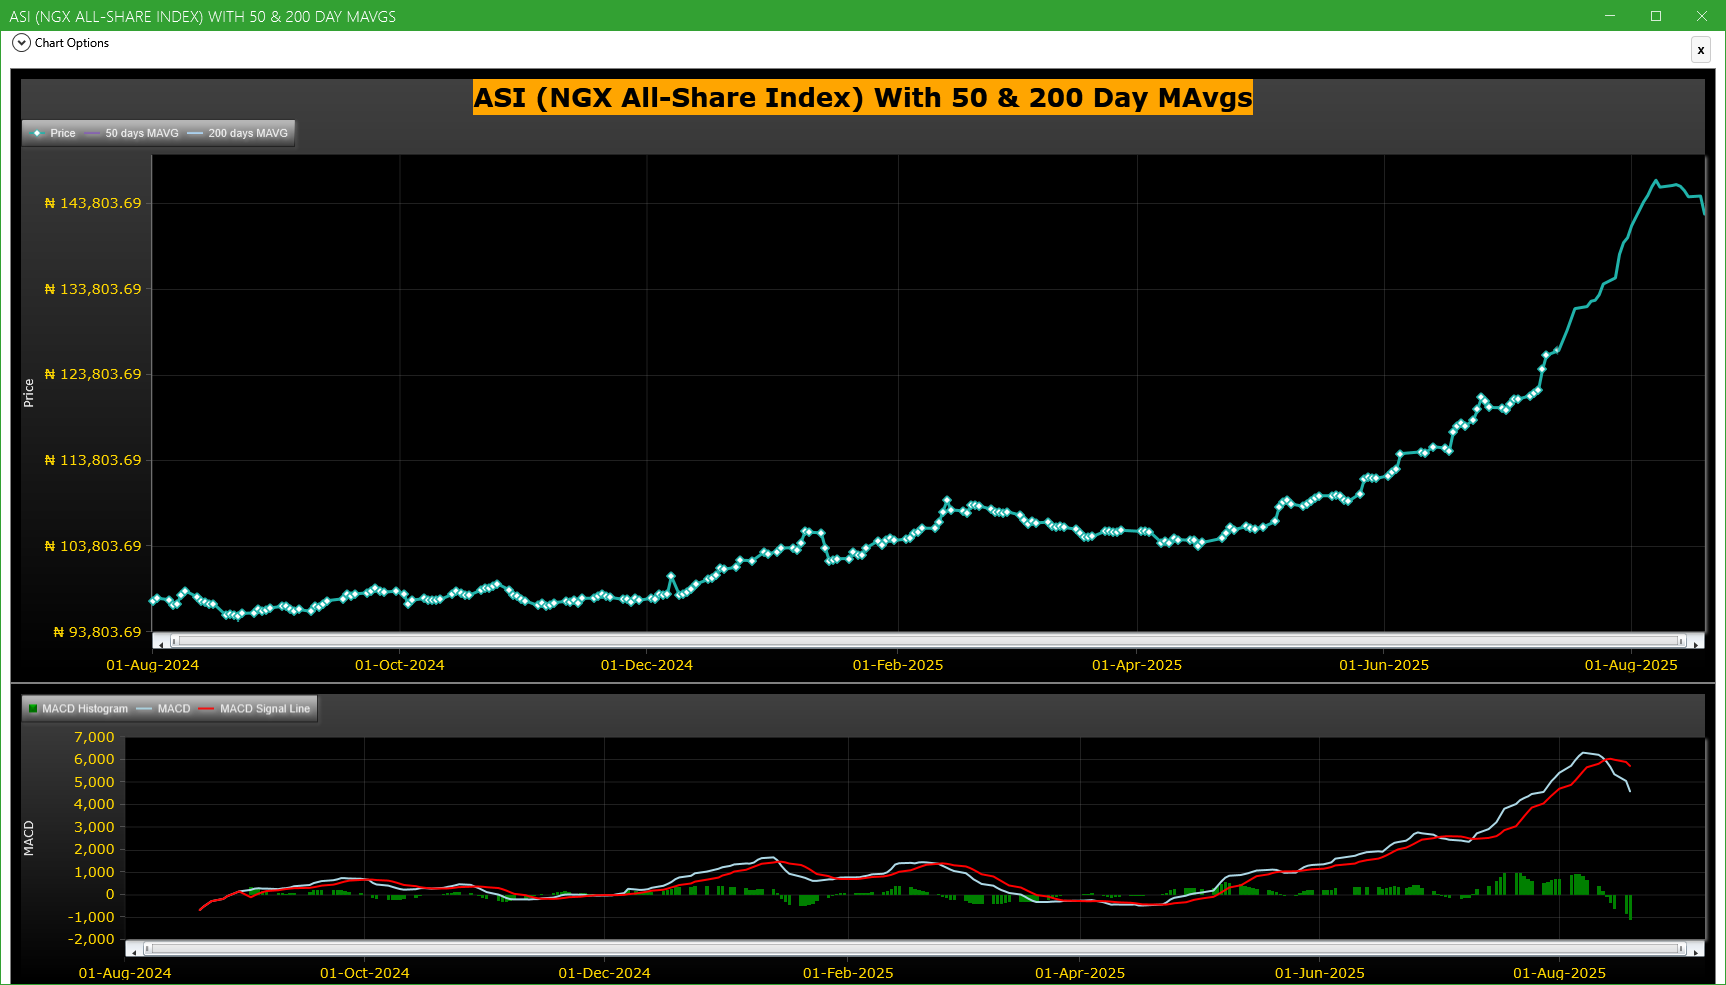
Market Trend - ASI (NGX All-Share-Index) With 50 & 200 Day MAvgs Chart
Technical traders typically use the 50 & 200 day moving averages to aid in choosing
where to enter or exit a position, which then causes these levels to act as strong
support or resistance. As a general guideline, if the price is above a moving average,
the trend is up. If the price is below a moving average, the trend is down.
It is important to note that critics of technical analysis say that moving averages act
as support and resistance because so many traders use these indicators to inform their
trading decisions. Also moving averages tend to work quite well in strong trending conditions
but poorly in choppy or ranging conditions.
Trading Strategies: Crossovers
Crossovers are one of the main moving average strategies. The first type is a price crossover,
which is when the price crosses above or below a moving average to signal a potential change
in trend. Another strategy is to apply two moving averages to a chart: one longer and one
shorter. When the shorter-term MA crosses above the longer-term MA, it is a buy signal, as
it indicates that the trend is shifting up. This is known as a golden cross. Meanwhile, when
the shorter-term MA crosses below the longer-term MA, it is a sell signal, as it indicates that
the trend is shifting down. This is known as a dead/death cross
For more detailed analysis,
- On InfoWARE Market Data Terminal <CI> <GO>
- On InfoWARE Finance Mobile App ( Android , iPhone & iPad and Windows 10) , "Research"
Unusual Volume: Volume traded is more than double the 90 day moving average (All exchanges; ASI & ASem). For more detailed analysis,
- On InfoWARE Market Data Terminal <UV> <GO>
- On InfoWARE Finance Mobile App ( Android , iPhone & iPad and Windows 10)
| Symbol | Name | Volume | 90DAvgVol | %VolChg | Price | LClose | %Chg | Trades | Value |
|---|---|---|---|---|---|---|---|---|---|
| UNIVINSURE | UNIVERSAL INSURANCE COMPANY PLC | 130.22M | 49.79M | 161.55 | 1.31 | 1.34 | -2.24 | 605 | 173.67M |
| AIICO | AIICO INSURANCE PLC. | 100.11M | 34.75M | 188.06 | 4.30 | 4.18 | 2.87 | 1,714 | 437.56M |
| MBENEFIT | MUTUAL BENEFITS ASSURANCE PLC. | 68.52M | 16.18M | 323.51 | 4.30 | 4.23 | 1.65 | 854 | 310.65M |
| PRESTIGE | PRESTIGE ASSURANCE CO. PLC. | 66.87M | 12.18M | 448.88 | 1.97 | 2.16 | -8.80 | 387 | 135.37M |
| REGALINS | REGENCY ALLIANCE INSURANCE COMPANY PLC | 46.14M | 13.76M | 235.34 | 1.49 | 1.49 | 0.00 | 442 | 69.26M |
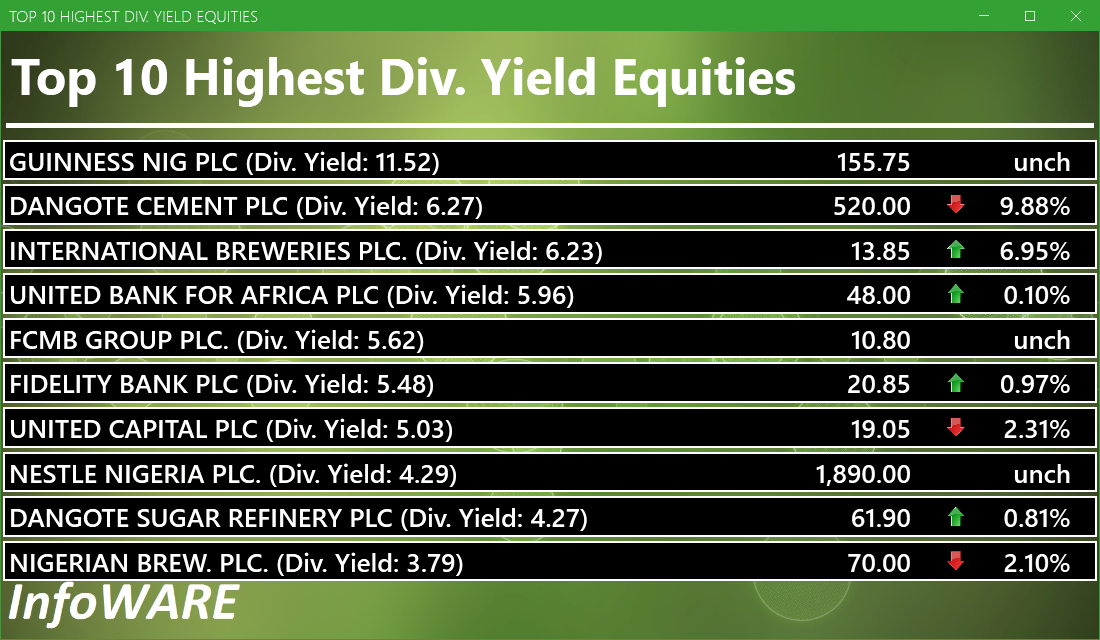
Investment Insights - High Div. Stocks
Dividend stocks distribute a portion of the company earnings to investors on a regular basis and they can a great choice for investors looking for regular income. As an investment or trading strategy, high dividend yield equities provide annual cash payments as against mostly capital gains in the price of a stock. The list in the table below represent the highest dividend paying stocks from the list of the most liquid stocks in the NSE top 30.
For more detailed analysis,
- On InfoWARE Market Data Terminal <HYIELD> <GO>
- On InfoWARE Finance Mobile App ( Android , iPhone & iPad and Windows 10) , "Research"
African Markets
| Name | LClose | Change | %Chg |
|---|---|---|---|
| BRVM Stock Exchange | 315.82 | 1.04 | 0.33 |
| Botswana Stock Exchange | 10,553.06 | 0.00 | 0.00 |
| Egyptian Exchange | 35,824.78 | -147.49 | -0.41 |
| Ghana Stock Exchange | 7,416.03 | 3.71 | 0.05 |
| Johannesburg Stock Exchange | 101,142.62 | -805.39 | -0.79 |
| Lusaka Stock Exchange | 22,280.24 | 163.66 | 0.74 |
| Casablanca Stock Exchange | 19,745.09 | -99.22 | -0.50 |
| Malawi Stock Exchange | 449,657.93 | 0.00 | 0.00 |
| Nigeria Stock Exchange | 144,722.47 | 101.23 | 0.07 |
| Nairobi Securities Exchange | 166.34 | 0.68 | 0.41 |
| Namibian Stock Exchange | 1,795.40 | -16.49 | -0.91 |
| Rwanda Stock Exchange | 178.99 | 8.70 | 5.11 |
| Tunis Stock Exchange | 11,816.92 | -22.49 | -0.19 |
| Uganda Securities Exchange | 1,396.84 | 15.33 | 1.11 |
Nigeria Market Indexes
| Symbol | LClose | %Chg | WTD% | MTD% | QTD% | YTD% | MktCap | Trades |
|---|---|---|---|---|---|---|---|---|
| ASI | 142,613.47 | -1.46 | -1.46 | 0.96 | 19.10 | 38.22 | 32,665 | |
| NGX30 | 5,199.52 | -1.43 | -1.43 | 0.27 | 10.07 | 36.30 | 14,311 | |
| NGXAFRBVI | 3,587.35 | -2.86 | -2.86 | -5.95 | 1.24 | 44.61 | 5,270 | |
| NGXAFRHDYI | 23,042.90 | -1.73 | -1.73 | -0.78 | 10.18 | 35.33 | 6,452 | |
| NGXASEM | 1,538.10 | 0.00 | 0.00 | 6.34 | -3.57 | -2.88 | 12 | |
| NGXBNK | 1,546.22 | -2.06 | -2.06 | -4.49 | 2.35 | 42.19 | 6,327 | |
| NGXCG | 4,119.96 | -1.68 | -1.68 | -4.22 | 19.81 | 45.62 | 14,371 | |
| NGXCNSMRGDS | 3,247.70 | 0.57 | 0.57 | 9.11 | -6.37 | 87.26 | 3,718 | |
| NGXCOMMDTY | 1,070.04 | 0.00 | 0.00 | -2.36 | 2.18 | 7.00 | ||
| NGXGROWTH | 11,187.09 | 0.50 | 0.50 | 1.08 | 17.64 | 44.11 | 394 | |
| NGXINDUSTR | 5,207.17 | -4.37 | -4.37 | 3.00 | 47.81 | 45.79 | 2,165 | |
| NGXINS | 1,369.51 | -3.86 | -3.86 | 54.41 | 85.42 | 74.20 | 6,693 | |
| NGXLOTUSISLM | 11,650.82 | -1.96 | -1.96 | 0.22 | 21.69 | 67.21 | 4,409 | |
| NGXMAINBOARD | 6,927.72 | -0.23 | -0.23 | 4.35 | 17.44 | 38.44 | 26,026 | |
| NGXMERIGRW | 10,040.44 | -1.41 | -1.41 | -2.61 | 4.02 | 53.92 | 4,099 | |
| NGXMERIVAL | 13,826.35 | -1.88 | -1.88 | -4.82 | 15.72 | 32.56 | 7,363 | |
| NGXOILGAS | 2,382.87 | -0.68 | -0.68 | -2.21 | -0.39 | -12.11 | 376 | |
| NGXPENBRD | 2,632.49 | -1.67 | -1.67 | 1.01 | 14.49 | 43.72 | 25,346 | |
| NGXPENSION | 6,737.89 | -1.45 | -1.45 | -2.55 | 6.03 | 48.61 | 16,122 | |
| NGXPREMIUM | 14,054.94 | -3.65 | -3.65 | -4.82 | 22.54 | 44.41 | 6,245 | |
| NGXSOVBND | 671.46 | 0.00 | 0.00 | -0.21 | 2.75 | 11.62 | 0 |
For more detailed analysis,
- On InfoWARE Market Data Terminal <MKTINS> <GO>
- On InfoWARE Finance Mobile App ( Android, iPhone & iPad and Windows 10) , "Market Indexes"
Find the topic interesting? Will like to comment? Contact Us at solutions@infowarelimited.com
Top News

Chart Of The Day - ASI Chart Vs ASI Advance Decline Line (YTD) (20-Aug-2025 15:07:17.943)
InfoWARE AI Analyst Daily Market Report: 20-Aug-2025

[PZ]>>Notice of Meeting -<P Z CUSSONS NIGERIA PLC.>
[CHAMPION]>>Corporate Disclosures-<CHAMPION BREW. PLC.>
[VETINDETF]>> DAILY INDICATIVE PRICES
[MERGROWTH]>> DAILY INDICATIVE PRICES
[XNSA]>> CORDROS MILESTONE FUNDS' BID & OFFER PRICES
[XNSA]>> REGISTRATION FOR BATCH TWO- 2025 DEALING CLERKSHIP CERTIFICATION PROGRA
[XNSA]>> NGX NON-INTEREST FINANCE BOARD LAUNCH COMMUNIQUE
[XNSA]>> UPDATED- SAVE THE DATE: 29TH ANNUAL STOCKBROKERS CONFERENCE
[XNSA]>> RESIGNATION OF MANAGING DIRECTOR (SUPRA COMMERCIAL TRUST LIMITED)
[XNSA]>> RESIGNATION OF DIRECTORS (PREMIUM CAPITAL AND STOCKBROKERS LIMITED)
Chart Of The Day - ASI Chart Vs ASI Advance Decline Line (YTD) (19-Aug-2025 15:07:20.125)
InfoWARE AI Analyst Daily Market Report: 19-Aug-2025
[XNSA]>> CORDROS MILESTONE FUNDS' BID & OFFER PRICES
[XNSA]>> NGX FIXED INCOME INDICATIVE PRICE LIST FOR AUGUST 15, 2025
[MERGROWTH]>> DAILY INDICATIVE PRICES
[VSPBONDETF]>> DAILY INDICATIVE PRICES
[JAIZBANK]>>Corporate Disclosures-<JAIZ BANK PLC>
[XNSA]>> REGISTRATION FOR BATCH TWO- 2025 DEALING CLERKSHIP CERTIFICATION PROGRA
[XNSA]>> NGX NON-INTEREST FINANCE BOARD LAUNCH COMMUNIQUE
[XNSA]>> SAVE THE DATE: 29TH ANNUAL STOCKBROKERS CONFERENCE
[XNSA]>> DAILY FUND PRICE SUBMISSION - FCMB ASSET MANAGEMENT LIMITED
[FTNCOCOA]>>Notice of Meeting -<FTN COCOA PROCESSORS PLC>
[LINKASSURE]>>Corporate Disclosures-<LINKAGE ASSURANCE PLC>
Chart Of The Day - ASI Chart Vs ASI Advance Decline Line (YTD) (18-Aug-2025 15:12:19.768)
InfoWARE AI Analyst Daily Market Report: 18-Aug-2025
[XNSA]>> OFF MARKET TRADE
[XNSA]>> NGX FIXED INCOME INDICATIVE PRICE LIST FOR AUGUST 15, 2025
[MERVALUE]>> DAILY INDICATIVE PRICES
Get IDIA - the stock trading app for the modern investor
Solutions by Business
Product Suites
Company
Contacts
- 8th Floor,
- South Atlantic Petroleum Towers,
- 1 Adeola Odeku Street,
- Victoria Island,
- Lagos, Nigeria.
- Email: solutions@infowarelimited.com
Follow Us
 |
 |
 |
 |