


InfoWARE AI Analyst Daily Market Report: 20-Aug-2025 | InfoWARE Finance
Get IDIA - the stock trading app for the modern investor


InfoWARE AI Analyst Daily Market Report: 20-Aug-2025
(Source: InfoWARE Terminal, Date: 20-Aug-2025)
Dear Investor,
NGX Daily Market Summary – Wednesday, August 20, 2025
The NGX All Share Index (ASI) slid -0.73% today, closing at 142,613.47 amid a sharp 26.47% drop in turnover. Advancers were overshadowed by 57 decliners versus only 20 gainers, as overall market breadth plummeted to 0.35x—strongly favouring bears. The currency market wasn't spared, with the Naira weakening -0.36% to 1,534 per USD. While high-flyers like AUSTINLAZ (+10.00%) and ENAMELWA (+8.64%) provided pockets of strength, the day was dominated by heavy-volume declines, especially in previously high-momentum stocks like CHAMPION (-9.97%) and GUINNESS (-9.98%). Institutional activity remained dominant, but both trade value and volume contracted, echoing caution across the board.
Key Market Trends
-
Market Breadth: Broad-based selling with only 20 stocks advancing and 57 declining (breadth ratio 0.35x).
- Volume was up in 61 stocks but down in 81—despite the overall shrinkage in turnover.
- Turnover: Traded value dropped -26.47% vs. previous day to ₦12.27B. Less risk-on appetite from both institutional and retail players.
- Momentum & Volume Surges: Several notable price swings accompanied by unusual volume in CHAMPION, ROYALEX, REGALINS, DEAPCAP, TIP.
Top Gainers (Today)
| Stock | Price | % Change | RSI | MACD | 15D/50D MA | Comments |
|---|---|---|---|---|---|---|
| AUSTINLAZ | 2.64 | 10.00% | 61.5 | 0.007 → -0.004 | 2.30/2.26 | Steady bullish action with healthy RSI, confirming further upside possible. |
| CHAMPION | 19.74 | 9.97% | 66.0 | 1.53 → 1.24 | 15.72/12.59 | High RSI; today’s gain reverses on huge volume, but see "Contrarian Signals." |
| NCR | 9.55 | 9.77% | 96.7 | 0.55 → 0.45 | 8.02/6.72 | RSI in overbought territory—watch for sustainability warning. |
| MULTIVERSE | 11.10 | 8.82% | 58.8 | 0.12 → 0.15 | 10.19/9.57 | Momentum reversal: back in focus after previous consolidation. |
| ENAMELWA | 39.00 | 8.64% | 98.3 | 3.09 → 2.72 | 31.37/23.70 | One of strongest YTD gainers; RSI is extremely overbought. |
Top Losers (Today)
| Stock | Price | % Change | RSI | MACD | 15D/50D MA | Comments |
|---|---|---|---|---|---|---|
| GUINNESS | 140.20 | -9.98% | 99.6 | 16.15 → 14.27 | 141.65/107.79 | Extreme RSI, heavy MACD—short-term capitulation risk or reversal soon? |
| CONOIL | 211.10 | -9.98% | 0.02 | -1.83 → -2.65 | 232.94/234.85 | RSI near zero: highly oversold; technical bounce watch. |
| CONHALLPLC | 4.35 | -9.94% | 62.5 | 0.48 → 0.40 | 4.35/3.48 | Next support at recent swing lows. |
| ROYALEX | 2.27 | -9.92% | 61.2 | 0.40 → 0.35 | 2.32/1.52 | High volume, two days of breakdown. |
| ELLAHLAKES | 14.90 | -9.81% | 68.6 | 1.98 → 1.63 | 13.52/9.78 | Year-low approaching. |
YTD Top 5 Gainers & Losers (Wednesday Special)
| YTD Top Gainers | YTD Top Losers | ||||||||||
|---|---|---|---|---|---|---|---|---|---|---|---|
| Stock | Price | % YTD | RSI | DivY | Sector | Stock | Price | % YTD | RSI | DivY | Sector |
| ENAMELWA | 35.90 | +102.07% | 98.3 | 2.33 | Consumer | NEM | 28.00 | +117.50% | 51.2 | 6.52 | Insurance |
| DAARCOMM | 1.23 | +113.11% | 91.2 | 0.00 | Media | LASACO | 3.60 | -2.65% | 50.6 | 4.05 | Insurance |
| CAVERTON | 7.20 | +186.27% | 52.9 | 5.52 | Transport | VETGOODS | 32.00 | +88.95% | 50.6 | 0.00 | ETF |
| CHAMPION | 17.95 | +418.11% | 66.0 | 0.41 | Beverages | STANBIC | 97.40 | +63.79% | 43.6 | 3.54 | Banking |
| MULTIVERSE | 10.20 | +37.88% | 58.8 | 0.85 | Mining | STANBICETF30 | 450.00 | +17.89% | 41.5 | 0.00 | ETF |
Notable Themes & Patterns
-
Sector Divergence:
- Consumer companies (ENAMELWA up +102% YTD) and select Media (DAARCOMM +113% YTD) maintain strong uptrends, but overbought signals (RSI > 70) warn of exhaustion.
- Banks remain heavily traded by institutions (ZENITHBANK, GTCO, UBA) but show mixed short-term signals.
-
Bullish Momentum:
- Stocks trading above 15DMA: AFRIPRUD (dividend yield 1.27%, Beta 0.64), and LEGENDINT show early accumulation.
- High volume + strong price = key for next leg up (e.g., AUSTINLAZ, ENAMELWA, NCR).
-
Bearish Momentum:
- NGX Mainboard Index, DANGSUGAR, ROYALEX, CUSTODIAN—all breaking below 15DMA with negative RSI drift, confirming sector-wide pessimism.
- VERITASKAP, WAPIC, MCNICHOLS, INTBREW: Volume and RSI trends warn of possible new legs down.
-
Volume Abnormalities:
- CHAMPION: 538% above 90DMA, hints at forced liquidation or panic-selling to new hands.
- ROYALEX, REGALINS, DEAPCAP, TIP all saw volume more than double 90-day averages, often a precursor to trend reversals or continued high volatility.
Contrarian Signals (Conflicting Indicators)
- CHAMPION: RSI ~66, bullish MACD, but suffered a -9.8% YTD drop and was a top loser on huge volume. Such divergence suggests whipsaw risk—watch for fast rebounds or deepening correction.
- ENAMELWA: Massive YTD gain +102%, extreme overbought RSI (98.3), price up sharply today. A textbook case of overextension with potential for short-term profit taking.
- CONOIL: RSI virtually zero, huge sell-off, but medium/long-term uptrend still intact on some moving averages—selling climax may precede relief rally.
- GUINNESS: RSI 99.6 after sharp drop—contrarian watch for technical rebound.
Sector Heatmap & Technicals
| Sector | Total Trades | % Movers Up | % Movers Down | Instit Activity | Ret. Activity | Tech Trend |
|---|---|---|---|---|---|---|
| Banking | 3,204 | 41% | 59% | Sustained | High | Losing steam—mixed |
| Consumer | 604 | 60% | 40% | Moderate | Moderate | Momentum, but overbought |
| Insurance | 2,444 | 25% | 75% | Low | High | Bearish |
| ETF/Specialty | 132 | 30% | 70% | Low | Low | Bearish to Neutral |
| Tech/Growth | 115 | 56% | 44% | Low | Low | Emerging Bullish |
Dividend–Beta Matrix: Defensive Screening
| Stock | Div Yield (%) | Beta | Bullish/Bearish? | Commentary |
|---|---|---|---|---|
| AFRIPRUD | 1.27 | 0.64 | Bullish (above 15DMA) | Attractive for defensive yield-seekers; low beta should buffer downside; watch for further buy signals. |
| DANGSUGAR | 4.27 | 1.35 | Bearish (below 15DMA) | High dividend but erratic short-term pressure; only for patient investors. |
| CILEASING | 1.20 | -0.08 | Bearish (below 15DMA) | Yield not high enough to offset momentum loss—best avoided for now. |
| MCNICHOLS | 5.88 | -0.11 | Bearish (below 15DMA) | High yield but at risk of further sell-off; potential trap for yield chasers. |
Institutional Clustering Alerts
- ZENITHBANK: 20.17% of institutional trade value share—clear focus for big funds. Recent reduced volume (-44% vs 90DMA) may hint sector is getting crowded/ripe for rotation.
- CHAMPION: 7.05% institutional volume; huge moves suggest both forced liquidations and potentially smart money positioning quietly ahead of reversal.
Stocks with High Dividend Yield in Bullish/Bearish Tables
- AFRIPRUD (1.27% yield, Bullish Momentum): Attractive for yield and capital gain; overlays well for defensive, income-driven strategies.
- MCNICHOLS (5.88% yield, Bearish Momentum): High yield but technical breakdowns suggest possible "value trap." High-yield with negative price action often signals stress—proceed with caution.
- WAPIC (2.56% yield, Bearish Momentum): Similarly, attractive yield but breakdown through moving averages; only attractive on mean-reversion setups.
Suggestions for Traders
-
For Bulls:
- AUSTINLAZ, ENAMELWA, AFRIPRUD: Watch for technical pullbacks as possible entries, but don't chase if RSI over 85.
- NCR: Momentum may persist but trailing stop-losses advisable due to overbought signals.
-
For Bears:
- GUINNESS, CONOIL, ROYALEX: Possible oversold technical bounces are likely, but breakdown players may ride continued weakness for quick scalps.
-
Watch List:
- Stocks with abnormal volumes (CHAMPION, REGALINS, DEAPCAP, TIP): Look for signs of capitulation/reversal.
- Stocks exhibiting both high dividend and stable technicals (AFRIPRUD, DANGSUGAR): Good for medium-term positioning.
Market Activity/Trades Insight
-
Institutional dominance:
- Institutions executed 42.11% of trades and a commanding 81.87% of value (₦10.59B). Volume: 60.51% of total, confirming concentration in key blue-chips.
- Retail: 57.89% of trades but only 18.13% of value. Retail chases small/micro-cap action (see REGALINS, DEAPCAP, TIP).
- Top 5 most traded stocks (Institutional): ZENITHBANK, GTCO, CHAMPION, MTNN, UBA—all classic blue chips, matched by heavy volume but with receding short-term momentum.
- Top 5 most traded stocks (Retail): GTCO, UBA, ZENITHBANK, AIICO, MTNN—overlap with institutional focus on GTCO, UBA, ZENITHBANK, confirming these are the real liquidity battlegrounds.
- Pattern: Both institutions and retails center activity in top banks and MTNN, but retail also reached for speculative insurance/finance names today.
- Actionable Insight: When institutional and retail flows jointly dominate in the same stocks (GTCO, UBA, ZENITHBANK), short-term volatility can be extreme. Liquidity works both ways—be quick to adapt to turnarounds.
- Caution: Falling turnover and negative breadth often precede new market legs down. Stay nimble, use stops, and consider hedging.
Summary Table: Overlapping Momentum, Volume, Yields
| Stock | Bullish MA? | Unusual Vol? | RSI | Div Yield | Comment |
|---|---|---|---|---|---|
| AFRIPRUD | YES | No | NA | 1.27 | Defensive, stable yield, upside bias. |
| CHAMPION | YES | YES | 66.0 | 0.41 | Contrarian: High volume, conflicting signals. |
| ENAMELWA | YES | No | 98.3 | 2.33 | Overbought, but trend unbroken. |
| ROYALEX | No (Bearish) | YES | 61.2 | 7.81 | Breakdown on volume; dividend may not compensate for risk. |
| MCNICHOLS | No (Bearish) | YES | NA | 5.88 | Yield trap? Extreme risk. |
Final Takeaway
-
Momentum names are overbought and due for volatility; bears are emboldened by weak breadth and falling turnover.
- High-dividend + low beta stocks (AFRIPRUD) merit closer attention for rotation if broader correction accelerates, while yield traps (MCNICHOLS, WAPIC) should be shunned unless tactical entries are planned.
- Caution remains warranted as institutional and retail interests align in the largest banks—expect volatility, potential for whipsaws, and short squeezes.
- Watch list for Thursday: Pay attention to price action in ENAMELWA, CHAMPION, AFRIPRUD, and any new volume spikes in mid-tier names as the market navigates lower liquidity and broad risk-off sentiment.
|
Top ASI Gainers Over Last 5 Trading Days
|
Top ASI Losers Over Last 5 Trading Days
|
For more detailed analysis, on InfoWARE Market Data Terminal <NSEPERF> <GO>
On InfoWARE Finance Mobile App (Android, iPhone & iPad, Windows Phone and Windows 8/10), "Top Gainers & Losers"
AUSTIN LAZ & COMPANY PLC (AUSTINLAZ) topped the advancers list closing at N2.64 with a gain of 10.00% followed by CHAMPION BREW. PLC. (CHAMPION) which closed at N19.74 with a gain of 9.97%.
On the flip side GUINNESS NIG PLC (GUINNESS) and CONOIL PLC (CONOIL) topped the decliners log with a loss of -9.98% at a close of N140.20, and -9.98% to close the day at N211.10 respectively.
| Symbol | LClose | %Chg |
|---|---|---|
| AUSTINLAZ | 2.64 | 10.00 |
| CHAMPION | 19.74 | 9.97 |
| NCR | 9.55 | 9.77 |
| MULTIVERSE | 11.10 | 8.82 |
| ENAMELWA | 39.00 | 8.64 |
| Symbol | LClose | %Chg |
|---|---|---|
| GUINNESS | 140.20 | -9.98 |
| CONOIL | 211.10 | -9.98 |
| CONHALLPLC | 4.35 | -9.94 |
| ROYALEX | 2.27 | -9.92 |
| ELLAHLAKES | 14.90 | -9.81 |
For more detailed analysis,
- On InfoWARE Market Data Terminal <TOPG> <GO>
- On InfoWARE Finance Mobile App ( Android, iPhone & iPad and Windows 10) , "Top Gainers & Losers"
Currency Market
In the currency market, the Naira fell 0.36%(-5.45) against the Dollar to settle at 1 to 1NSE: Bull Signal - Price crossed above 15 Day MA
This signal implies these stocks are under buying pressure and the price might continue to rise and therefore positions should be monitored closely. Further suggested analysis include looking at the overall market (ASI) to see if the uptrend is market wide, sector wide or specific to the stock. Portfolio managers tend to use this as a signal to do more research to add to their positions or lock in some profits. Typically further analysis should be done using commands like PC and RV on the InfoWARE Market Data Terminal. Another command is ALERTS to set price triggers for possible exit or entry as necessary
For more detailed analysis,
- On InfoWARE Market Data Terminal <NSEPERF> <GO>
- On InfoWARE Finance Mobile App ( Android , iPhone & iPad and Windows 10) , "Top Gainers & Losers"
NSE: BEAR Signal - Price crossed below 15 Day MA
This signal implies these stocks are under selling pressure and the price might continue to slide and therefore positions should be monitored closely. Further suggested analysis include looking at the overall market (ASI) to see if the downtrend is market wide, sector wide or specific to the stock. If the overal market trend is upwards, then since these stocks are heading in the opposite direction, then further analysis should be done using commands like PC and RV on the InfoWARE Market Data Terminal. Another command is ALERTS to set price triggers for possible exit is necessar
For more detailed analysis,
- On InfoWARE Market Data Terminal <BEARM> <GO>
- On InfoWARE Finance Mobile App ( Android , iPhone & iPad and Windows 10)
| Symbol | Price | %Chg | 15DMA | PE | EPS | DivY | MktCap | Vol | Trades | Value | LstTradeTime |
|---|---|---|---|---|---|---|---|---|---|---|---|
| NGXMAINBOARD | 6,847.11 | -1.18 | 6,875.45 | 12.90 | 225.05 | 0.00 | 0.00 | 633.80M | 21,283.00 | 7.96B | 20-Aug-2025 14:30:41.550 |
| VETINDETF | 52.50 | -3.05 | 52.53 | 0.00 | 0.00 | 121.00 | 3.00 | 6.41K | 20-Aug-2025 14:31:26.913 | ||
| TANTALIZER | 2.60 | -3.85 | 2.62 | 0.00 | 0.00 | 1.50 | 8.35B | 21.64M | 104.00 | 55.00M | 20-Aug-2025 14:30:27.920 |
| MAYBAKER | 18.05 | -4.16 | 18.12 | 58.94 | 0.14 | 3.75 | 31.14B | 2.57M | 100.00 | 44.29M | 20-Aug-2025 14:30:25.980 |
| FGSUK2033S6 | 95.00 | -4.21 | 97.76 | 0.00 | 0.00 | 200.00 | 5.00 | 190.49K | 20-Aug-2025 14:31:33.313 | ||
| VETBANK | 15.35 | -4.23 | 15.59 | 0.00 | 0.00 | 2.11K | 3.00 | 33.84K | 20-Aug-2025 14:31:26.853 | ||
| CILEASING | 7.15 | -4.90 | 7.27 | 6.50 | 0.64 | 1.20 | 5.59B | 432.10K | 55.00 | 3.07M | 20-Aug-2025 14:30:22.587 |
| DANGSUGAR | 59.00 | -4.92 | 60.61 | 11.48 | 3.06 | 4.27 | 716.67B | 5.27M | 753.00 | 317.52M | 20-Aug-2025 14:30:23.793 |
| CUSTODIAN | 38.05 | -5.12 | 39.72 | 3.80 | 3.29 | 1.20 | 223.80B | 605.91K | 100.00 | 23.49M | 20-Aug-2025 14:30:22.860 |
| VERITASKAP | 2.00 | -7.50 | 2.04 | 48.77 | 0.02 | 4.17 | 27.73B | 36.76M | 375.00 | 72.08M | 20-Aug-2025 14:31:25.877 |
| MCNICHOLS | 3.50 | -8.00 | 3.53 | 26.80 | 0.05 | 5.88 | 2.52B | 4.39M | 81.00 | 16.36M | 20-Aug-2025 14:31:31.383 |
| NSLTECH | 0.96 | -9.38 | 0.98 | 0.00 | 0.00 | 15.87 | 5.41B | 4.72M | 126.00 | 4.65M | 20-Aug-2025 14:30:26.877 |
| WAPIC | 3.26 | -10.43 | 3.35 | 72.55 | 0.02 | 2.56 | 78.21B | 5.81M | 211.00 | 19.38M | 20-Aug-2025 14:30:29.150 |
| INTBREW | 12.50 | -10.80 | 13.37 | 0.00 | 0.00 | 6.23 | 335.78B | 6.06M | 232.00 | 77.59M | 20-Aug-2025 14:30:25.373 |
| ROYALEX | 2.27 | -11.01 | 2.32 | 0.00 | 0.00 | 7.81 | 11.68B | 46.15M | 183.00 | 105.15M | 20-Aug-2025 14:30:27.250 |
| GUINNESS | 140.20 | -11.09 | 141.65 | 31.75 | 1.95 | 11.52 | 307.09B | 243.57K | 63.00 | 34.15M | 20-Aug-2025 14:30:24.973 |
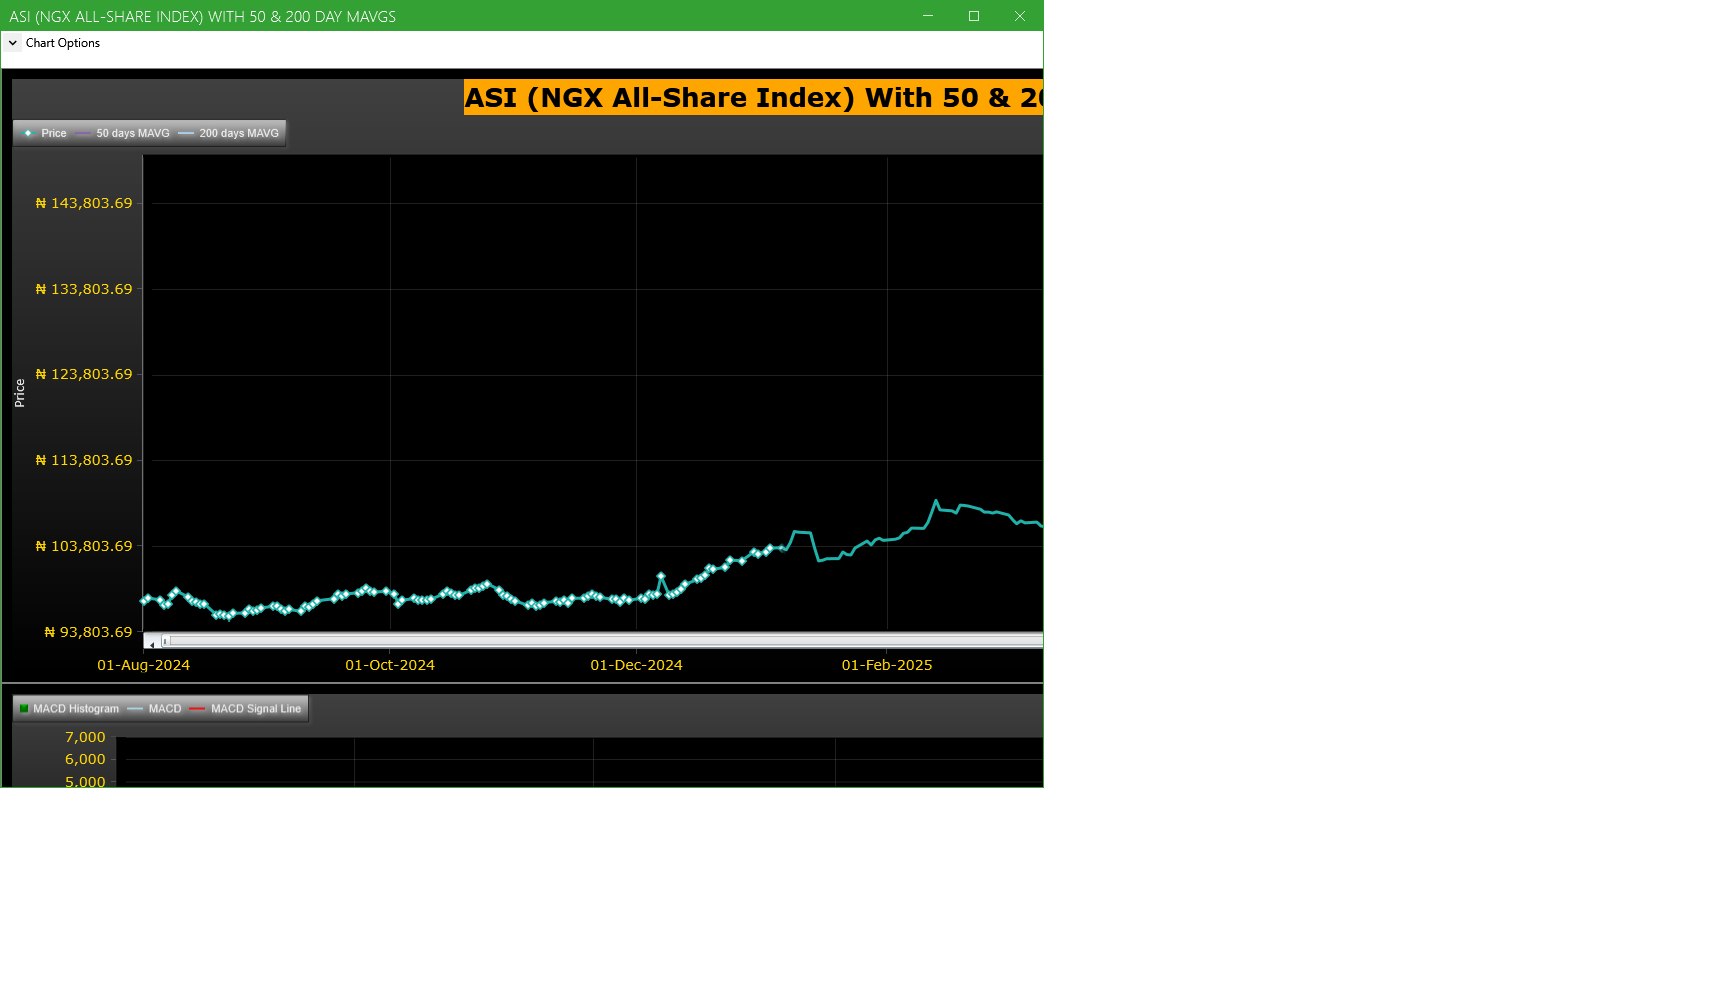
Market Trend - ASI (NGX All-Share-Index) With 50 & 200 Day MAvgs Chart
Technical traders typically use the 50 & 200 day moving averages to aid in choosing
where to enter or exit a position, which then causes these levels to act as strong
support or resistance. As a general guideline, if the price is above a moving average,
the trend is up. If the price is below a moving average, the trend is down.
It is important to note that critics of technical analysis say that moving averages act
as support and resistance because so many traders use these indicators to inform their
trading decisions. Also moving averages tend to work quite well in strong trending conditions
but poorly in choppy or ranging conditions.
Trading Strategies: Crossovers
Crossovers are one of the main moving average strategies. The first type is a price crossover,
which is when the price crosses above or below a moving average to signal a potential change
in trend. Another strategy is to apply two moving averages to a chart: one longer and one
shorter. When the shorter-term MA crosses above the longer-term MA, it is a buy signal, as
it indicates that the trend is shifting up. This is known as a golden cross. Meanwhile, when
the shorter-term MA crosses below the longer-term MA, it is a sell signal, as it indicates that
the trend is shifting down. This is known as a dead/death cross
For more detailed analysis,
- On InfoWARE Market Data Terminal <CI> <GO>
- On InfoWARE Finance Mobile App ( Android , iPhone & iPad and Windows 10) , "Research"
Unusual Volume: Volume traded is more than double the 90 day moving average (All exchanges; ASI & ASem). For more detailed analysis,
- On InfoWARE Market Data Terminal <UV> <GO>
- On InfoWARE Finance Mobile App ( Android , iPhone & iPad and Windows 10)
| Symbol | Name | Volume | 90DAvgVol | %VolChg | Price | LClose | %Chg | Trades | Value |
|---|---|---|---|---|---|---|---|---|---|
| CHAMPION | CHAMPION BREW. PLC. | 54.52M | 8.55M | 537.97 | 19.74 | 17.95 | 9.97 | 448 | 988.28M |
| ROYALEX | ROYAL EXCHANGE PLC. | 46.15M | 20.59M | 124.13 | 2.27 | 2.52 | -9.92 | 183 | 105.15M |
| REGALINS | REGENCY ALLIANCE INSURANCE COMPANY PLC | 40.77M | 14.44M | 182.45 | 1.35 | 1.49 | -9.40 | 185 | 55.52M |
| DEAPCAP | DEAP CAPITAL MANAGEMENT & TRUST PLC | 13.65M | 4.12M | 231.14 | 1.75 | 1.94 | -9.79 | 259 | 25.82M |
| TIP | THE INITIATES PLC | 9.78M | 3.09M | 217.08 | 13.00 | 13.00 | 0.00 | 275 | 128.65M |
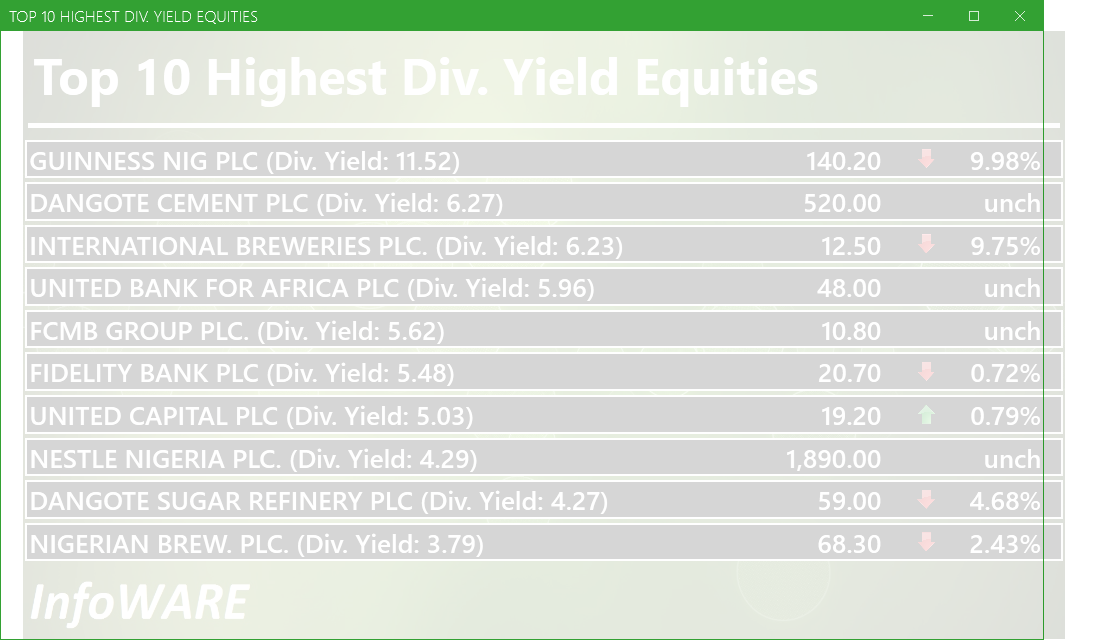
Investment Insights - High Div. Stocks
Dividend stocks distribute a portion of the company earnings to investors on a regular basis and they can a great choice for investors looking for regular income. As an investment or trading strategy, high dividend yield equities provide annual cash payments as against mostly capital gains in the price of a stock. The list in the table below represent the highest dividend paying stocks from the list of the most liquid stocks in the NSE top 30.
For more detailed analysis,
- On InfoWARE Market Data Terminal <HYIELD> <GO>
- On InfoWARE Finance Mobile App ( Android , iPhone & iPad and Windows 10) , "Research"
Investment Insights - Stocks outperforming the ASI but with approximately the same risk
These list of stocks represent equities that are less risky than the ASI but doing better than the ASI (All Shares Index) using the YTD (Year to Date) returns as the measure. The risk is measured by Beta. Beta is an assessment of a stock's tendency to undergo price changes, (its volatility), as well as its potential returns compared to the ASI. It is expressed as a ratio, where a score of 1 represents performance comparable to the ASI, and returns above or below the market may receive scores greater or lower than 1.
For a full list of both positively and negatively corelated stocks visit InfoWARE Market Data Terminal
- On InfoWARE Market Data Terminal <BANL> <GO>
- On InfoWARE Finance Mobile App ( Android , iPhone & iPad and Windows 10)
| Symbol | DivYield | PE | EPS | Beta | %ChgYTD | ASIYTDReturn | BetaDiff |
|---|---|---|---|---|---|---|---|
| HONYFLOUR | 1.40 | 16.28 | 0.31 | 0.99 | 233.09 | 37.20 | 0.01 |
| CAVERTON | 5.52 | 1.15 | 1.57 | 0.98 | 186.27 | 37.20 | 0.02 |
| ROYALEX | 7.81 | 0.00 | 0.00 | 0.96 | 106.36 | 37.20 | 0.04 |
| CORNERST | 5.28 | 8.62 | 0.35 | 0.93 | 76.77 | 37.20 | 0.07 |
| DEAPCAP | 13.76 | 188.84 | 0.01 | 0.89 | 45.83 | 37.20 | 0.11 |
| UNIVINSURE | 0.00 | 0.00 | 0.00 | 0.83 | 66.67 | 37.20 | 0.17 |
| FTNCOCOA | 1.60 | 0.00 | 0.00 | 0.79 | 252.66 | 37.20 | 0.21 |
| NB | 3.79 | 16.95 | 1.60 | 0.79 | 113.44 | 37.20 | 0.21 |
| MAYBAKER | 3.75 | 58.94 | 0.14 | 0.78 | 92.02 | 37.20 | 0.22 |
| UNILEVER | 2.81 | 67.09 | 0.40 | 0.75 | 112.50 | 37.20 | 0.25 |
African Markets
| Name | LClose | Change | %Chg |
|---|---|---|---|
| BRVM Stock Exchange | 317.72 | 1.90 | 0.60 |
| Botswana Stock Exchange | 10,553.06 | 0.00 | 0.00 |
| Egyptian Exchange | 36,100.07 | 275.85 | 0.77 |
| Ghana Stock Exchange | 7,416.16 | 0.00 | 0.00 |
| Johannesburg Stock Exchange | 101,196.15 | 50.57 | 0.05 |
| Lusaka Stock Exchange | 22,685.94 | 405.50 | 1.82 |
| Casablanca Stock Exchange | 19,619.56 | -126.37 | -0.64 |
| Malawi Stock Exchange | 463,499.49 | 13,849.23 | 3.08 |
| Nigeria Stock Exchange | 142,613.47 | -2,113.01 | -1.46 |
| Nairobi Securities Exchange | 166.18 | -0.17 | -0.10 |
| Namibian Stock Exchange | 1,806.90 | 11.49 | 0.64 |
| Rwanda Stock Exchange | 178.99 | 0.00 | 0.00 |
| Tunis Stock Exchange | 11,807.55 | -9.45 | -0.08 |
| Uganda Securities Exchange | 1,404.86 | 7.96 | 0.57 |
Nigeria Market Indexes
| Symbol | LClose | %Chg | WTD% | MTD% | QTD% | YTD% | MktCap | Trades |
|---|---|---|---|---|---|---|---|---|
| ASI | 141,566.28 | -0.73 | -2.18 | 0.21 | 18.23 | 37.20 | 27,358 | |
| NGX30 | 5,165.05 | -0.66 | -2.08 | -0.40 | 9.34 | 35.39 | 12,252 | |
| NGXAFRBVI | 3,538.04 | -1.37 | -4.20 | -7.24 | -0.15 | 42.62 | 5,061 | |
| NGXAFRHDYI | 22,735.90 | -1.33 | -3.04 | -2.11 | 8.71 | 33.52 | 6,286 | |
| NGXASEM | 1,538.10 | 0.00 | 0.00 | 6.34 | -3.57 | -2.88 | 13 | |
| NGXBNK | 1,527.37 | -1.22 | -3.26 | -5.65 | 1.10 | 40.46 | 5,529 | |
| NGXCG | 4,074.80 | -1.10 | -2.76 | -5.27 | 18.50 | 44.03 | 12,223 | |
| NGXCNSMRGDS | 3,186.06 | -1.90 | -1.34 | 7.04 | -8.15 | 83.70 | 3,440 | |
| NGXCOMMDTY | 1,070.08 | 0.00 | 0.00 | -2.36 | 2.18 | 7.01 | ||
| NGXGROWTH | 11,158.28 | -0.26 | 0.24 | 0.82 | 17.34 | 43.74 | 387 | |
| NGXINDUSTR | 5,206.67 | -0.01 | -4.38 | 2.99 | 47.80 | 45.78 | 2,042 | |
| NGXINS | 1,270.84 | -7.20 | -10.79 | 43.28 | 72.06 | 61.65 | 4,051 | |
| NGXLOTUSISLM | 11,625.06 | -0.22 | -2.18 | -0.01 | 21.42 | 66.84 | 4,094 | |
| NGXMAINBOARD | 6,847.11 | -1.16 | -1.39 | 3.13 | 16.07 | 36.83 | 21,283 | |
| NGXMERIGRW | 9,909.50 | -1.30 | -2.69 | -3.88 | 2.67 | 51.91 | 3,595 | |
| NGXMERIVAL | 13,812.18 | -0.10 | -1.98 | -4.91 | 15.60 | 32.42 | 6,107 | |
| NGXOILGAS | 2,385.58 | 0.11 | -0.57 | -2.10 | -0.27 | -12.01 | 385 | |
| NGXPENBRD | 2,618.36 | -0.54 | -2.20 | 0.47 | 13.87 | 42.95 | 20,839 | |
| NGXPENSION | 6,681.70 | -0.83 | -2.27 | -3.37 | 5.15 | 47.37 | 13,831 | |
| NGXPREMIUM | 14,071.37 | 0.12 | -3.53 | -4.71 | 22.68 | 44.57 | 5,688 | |
| NGXSOVBND | 659.52 | -1.78 | -1.78 | -1.98 | 0.92 | 9.64 | 1 |
For more detailed analysis,
- On InfoWARE Market Data Terminal <MKTINS> <GO>
- On InfoWARE Finance Mobile App ( Android, iPhone & iPad and Windows 10) , "Market Indexes"
Find the topic interesting? Will like to comment? Contact Us at solutions@infowarelimited.com
Top News

Chart Of The Day - ASI Chart Vs ASI Advance Decline Line (YTD) (20-Aug-2025 15:07:17.943)
InfoWARE AI Analyst Daily Market Report: 20-Aug-2025

[PZ]>>Notice of Meeting -<P Z CUSSONS NIGERIA PLC.>
[CHAMPION]>>Corporate Disclosures-<CHAMPION BREW. PLC.>
[VETINDETF]>> DAILY INDICATIVE PRICES
[MERGROWTH]>> DAILY INDICATIVE PRICES
[XNSA]>> CORDROS MILESTONE FUNDS' BID & OFFER PRICES
[XNSA]>> REGISTRATION FOR BATCH TWO- 2025 DEALING CLERKSHIP CERTIFICATION PROGRA
[XNSA]>> NGX NON-INTEREST FINANCE BOARD LAUNCH COMMUNIQUE
[XNSA]>> UPDATED- SAVE THE DATE: 29TH ANNUAL STOCKBROKERS CONFERENCE
[XNSA]>> RESIGNATION OF MANAGING DIRECTOR (SUPRA COMMERCIAL TRUST LIMITED)
[XNSA]>> RESIGNATION OF DIRECTORS (PREMIUM CAPITAL AND STOCKBROKERS LIMITED)
Chart Of The Day - ASI Chart Vs ASI Advance Decline Line (YTD) (19-Aug-2025 15:07:20.125)
InfoWARE AI Analyst Daily Market Report: 19-Aug-2025
[XNSA]>> CORDROS MILESTONE FUNDS' BID & OFFER PRICES
[XNSA]>> NGX FIXED INCOME INDICATIVE PRICE LIST FOR AUGUST 15, 2025
[MERGROWTH]>> DAILY INDICATIVE PRICES
[VSPBONDETF]>> DAILY INDICATIVE PRICES
[JAIZBANK]>>Corporate Disclosures-<JAIZ BANK PLC>
[XNSA]>> REGISTRATION FOR BATCH TWO- 2025 DEALING CLERKSHIP CERTIFICATION PROGRA
[XNSA]>> NGX NON-INTEREST FINANCE BOARD LAUNCH COMMUNIQUE
[XNSA]>> SAVE THE DATE: 29TH ANNUAL STOCKBROKERS CONFERENCE
[XNSA]>> DAILY FUND PRICE SUBMISSION - FCMB ASSET MANAGEMENT LIMITED
[FTNCOCOA]>>Notice of Meeting -<FTN COCOA PROCESSORS PLC>
[LINKASSURE]>>Corporate Disclosures-<LINKAGE ASSURANCE PLC>
Chart Of The Day - ASI Chart Vs ASI Advance Decline Line (YTD) (18-Aug-2025 15:12:19.768)
InfoWARE AI Analyst Daily Market Report: 18-Aug-2025
[XNSA]>> OFF MARKET TRADE
[XNSA]>> NGX FIXED INCOME INDICATIVE PRICE LIST FOR AUGUST 15, 2025
[MERVALUE]>> DAILY INDICATIVE PRICES
Get IDIA - the stock trading app for the modern investor
Solutions by Business
Product Suites
Company
Contacts
- 8th Floor,
- South Atlantic Petroleum Towers,
- 1 Adeola Odeku Street,
- Victoria Island,
- Lagos, Nigeria.
- Email: solutions@infowarelimited.com
Follow Us
 |
 |
 |
 |