


InfoWARE AI Analyst Daily Market Report: 18-Aug-2025 | InfoWARE Finance
Get IDIA - the stock trading app for the modern investor


InfoWARE AI Analyst Daily Market Report: 18-Aug-2025
(Source: InfoWARE Terminal, Date: 18-Aug-2025)
Dear Investor,
NGX Daily Market Summary – Monday, August 18, 2025
The Nigerian Equities Market started the week on a steady note, with the NGX All Share Index advancing modestly by 0.07% to close at 144,628.20. Year-to-date, the market remains robust, posting 40.26% gains. Turnover grew by 8.14% compared to the last session, signaling continued investor enthusiasm despite a dip in trading volumes (down 23.88% day-on-day). Breadth was positive at 1.52x as 47 stocks advanced against 31 decliners. Insurance names and select momentum stocks led the pack, while broader sector participation hinted at rotation and tactical positioning.
Quick Recap of Last Week
The previous week was marked by heightened volatility, driven by earnings releases, sustained foreign inflows, and sector rebalancing. Defensive stocks remained in favor, but momentum and ETF products saw strong flows, confirming mixed risk appetites among both institutional and retail segments. Standout themes included rotational buying in consumer goods and insurance, and tactical exits from select heavyweight financials.
Key Market Trends & Breadth
- Market breadth positive at 1.52x (47 advancers vs 31 decliners) – breadth supports ongoing accumulation in pockets of the market, despite flattish top-line index moves.
- Volume increased in 66 stocks, but down in 75 – breadth of activity signals selective buying and possible profit booking.
- Turnover of ₦13.62B (+8.14%) on shrinking volumes: higher value, lower volume may indicate institutionally driven block trades.
- Institutional investors accounted for 64.9% of volumes and a commanding 80.15% of value, with trade count at 39.41% – suggesting a tilt toward large value, low frequency transactions.
- Retail participation strong by trade count (60.59%) but lower by value (19.85%); retail focus was more diversified and centered on mid-tier banking and telecom names.
Top Gainers & Losers – Standouts
| Stock | Close | Change (%) | RSI | MACD |
|---|---|---|---|---|
| AIICO INSURANCE PLC. (AIICO) | 4.18 | 10.00 | 66.67 | 0.57 |
| MERISTEM GROWTH ETF (MERGROWTH) | 1,069.20 | 10.00 | 73.16 | 137.57 |
| UPDC PLC (UPDC) | 7.15 | 10.00 | 54.73 | 0.87 |
| VETIVA GRIFFIN 30 ETF (VETGRIF30) | 57.75 | 10.00 | 66.34 | 2.08 |
| CORNERSTONE INS. (CORNERST) | 7.60 | 9.99 | 62.61 | 0.86 |
| Stock | Close | Change (%) | RSI | MACD |
|---|---|---|---|---|
| GREENWICH ASSET ETF (GREENWETF) | 315.90 | -10.00 | 54.22 | 34.51 |
| STANBIC IBTC HOLDINGS (STANBIC) | 100.00 | -9.99 | 96.87 | 5.50 |
| VETIVA CONSUMER GOODS ETF (VETGOODS) | 35.00 | -9.09 | 75.69 | 1.80 |
| PZ CUSSONS (PZ) | 35.00 | -7.89 | 49.18 | 0.52 |
| N.E.M INSURANCE (NEM) | 29.95 | -7.85 | 66.13 | 4.30 |
- AIICO INSURANCE and MERGROWTH ETF moved up 10% each on strong momentum. Both display healthy RSI readings (AIICO: 66.7, MERGROWTH: 73.16), though MERGROWTH is approaching overbought territory.
- GREENWETF and STANBIC reversed sharply (-10% and -9.99% respectively); STANBIC's RSI 96.87 signals severe overbought conditions and a likely correction phase.
- Insurance and ETF-linked instruments dominate both extremes, signifying rapid sectoral rotation and speculative flows.
Momentum Insights: Bullish & Bearish Signals
| Stock | Last | %Chg | 15DMA | RSI | Sector |
|---|---|---|---|---|---|
| UPDC | 7.15 | 9.09 | 6.77 | 54.73 | Real Estate |
| CUSTODIAN | 40.95 | 9.04 | 38.92 | n/a | Diversified |
| MCNICHOLS | 3.78 | 7.41 | 3.55 | n/a | Food Products |
| ABCTRANS | 5.0 | 8.00 | 4.86 | n/a | Transportation |
| UNILEVER | 76.50 | 6.54 | 75.14 | n/a | Consumer |
| MAYBAKER | 18.80 | 4.79 | 18.03 | n/a | Pharma |
| Stock | Last | %Chg | 15DMA | RSI | Sector |
|---|---|---|---|---|---|
| STANBIC | 100.00 | -11.10 | 104.30 | 96.87 | Financials |
| NEM | 29.95 | -8.51 | 30.35 | 66.13 | Insurance |
| GREENWETF | 315.90 | -11.11 | 354.17 | 54.22 | ETF |
| ACCESSCORP | 27.50 | -1.64 | 27.62 | n/a | Financials |
| LIVESTOCK | 8.05 | -4.97 | 8.43 | n/a | Agri |
- Bullish crossovers feature a blend of insurance (e.g., UPDC), diversified financials and consumer names. RSI values are broadly supportive (not yet overbought).
- Bearish crossovers cluster in financials (STANBIC, ACCESSCORP) and ETFs, with several sporting very high or rapidly declining RSI values – beware mean reversion risk!
Noteworthy Volume Surges
| Stock | Volume | 90D Avg Vol | % Vol Chg | Change (%) |
|---|---|---|---|---|
| UNIVERSAL INSURANCE (UNIVINSURE) | 202.25M | 46.56M | 334.43 | 9.84 |
| LASACO | 66.42M | 10.97M | 505.70 | -1.48 |
| MBENEFIT | 57.81M | 15.36M | 276.41 | 9.87 |
| PRESTIGE | 45.88M | 11.48M | 299.74 | 9.64 |
- Insurance sector is clearly hot for both buyers and traders: Unusual volume and outsized price moves. High turnover in LASACO (-1.48%) despite huge volume spike (505.7% above 90D avg) hints at distribution/seller control after a prolonged uptrend.
- Likewise, UNIVINSURE, MBENEFIT, and PRESTIGE show explosive volumes, but not all resulted in significant price gains—watch for reversals, especially when price fails to follow volume up.
Contrarian Signals
- STANBIC IBTC stands out with an extremely high RSI of 96.87 despite sharp price drops and a bearish 15DMA breakdown. Typically indicates a market top or blow-off, with a high likelihood of further pullback or sharp mean reversion.
- CHAMPION BREW (YTD +385.8%) – Despite enormous YTD rally, its RSI sits at a moderate 54.4, with MACD still positive. Momentum not exhausted yet, but risk of volatility spike is high.
- NEM INSURANCE – Present in both bearish momentum and YTD losers list, but maintains high RSI (66.13); watch for sentiment shift or sharp correction if support cracks.
- GREENWETF – Both a top daily loser & on bearish momentum watch, but RSI in the neutral zone (54.22) and strong MACD. May see short covering or rapid reversal if ETF sector risk appetite returns.
Year-to-Date (YTD) Gainers and Losers (Top-5)
| Stock | Price | %ChgYTD | DivYield | Beta | RSI |
|---|---|---|---|---|---|
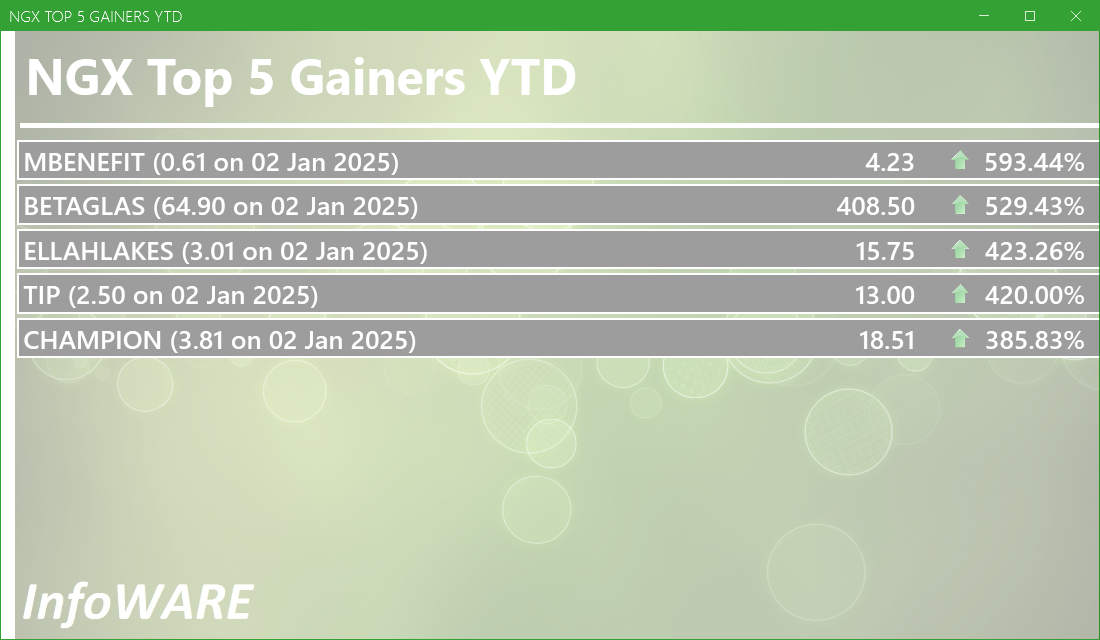
| MUTUAL BENEFITS (MBENEFIT) | 3.85 | 593.44 | 3.28 | 1.27 | 83.04 |
| CHAMPION BREW (CHAMPION) | 16.95 | 385.83 | 0.41 | 0.16 | 64.74 |
| THE INITIATES PLC (TIP) | 13.70 | 420.00 | 0.00 | 0.00 | 56.08 |
| MERGROWTH ETF | 972.00 | 171.03 | 0.00 | -2.31 | 73.16 |
| NCR (NIG) PLC | 8.70 | 58.18 | 61.22 | -0.13 | 96.72 |
| Stock | Price | %ChgYTD | DivYield | Beta | RSI |
|---|---|---|---|---|---|
| GREENWETF | 351.00 | -40.84 | 0.00 | 0.83 | 54.22 |
| LASACO | 4.05 | 17.70 | 4.05 | 0.71 | 58.44 |
| NEM | 32.50 | 149.58 | 6.52 | 0.69 | 66.13 |
| VERITASKAP | 2.27 | 54.36 | 4.17 | 0.88 | 67.34 |
| CAVERTON | 6.50 | 174.51 | 5.52 | 0.98 | 46.69 |
- Top gainers for the year include CHAMPION (+385.8%) and MBENEFIT (+593.4%), both showing signs of persistent accumulation, though with elevated RSI for MBENEFIT.
- GREENWETF (-40.8%) is top YTD loser and remains under pressure despite a neutral RSI – possible turnaround play if ETF sector recovers.
- Insurance and ETFs appear on both gainers and losers lists, pointing to two-tier trading within sectors and high sector churn.
Sector Performance Heatmap
| Sector | Top Performer | Change (%) | Most Active by Volume | Institutional Focus (%Value) |
|---|---|---|---|---|
| Insurance | AIICO, MBENEFIT | +10.00 | UNIVINSURE, LASACO | Moderate |
| Banking | GTCO, ZENITHBANK | -0.7 | ZENITHBANK, UBA, ACCESSCORP | High (ZENITHBANK: 20.17%) |
| Consumer Goods | UNILEVER | +6.54 | UNILEVER | Low |
| ETF | MERGROWTH | +10.00 | VETGRIF30, VETGOODS | Mixed |
| Telecom | MTNN | 0.0 | MTNN | High |
Dividend-Yield vs Beta Matrix (Defensive Plays)
| Stock | DivYield (%) | Beta | YTD %Chg |
|---|---|---|---|
| LASACO | 4.05 | 0.71 | 17.70 |
| NEM | 6.52 | 0.69 | 149.58 |
| MBENEFIT | 3.28 | 1.27 | 593.44 |
| VERITASKAP | 4.17 | 0.88 | 54.36 |
| CAVERTON | 5.52 | 0.98 | 174.51 |
- Best defensive yield-beta trade-offs: LASACO and NEM – both high dividend, low beta, and sub-index volatility; although price momentum is currently negative for NEM, both offer attractive income/low-vol shelter in risk-off stints.
- No high-yield stock currently on the most aggressive bearish or bullish momentum tables, suggesting dividends remain a defensive and not speculative strategy at present.
Institutional Activity Focus
- ZENITHBANK flagged for high institutional concentration: 20.17% of total traded value today – large blocks, tactical bets, or position rotation likely in play. Investors should track subsequent block transactions for signals.
- ACCESSCORP, UBA, and DANGSUGAR trailed close behind with active institutional trades but saw mostly flat or negative price moves—evidence that institutional flows alone do not guarantee direction in soft markets.
- Retail activity is skewed toward MTNN (strong by count, low by value) and same core banks—short-term traders may follow retail signals for volatility trades.
Market Activity & Trade Pattern Insights
-
Institutional vs Retail Trades:
- Institutions dominate by Value (₦12.07B) and Volume (64.89%), but are a minority by Trade Count (39.41%). Retail trades are more numerous but smaller on average—shows institutions prefer fewer, bigger trades while retail churns frequently on tight liquidity names.
-
Top 5 Institutional Traded Stocks:
- ZENITHBANK (₦878.6M, 1.16% of today's volume)
- ACCESSCORP (₦706.5M, 2.45%)
- UBA (₦649.9M, 1.29%)
- DANGSUGAR (₦414.7M, 0.66%)
- MTNN (₦604.9M, 0.14%)
-
Top 5 Retail Traded Stocks:
- MTNN (4.26% of retail trades by count)
- ACCESSCORP (4.23%)
- UBA (3.78%)
- GTCO (3.65%)
- DANGSUGAR (3.10%)
Traders’ Opportunities & Cautions
-
Opportunities:
- Bullish momentum crossovers on mid-cap insurers, diversified & food stocks: UPDC, CUSTODIAN, MCNICHOLS. Look for continuation trades as 15DMA/50DMA uptrends persist.
- Powerful volume surges in insurance stocks make UNIVINSURE, MBENEFIT, and PRESTIGE attractive for intraday setups or tactical accumulation—pair with stop-loss due to potential reversals.
- Defensive, income-oriented investors may favor LASACO or NEM for yield with modest risk (based on low Beta).
- Contrarian plays may emerge from stocks like GREENWETF (deep underperformance but technical mean-reversion potential) and CHAMPION (positive MACD, RSI not yet overheated despite high YTD gains).
-
Cautions:
- Watch for profit-taking/correction in STANBIC & select ETFs—extreme RSI and bearish 15DMA cross can trigger sharp short-term drops despite prior strength.
- Some high-momentum insurance tickers have volume spikes not matched by price moves; tread carefully if chasing breakouts.
- Turnover rising but volume declining can foreshadow brewing illiquidity or a shift toward large-block trading—be alert to volatility spikes in low-float names.
Summary Outlook
- Momentum remains constructive overall with pockets of exuberance (insurance, ETFs, select small/mid caps).
- Substantial institutional value flows in banking and telecoms suggest continued sector focus, but short-term moves will be driven by liquidity and technical swings.
- RSI extremes and moving average crossovers highlight fertile ground for both trend followers and contrarians—signal stacking is crucial for timing entries and exits.
Hidden Insight: The coincidence of abnormal volume in the insurance sector (LASACO, MBENEFIT, UNIVINSURE) with only modest price gains and a surge in ETF/derivative action suggests an underlying shift in risk preference. Investors are advised to watch for sharp sector reversals when liquidity-driven moves exceed 2x long-term averages, especially if not supported by corresponding price action.
|
Top ASI Gainers Over Last 5 Trading Days
|
Top ASI Losers Over Last 5 Trading Days
|
For more detailed analysis, on InfoWARE Market Data Terminal <NSEPERF> <GO>
On InfoWARE Finance Mobile App (Android, iPhone & iPad, Windows Phone and Windows 8/10), "Top Gainers & Losers"
AIICO INSURANCE PLC. (AIICO) topped the advancers list closing at N4.18 with a gain of 10.00% followed by LOTUS HALAL EQUITY ETF (LOTUSHAL15) which closed at N105.05 with a gain of 10.00%.
On the flip side GREENWICH ASSET ETF (GREENWETF) and STANBIC IBTC HOLDINGS PLC (STANBIC) topped the decliners log with a loss of -10.00% at a close of N315.90, and -9.99% to close the day at N100.00 respectively.
| Symbol | LClose | %Chg |
|---|---|---|
| AIICO | 4.18 | 10.00 |
| LOTUSHAL15 | 105.05 | 10.00 |
| MERGROWTH | 1,069.20 | 10.00 |
| UPDC | 7.15 | 10.00 |
| VETGRIF30 | 57.75 | 10.00 |
For more detailed analysis,
- On InfoWARE Market Data Terminal <TOPG> <GO>
- On InfoWARE Finance Mobile App ( Android, iPhone & iPad and Windows 10) , "Top Gainers & Losers"
Currency Market
In the currency market, the Naira appreciated 0.02%(0.26) against the Dollar to settle at 1 to 1Investment Insights - Top 5 Gainers YTD
These stocks are the best performers whose price has risen faster than the market as a whole with the best returns year to date. Momentum investors believe that stocks that have outperformed the market will often continue to do so because the factors that caused them to outperform will not suddenly disappear. In addition, other investors seeking to benefit from the stock’s outperformance will often purchase the stock, further bidding its price higher and pushing the stock higher still
For more detailed analysis,
- On InfoWARE Market Data Terminal <T5YTD2> <GO>
- On InfoWARE Finance Mobile App ( Android , iPhone & iPad and Windows 10) , "Research"
NSE: Bull Signal - Price crossed above 15 Day MA
This signal implies these stocks are under buying pressure and the price might continue to rise and therefore positions should be monitored closely. Further suggested analysis include looking at the overall market (ASI) to see if the uptrend is market wide, sector wide or specific to the stock. Portfolio managers tend to use this as a signal to do more research to add to their positions or lock in some profits. Typically further analysis should be done using commands like PC and RV on the InfoWARE Market Data Terminal. Another command is ALERTS to set price triggers for possible exit or entry as necessary
For more detailed analysis,
- On InfoWARE Market Data Terminal <NSEPERF> <GO>
- On InfoWARE Finance Mobile App ( Android , iPhone & iPad and Windows 10) , "Top Gainers & Losers"
| Symbol | Price | %Chg | 15DMA | PE | EPS | DivY | MktCap | Vol | Trades | Value | LstTradeTime |
|---|---|---|---|---|---|---|---|---|---|---|---|
| UPDC | 7.15 | 9.09 | 6.77 | 0.00 | 0.00 | 34.25 | 132.70B | 6.59M | 250.00 | 46.57M | 18-Aug-2025 14:31:28.563 |
| CUSTODIAN | 40.95 | 9.04 | 38.92 | 3.80 | 3.29 | 1.20 | 240.86B | 1.90M | 181.00 | 72.58M | 18-Aug-2025 14:30:25.660 |
| ABCTRANS | 5.00 | 8.00 | 4.86 | 6.68 | 0.17 | 2.19 | 11.96B | 511.03K | 90.00 | 2.54M | 18-Aug-2025 14:30:24.220 |
| MCNICHOLS | 3.78 | 7.41 | 3.55 | 26.80 | 0.05 | 5.88 | 2.72B | 1.81M | 103.00 | 6.84M | 18-Aug-2025 14:31:36.077 |
| UNILEVER | 76.50 | 6.54 | 75.14 | 67.09 | 0.40 | 2.81 | 439.49B | 917.52K | 131.00 | 69.77M | 18-Aug-2025 14:30:33.510 |
| MAYBAKER | 18.80 | 4.79 | 18.03 | 58.94 | 0.14 | 3.75 | 32.43B | 1.62M | 127.00 | 28.76M | 18-Aug-2025 14:30:30.240 |
NSE: BEAR Signal - Price crossed below 15 Day MA
This signal implies these stocks are under selling pressure and the price might continue to slide and therefore positions should be monitored closely. Further suggested analysis include looking at the overall market (ASI) to see if the downtrend is market wide, sector wide or specific to the stock. If the overal market trend is upwards, then since these stocks are heading in the opposite direction, then further analysis should be done using commands like PC and RV on the InfoWARE Market Data Terminal. Another command is ALERTS to set price triggers for possible exit is necessar
For more detailed analysis,
- On InfoWARE Market Data Terminal <BEARM> <GO>
- On InfoWARE Finance Mobile App ( Android , iPhone & iPad and Windows 10)
| Symbol | Price | %Chg | 15DMA | PE | EPS | DivY | MktCap | Vol | Trades | Value | LstTradeTime |
|---|---|---|---|---|---|---|---|---|---|---|---|
| ARADEL | 519.00 | 0.00 | 519.13 | 0.00 | 0.00 | 1.72 | 2,254.97B | 1.84M | 525.00 | 945.58M | 18-Aug-2025 14:30:24.773 |
| NGXMERIGRW | 10,183.79 | -1.00 | 10,275.74 | 34.89 | 293.99 | 0.00 | 0.00 | 53.69M | 4,920.00 | 2.01B | 18-Aug-2025 14:30:46.367 |
| CUTIX | 3.85 | -1.30 | 3.92 | 8.81 | 0.26 | 6.52 | 13.56B | 4.93M | 317.00 | 19.74M | 18-Aug-2025 14:30:25.670 |
| FCMB | 10.80 | -1.39 | 11.00 | 104.31 | 0.09 | 5.62 | 213.87B | 5.98M | 537.00 | 64.78M | 18-Aug-2025 14:30:28.590 |
| NGXBNK | 1,578.79 | -1.53 | 1,603.81 | 6.10 | 34.65 | 0.00 | 0.00 | 133.04M | 7,651.00 | 3.92B | 18-Aug-2025 14:30:45.773 |
| ACCESSCORP | 27.50 | -1.64 | 27.62 | 8.56 | 2.81 | 1.87 | 977.49B | 30.16M | 1,749.00 | 829.71M | 18-Aug-2025 14:31:35.417 |
| MERVALUE | 205.00 | -4.88 | 214.36 | 0.00 | 0.00 | 182.00 | 5.00 | 38.43K | 18-Aug-2025 14:31:29.533 | ||
| LIVESTOCK | 8.05 | -4.97 | 8.43 | 0.00 | 0.00 | 2.94 | 24.15B | 1.09M | 173.00 | 9.01M | 18-Aug-2025 14:30:30.130 |
| CHAMS | 2.70 | -5.56 | 2.82 | 27.02 | 0.07 | 1.56 | 12.68B | 16.60M | 566.00 | 44.69M | 18-Aug-2025 14:30:25.533 |
| NEM | 29.95 | -8.51 | 30.35 | 24.99 | 0.37 | 6.52 | 150.24B | 1.32M | 231.00 | 39.13M | 18-Aug-2025 14:30:31.617 |
| STANBIC | 100.00 | -11.10 | 104.30 | 6.87 | 8.23 | 3.54 | 1,295.70B | 6.81M | 316.00 | 682.15M | 18-Aug-2025 14:30:32.690 |
| GREENWETF | 315.90 | -11.11 | 354.17 | 0.00 | 0.00 | 390.00 | 5.00 | 130.22K | 18-Aug-2025 14:31:29.460 | ||
| FGS202894 | 99.44 | -32.54 | 117.61 | 0.00 | 0.00 | 483.00 | 1.00 | 480.31K | 18-Aug-2025 14:30:44.023 |
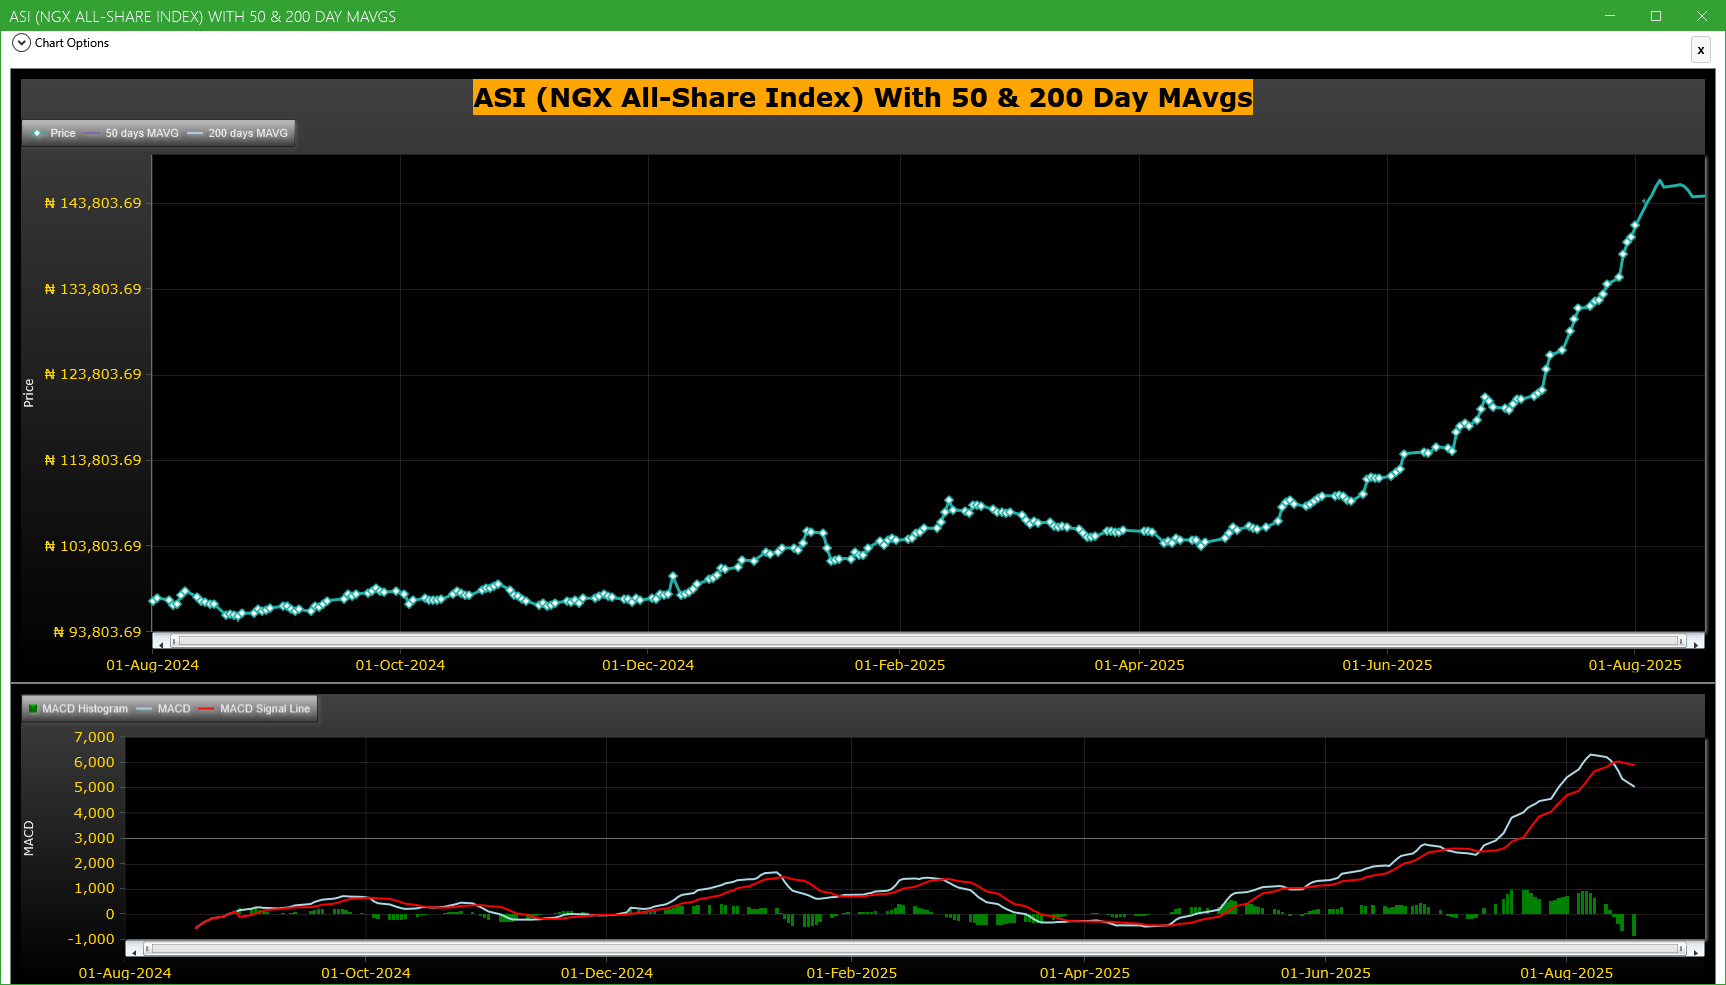
Market Trend - ASI (NGX All-Share-Index) With 50 & 200 Day MAvgs Chart
Technical traders typically use the 50 & 200 day moving averages to aid in choosing
where to enter or exit a position, which then causes these levels to act as strong
support or resistance. As a general guideline, if the price is above a moving average,
the trend is up. If the price is below a moving average, the trend is down.
It is important to note that critics of technical analysis say that moving averages act
as support and resistance because so many traders use these indicators to inform their
trading decisions. Also moving averages tend to work quite well in strong trending conditions
but poorly in choppy or ranging conditions.
Trading Strategies: Crossovers
Crossovers are one of the main moving average strategies. The first type is a price crossover,
which is when the price crosses above or below a moving average to signal a potential change
in trend. Another strategy is to apply two moving averages to a chart: one longer and one
shorter. When the shorter-term MA crosses above the longer-term MA, it is a buy signal, as
it indicates that the trend is shifting up. This is known as a golden cross. Meanwhile, when
the shorter-term MA crosses below the longer-term MA, it is a sell signal, as it indicates that
the trend is shifting down. This is known as a dead/death cross
For more detailed analysis,
- On InfoWARE Market Data Terminal <CI> <GO>
- On InfoWARE Finance Mobile App ( Android , iPhone & iPad and Windows 10) , "Research"
Unusual Volume: Volume traded is more than double the 90 day moving average (All exchanges; ASI & ASem). For more detailed analysis,
- On InfoWARE Market Data Terminal <UV> <GO>
- On InfoWARE Finance Mobile App ( Android , iPhone & iPad and Windows 10)
| Symbol | Name | Volume | 90DAvgVol | %VolChg | Price | LClose | %Chg | Trades | Value |
|---|---|---|---|---|---|---|---|---|---|
| UNIVINSURE | UNIVERSAL INSURANCE COMPANY PLC | 202.25M | 46.56M | 334.43 | 1.34 | 1.22 | 9.84 | 633 | 265.82M |
| LASACO | LASACO ASSURANCE PLC. | 66.42M | 10.97M | 505.70 | 3.99 | 4.05 | -1.48 | 511 | 263.82M |
| MBENEFIT | MUTUAL BENEFITS ASSURANCE PLC. | 57.81M | 15.36M | 276.41 | 4.23 | 3.85 | 9.87 | 327 | 244.48M |
| VERITASKAP | VERITAS KAPITAL ASSURANCE PLC | 53.35M | 21.92M | 143.32 | 2.30 | 2.27 | 1.32 | 592 | 124.71M |
| PRESTIGE | PRESTIGE ASSURANCE CO. PLC. | 45.88M | 11.48M | 299.74 | 2.16 | 1.97 | 9.64 | 278 | 97.84M |
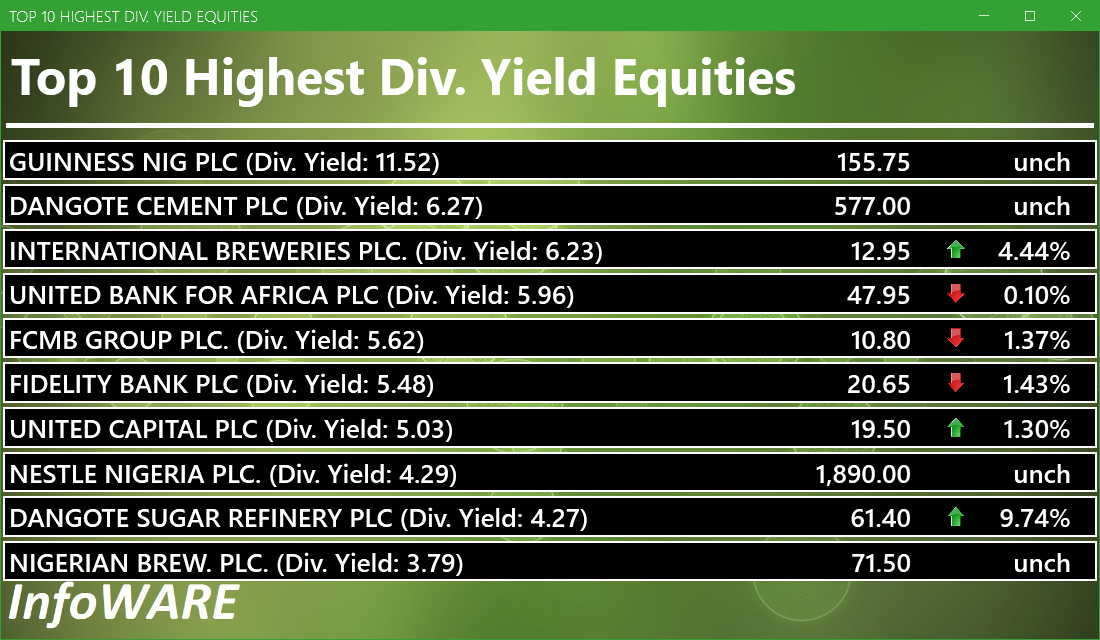
Investment Insights - High Div. Stocks
Dividend stocks distribute a portion of the company earnings to investors on a regular basis and they can a great choice for investors looking for regular income. As an investment or trading strategy, high dividend yield equities provide annual cash payments as against mostly capital gains in the price of a stock. The list in the table below represent the highest dividend paying stocks from the list of the most liquid stocks in the NSE top 30.
For more detailed analysis,
- On InfoWARE Market Data Terminal <HYIELD> <GO>
- On InfoWARE Finance Mobile App ( Android , iPhone & iPad and Windows 10) , "Research"
Investment Insights - Stocks outperforming the ASI but with approximately the same risk
These list of stocks represent equities that are less risky than the ASI but doing better than the ASI (All Shares Index) using the YTD (Year to Date) returns as the measure. The risk is measured by Beta. Beta is an assessment of a stock's tendency to undergo price changes, (its volatility), as well as its potential returns compared to the ASI. It is expressed as a ratio, where a score of 1 represents performance comparable to the ASI, and returns above or below the market may receive scores greater or lower than 1.
For a full list of both positively and negatively corelated stocks visit InfoWARE Market Data Terminal
- On InfoWARE Market Data Terminal <BANL> <GO>
- On InfoWARE Finance Mobile App ( Android , iPhone & iPad and Windows 10)
| Symbol | DivYield | PE | EPS | Beta | %ChgYTD | ASIYTDReturn | BetaDiff |
|---|---|---|---|---|---|---|---|
| HONYFLOUR | 1.40 | 16.28 | 0.31 | 0.99 | 232.37 | 40.26 | 0.01 |
| CAVERTON | 5.52 | 1.15 | 1.57 | 0.98 | 174.51 | 40.26 | 0.02 |
| ROYALEX | 7.81 | 0.00 | 0.00 | 0.96 | 154.55 | 40.26 | 0.04 |
| CORNERST | 5.28 | 8.62 | 0.35 | 0.93 | 91.92 | 40.26 | 0.07 |
| DEAPCAP | 13.76 | 188.84 | 0.01 | 0.89 | 47.50 | 40.26 | 0.11 |
| VERITASKAP | 4.17 | 48.77 | 0.02 | 0.88 | 54.36 | 40.26 | 0.12 |
| UNIVINSURE | 0.00 | 0.00 | 0.00 | 0.83 | 86.11 | 40.26 | 0.17 |
| FTNCOCOA | 1.60 | 0.00 | 0.00 | 0.79 | 272.34 | 40.26 | 0.21 |
| NB | 3.79 | 16.95 | 1.60 | 0.79 | 123.44 | 40.26 | 0.21 |
| MAYBAKER | 3.75 | 58.94 | 0.14 | 0.78 | 100.00 | 40.26 | 0.22 |
African Markets
| Name | LClose | Change | %Chg |
|---|---|---|---|
| BRVM Stock Exchange | 314.77 | 1.44 | 0.46 |
| Egyptian Exchange | 35,576.42 | -279.68 | -0.78 |
| Rwanda Stock Exchange | 170.29 | 19.86 | 13.20 |
Nigeria Market Indexes
| Symbol | LClose | %Chg | WTD% | MTD% | QTD% | YTD% | MktCap | Trades |
|---|---|---|---|---|---|---|---|---|
| ASI | 144,722.47 | 0.07 | 0.00 | 2.45 | 20.86 | 40.26 | 35,956 | |
| NGX30 | 5,275.00 | -0.14 | 0.00 | 1.73 | 11.67 | 38.28 | 17,137 | |
| NGXAFRBVI | 3,693.00 | -1.33 | 0.00 | -3.18 | 4.22 | 48.86 | 6,331 | |
| NGXAFRHDYI | 23,447.86 | 0.06 | 0.00 | 0.96 | 12.12 | 37.71 | 7,411 | |
| NGXASEM | 1,538.10 | 0.00 | 0.00 | 6.34 | -3.57 | -2.88 | 19 | |
| NGXBNK | 1,578.79 | -1.51 | 0.00 | -2.48 | 4.50 | 45.19 | 7,651 | |
| NGXCG | 4,190.25 | -0.48 | 0.00 | -2.59 | 21.86 | 48.11 | 17,747 | |
| NGXCNSMRGDS | 3,229.44 | 1.15 | 0.00 | 8.49 | -6.90 | 86.20 | 4,458 | |
| NGXCOMMDTY | 1,070.03 | 0.00 | 0.00 | -2.36 | 2.18 | 7.00 | ||
| NGXGROWTH | 11,131.82 | -0.26 | 0.00 | 0.58 | 17.06 | 43.40 | 550 | |
| NGXINDUSTR | 5,444.92 | -0.12 | 0.00 | 7.70 | 54.56 | 52.45 | 2,735 | |
| NGXINS | 1,424.55 | 5.26 | 0.00 | 60.61 | 92.87 | 81.20 | 5,155 | |
| NGXLOTUSISLM | 11,884.07 | -0.07 | 0.00 | 2.22 | 24.12 | 70.56 | 5,685 | |
| NGXMAINBOARD | 6,943.83 | 0.21 | 0.00 | 4.59 | 17.71 | 38.77 | 27,691 | |
| NGXMERIGRW | 10,183.79 | -0.99 | 0.00 | -1.22 | 5.51 | 56.12 | 4,920 | |
| NGXMERIVAL | 14,090.70 | 0.16 | 0.00 | -3.00 | 17.94 | 35.09 | 8,558 | |
| NGXOILGAS | 2,399.28 | -0.28 | 0.00 | -1.53 | 0.30 | -11.50 | 430 | |
| NGXPENBRD | 2,677.20 | -0.08 | 0.00 | 2.72 | 16.43 | 46.16 | 28,704 | |
| NGXPENSION | 6,837.08 | -0.28 | 0.00 | -1.12 | 7.59 | 50.80 | 19,103 | |
| NGXPREMIUM | 14,586.95 | -0.19 | 0.00 | -1.21 | 27.18 | 49.87 | 7,715 | |
| NGXSOVBND | 671.46 | 0.00 | 0.00 | -0.21 | 2.75 | 11.62 | 0 |
For more detailed analysis,
- On InfoWARE Market Data Terminal <MKTINS> <GO>
- On InfoWARE Finance Mobile App ( Android, iPhone & iPad and Windows 10) , "Market Indexes"
Find the topic interesting? Will like to comment? Contact Us at solutions@infowarelimited.com
Top News

Chart Of The Day - ASI Chart Vs ASI Advance Decline Line (YTD) (18-Aug-2025 15:12:19.768)
InfoWARE AI Analyst Daily Market Report: 18-Aug-2025

[XNSA]>> OFF MARKET TRADE
[XNSA]>> NGX FIXED INCOME INDICATIVE PRICE LIST FOR AUGUST 15, 2025
[MERVALUE]>> DAILY INDICATIVE PRICES
[VSPBONDETF]>> DAILY INDICATIVE PRICES
[XNSA]>> EMERGING AFRICA DAILY FUND PRICES
[UBA]>>Corporate Disclosures-<UNITED BANK FOR AFRICA PLC>
[XNSA]>> CORDROS MILESTONE FUNDS' BID & OFFER PRICES
[XNSA]>> DAILY FUND PRICE SUBMISSION - FCMB ASSET MANAGEMENT LIMITED
[XNSA]>> REGISTRATION FOR BATCH TWO- 2025 DEALING CLERKSHIP CERTIFICATION PROGRA
[XNSA]>> NGX NON-INTEREST FINANCE BOARD LAUNCH COMMUNIQUE
[XNSA]>> SAVE THE DATE: 29TH ANNUAL STOCKBROKERS CONFERENCE
[XNSA]>> NOTIFICATION OF PRICE ADJUSTMENT
[SIAMLETF40]>> DAILY INDICATIVE PRICES
Chart Of The Day - ASI Chart Vs ASI Advance Decline Line (YTD) (15-Aug-2025 15:07:13.864)
InfoWARE Analyst Daily Market Report (15-Aug-2025 15:07:09.387)
[XNSA]>> DAILY FUND PRICE SUBMISSION - FCMB ASSET MANAGEMENT LIMITED
[XNSA]>> NGX FIXED INCOME INDICATIVE PRICE LIST FOR AUGUST 15, 2025
[OANDO]>>Corporate Disclosures-<OANDO PLC>
[ETI]>>Corporate Disclosures-<ECOBANK TRANSNATIONAL INCORPORATED>
[XNSA]>> NORRENBERGER MUTUAL FUNDS WEEKLY UPDATE TO NGX
[VSPBONDETF]>> DAILY INDICATIVE PRICES
[XNSA]>> REGISTRATION FOR BATCH TWO- 2025 DEALING CLERKSHIP CERTIFICATION PROGRA
[XNSA]>> CORDROS MILESTONE FUNDS' BID & OFFER PRICES
[STANBICETF30]>> DAILY INDICATIVE PRICES
[XNSA]>> RETIREMENT OF DIRECTORS (UNITED CAPITAL SECURITIES LIMITED)
[XNSA]>> APPOINTMENT OF DIRECTORS (STANDARD ALLIANCE CAPITAL AND ASSET MANAGEMEN
[XNSA]>> NGX NON-INTEREST FINANCE BOARD LAUNCH COMMUNIQUE
[XNSA]>> SAVE THE DATE: 29TH ANNUAL STOCKBROKERS CONFERENCE
Get IDIA - the stock trading app for the modern investor
Solutions by Business
Product Suites
Company
Contacts
- 8th Floor,
- South Atlantic Petroleum Towers,
- 1 Adeola Odeku Street,
- Victoria Island,
- Lagos, Nigeria.
- Email: solutions@infowarelimited.com
Follow Us
 |
 |
 |
 |