


InfoWARE AI Analyst Daily Market Report: 16-Oct-2025 | InfoWARE Finance
Get IDIA - the stock trading app for the modern investor


InfoWARE AI Analyst Daily Market Report: 16-Oct-2025
(Source: InfoWARE Terminal, Date: 16-Oct-2025)
Dear Investor,
NGX Daily Market Summary – Thursday, October 16, 2025
The NGX All Share Index (ASI) staged a modest rebound today, closing up +0.41% at 147,742.23, charting YTD returns at a robust +43.78%. Market momentum was buoyed by a 22.93% jump in turnover to ₦13.70B and improved trading volumes, while breadth slightly favored advancing stocks (34 gainers vs. 29 losers; breadth: 1.17x). Notably, ETFs stole the spotlight on both ends of the performance table—MERVALUE soared as the top gainer, while GREENWETF dropped as the top loser, signaling ongoing volatility and profit-taking within the exchange-traded funds space. Amid increased institutional participation, high-volume surges, and technical crossovers, nuanced trends are emerging across sectors, with insurance, banking, and select diversifieds shaping up as pivotal battlegrounds for both bulls and bears.
Key Market Trends & Breadth
- Market Breadth: Advancers outnumbered decliners (1.17x ratio), indicating measured but positive sentiment.
- Trading Volume: Rose to 375.99M, an uptick from the prior day's 361.05M—but with institutional deals accounting for nearly 69% of total volume.
- Turnover: Jumped +22.93% day-on-day, signaling a pick-up in market conviction and rotational activity.
Top Gainers & Losers
| Stock | %Change | RSI | MACD | 15DMA/50DMA |
|---|---|---|---|---|
| MERISTEM VALUE ETF (MERVALUE) | +9.77% | 47.8 | -9.73 | 175.0/196.8 |
| GREENWICH ASSET ETF (GREENWETF) | +8.97% | 72.9 (Overbought!) | 24.24 | 287.7/297.9 |
| NEWGOLD ETF (NEWGOLD) | +7.55% | 49.6 | 226.6 | 54015.6/53967.2 |
| SECURE ELECTRONIC TECH. (NSLTECH) | +7.06% | 47.3 | 0.0046 | 0.893/0.922 |
| STERLING FIN. HLDG. (STERLINGNG) | +6.49% | 50.7 | 0.1315 | 7.83/7.75 |
| SUNU ASSURANCES (SUNUASSUR) | -9.71% | 52.3 | 0.073 | 5.69/5.73 |
| MERISTEM GROWTH ETF (MERGROWTH) | -8.96% | 41.0 | -34.79 | 397.3/579.3 |
| HALDANE MCCALL (HMCALL) | -7.53% | 54.0 | 0.059 | 4.24/4.27 |
| DAAR COMM. (DAARCOMM) | -6.36% | 53.0 | 0.012 | 1.08/1.07 |
| SOVEREIGN TRUST (SOVRENINS) | -6.05% | 60.1 | 0.179 | 3.13/2.96 |
- MERVALUE and GREENWETF dominated positive moves, notable for their ETF status—highlighting investor preference for diversified/basket plays in today’s rally.
- SUNUASSUR and MERGROWTH suffered the largest losses. The ETF theme persists with MERGROWTH, echoing rotation out of growth-tilted baskets.
- GREENWETF displays an RSI of 72.85 (overbought)—a signal of probable short-term reversal risk.
- Several top gainers, including NSLTECH and STERLINGNG, confirmed their upswings with bullish crossovers above their 15DMA.
Momentum & Technical Patterns
- Rising Turnover: The +22.93% increase in turnover suggests liquidity inflow, most likely from institutional actors—see clustering in top banks (ZENITHBANK, GTCO, ACCESSCORP).
- Institutional vs Retail: Institutions claimed 69% of volume and 90% of trade value, compared to just 31% and 9.7% for retail.
- Advancers vs Decliners: 34 advancers against 29 decliners: breadth positive but not overly exuberant, often a sign of cautious optimism.
-
Unusual Volume: Several stocks saw large surges versus their 90D avg:
- TANTALIZER: +320% above avg volume, signaling real retail interest despite modest price gains.
- NIDF (Debt Fund): +337% surge, interests shifting into debt/infrastructure themes possibly on expectation of rising rates or defensive allocation.
- ENERGY, IT & DURABLES: ETERNA, CWG, VITAFOAM all with >100% volume spikes but little/no price action—a sign of accumulation/distribution in progress.
-
Bullish Momentum (15DMA Crossovers):
- MERVALUE, NEWGOLD, STERLINGNG, NSLTECH not only led gains, but also registered bullish technical signals by closing above their 15DMA—potential for further short-term upside.
- A handful of insurance names (LINKASSURE, CORNERST, PRESTIGE) also triggered bullish momentum signals, possibly signaling rotation or defensive interest.
- GREENWETF: RSI at 72.85—caution, as overbought conditions often precede pullbacks.
-
Bearish Momentum (15DMA breakdowns):
- SUNUASSUR, HMCALL, DAARCOMM, UPDC, LOTUSHAL15 all broke below their 15DMA—continue to monitor for more downside or failed rebounds, especially as the broad market is trending up (contrarian signal).
- Watch for double whammy in SUNUASSUR and HMCALL—both appear in today’s Top Losers and Bearish Momentum tables, increasing conviction in their negative trends.
Contrarian Signals: Hidden Insights
- GREENWETF: Overbought (RSI 72.85), high volatility, yet still advancing—caution for momentum traders as this could unwind rapidly.
- HALDANE MCCALL (HMCALL): RSI is neutral (54.0) but sits in both Top Loser and Bearish Momentum lists—signal is not strong selling but may be entering oversold territory for value-seeking buyers.
- MERGROWTH: Negative MACD (-34.79) and poor price action, in both Top Loser and YTD Loser tables—trend-followers should avoid, but contrarians may watch for stabilization.
- Watch NSLTECH: RSI 47.3, MACD neutral, price breakout above 15DMA—bullish technicals but lacks fundamental catalyst; could be a short squeeze or speculative spike.
Sector Heatmap & Institutional Activity
| Sector | Performance | Bullish/Bearish Momentum | Notable Institutional Activity |
|---|---|---|---|
| Banking | +0.5–1.1% | STERLINGNG (bullish breakout), ZENITHBANK strong inst. trades | ZENITHBANK (20% inst. value) |
| Insurance | Mixed | PRESTIGE, LINKASSURE, CORNERST (bullish); SOVRENINS, SUNUASSUR (bearish) | Minimal noted |
| ETFs | Volatile | MERVALUE (bullish); GREENWETF, MERGROWTH (high momentum, overbought, toppy) | Institutions active |
| Industrial/Materials | Stable+ | Error-mixed | DANGCEM (High inst. activity) |
| Diversified/Infra | + (VFDGROUP up, NIDF activity) | VFDGROUP (bullish); NIDF (unusual volume) | ARADEL (high volume inst.) |
Dividend–Beta Defensive Matrix
| Stock | Div. Yield | Beta | Classification |
|---|---|---|---|
| AFRIPRUD | 1.27% | 0.64 | Defensive; low beta, modest yield |
| STERLINGNG | 3.19% | 1.41 | High yield, moderately high beta (Yield+Growth) |
| SOVRENINS | 3.75% | 1.12 | High yield, high-risk; bearish momentum, be cautious |
| CORNERST | 5.28% | 0.93 | Attractive yield with below-market risk |
| UPDC | 34.25% | 1.10 | Extremely high yield—beware of unsustainable payout or special situation |
Institutional Clustering Alerts
- ZENITHBANK: 20.17% of institutional trade value. Concentration of institutional flows signals strong confidence or major fund repositioning (watch for spillover to peer banks).
- GTCO, ACCESSCORP: Together with ZENITHBANK, these three control nearly all the major institutional trade volume—trend-followers should keep these on close radar for confirmation of sector leadership.
- Rising institutional action in ARADEL (oil & gas)—possible strategic accumulation, albeit with moderate price change.
Trader Suggestions and Opportunities
- ETF Momentum Plays: Quick traders may ride MERVALUE but must be nimble—overbought signals on GREENWETF are flashing caution, with profit-taking likely near term.
- Bullish Crossovers: STERLINGNG, NSLTECH, MERVALUE are showing technical strength (above 15DMA); monitor for follow-through but manage risk as rallies can be short-lived.
- Bearish Caution: SUNUASSUR, HMCALL, DAARCOMM in both top loser and bearish technical lists—avoid until clear reversal signals emerge.
- Yield Seekers: Consider stocks in Dividend–Beta matrix, but scrutinize sustainability, especially with outsize yields like UPDC or SOVRENINS.
- Unusual Volume: TANTALIZER, NIDF signal underlying accumulation—opportunity for speculators but liquidity can dry up quickly. Watch for follow-up volume tomorrow.
YTD & Momentum Table Highlights (Hidden Insights)
- ETF Rotation: MERVALUE, GREENWETF, MERGROWTH appear in both daily and YTD tables—short-term traders should monitor for volatility squeezes.
- Insurance moves: Divergence within sector—PRESTIGE, LINKASSURE bullish; SOVRENINS, SUNUASSUR in bear phase.
- INTBREW: +172.7% YTD, consistent with strong 5-day/MTD performance and RSI at 62.0. Momentum remains, but watch for exhaustion.
- ELLAHLAKES: -341.9% YTD, sharpest loss—potential bounce candidate for deep value/turnaround speculators, but risks remain high.
Retail vs Institutional Trades Summary & Insights
| Investor Type | Trade Count | Total Volume | Gross Amount ₦ | % of Vol | % of Value |
|---|---|---|---|---|---|
| Institutional | 2,055 | 298.27M | ₦15.18B | 68.97% | 90.28% |
| Retail | 21,689 | 134.18M | ₦1.63B | 31.03% | 9.72% |
- Institutions dominated by value but not by trade count; i.e., large block trades, possibly rebalancing or window-dressing at the mid-month mark.
- Top 5 Institutional Symbols: GTCO, ACCESSCORP, DANGCEM, ZENITHBANK, ARADEL – banking and cement sector remain institutional favorites.
- Top 5 Retail Symbols: GTCO, MTNN, ZENITHBANK, ACCESSCORP, UBA – retail crowd largely mirrors institutional focus, especially in banking, but with much smaller ticket sizes.
- Correlation: Both cohorts are focused on tier-1 banks, validating banking as the near-term sector leadership and market direction indicator.
- Investor Takeaway: Momentum-followers should watch banking for confirmation; divergence in sector flow could precede broader index turns. Block trades in DANGCEM and ARADEL (institutions) hint at cyclical rotation into hard assets and oil/energy.
Currency Market
Naira: appreciated by +0.07% to 1,459/$—yah! Likely contributing to positive market sentiment as currency risk abates slightly.
Summary: What to Watch
- ETF leadership is potent but volatile—riding upward momentum, but caution on excessive overbought readings (GREENWETF).
- Banking sector is anchor for institutional and retail interest—leaders here will likely point direction for the broader index.
- Institutional block trades support current rally, but over-extension in a few names (esp. ETFs, some insurance) warn of profit-taking ahead.
- Stocks featuring on both Bearish Momentum and Top Loser lists—SUNUASSUR, HMCALL—should be avoided until trend reverses.
- Yield-conscious traders should browse the Dividend–Beta matrix for lower-beta, sustainable dividend payers as market volatility picks up.
- Watch for confirmation tomorrow from volume and follow-through—especially in banking, insurance, and leading ETFs.
- Speculators: Look for reversals in deeply oversold YTD or extreme volume names, but use tight stops!
-- End of summary. For bespoke portfolio analytics, contact your InfoWARE terminal or reach out for deep-dive sector/stock specific due diligence.
|
Top ASI Gainers Over Last 5 Trading Days
|
Top ASI Losers Over Last 5 Trading Days
|
For more detailed analysis, on InfoWARE Market Data Terminal <NSEPERF> <GO>
On InfoWARE Finance Mobile App (Android, iPhone & iPad, Windows Phone and Windows 8/10), "Top Gainers & Losers"
MERISTEM VALUE EXCHANGE TRADED FUND (MERVALUE) topped the advancers list closing at N191.00 with a gain of 9.77% followed by GREENWICH ASSET ETF (GREENWETF) which closed at N425.00 with a gain of 8.97%.
On the flip side LOTUS HALAL EQUITY ETF (LOTUSHAL15) and SUNU ASSURANCES NIGERIA PLC. (SUNUASSUR) topped the decliners log with a loss of -10.00% at a close of N93.42, and -9.71% to close the day at N5.21 respectively.
| Symbol | LClose | %Chg |
|---|---|---|
| MERVALUE | 191.00 | 9.77 |
| GREENWETF | 425.00 | 8.97 |
| NEWGOLD | 57,000.00 | 7.55 |
| NSLTECH | 0.91 | 7.06 |
| STERLINGNG | 8.20 | 6.49 |
| Symbol | LClose | %Chg |
|---|---|---|
| LOTUSHAL15 | 93.42 | -10.00 |
| SUNUASSUR | 5.21 | -9.71 |
| MERGROWTH | 350.50 | -8.96 |
| HMCALL | 4.05 | -7.53 |
| DAARCOMM | 1.03 | -6.36 |
For more detailed analysis,
- On InfoWARE Market Data Terminal <TOPG> <GO>
- On InfoWARE Finance Mobile App ( Android, iPhone & iPad and Windows 10) , "Top Gainers & Losers"
Currency Market
In the currency market, the Naira appreciated 0.07%(1.09) against the Dollar to settle at 1 to 1NSE: Bull Signal - Price crossed above 15 Day MA
This signal implies these stocks are under buying pressure and the price might continue to rise and therefore positions should be monitored closely. Further suggested analysis include looking at the overall market (ASI) to see if the uptrend is market wide, sector wide or specific to the stock. Portfolio managers tend to use this as a signal to do more research to add to their positions or lock in some profits. Typically further analysis should be done using commands like PC and RV on the InfoWARE Market Data Terminal. Another command is ALERTS to set price triggers for possible exit or entry as necessary
For more detailed analysis,
- On InfoWARE Market Data Terminal <NSEPERF> <GO>
- On InfoWARE Finance Mobile App ( Android , iPhone & iPad and Windows 10) , "Top Gainers & Losers"
| Symbol | Price | %Chg | 15DMA | PE | EPS | DivY | MktCap | Vol | Trades | Value | LstTradeTime |
|---|---|---|---|---|---|---|---|---|---|---|---|
| FGSUK2027S3 | 94.93 | 10.46 | 86.53 | 0.00 | 0.00 | 110.00K | 4.00 | 103.70M | 16-Oct-2025 14:31:20.877 | ||
| MERVALUE | 191.00 | 8.90 | 175.02 | 0.00 | 0.00 | 29.00 | 2.00 | 5.54K | 16-Oct-2025 14:31:12.817 | ||
| NEWGOLD | 57,000.00 | 7.02 | 54,015.60 | 0.00 | 0.00 | 0.00 | 0.00 | 2.00 | 1.00 | 114.00K | 16-Oct-2025 14:31:12.833 |
| NSLTECH | 0.91 | 6.59 | 0.89 | 0.00 | 0.00 | 15.87 | 5.12B | 2.06M | 126.00 | 1.86M | 16-Oct-2025 14:30:20.990 |
| STERLINGNG | 8.20 | 6.10 | 7.83 | 15.75 | 0.30 | 3.19 | 236.08B | 7.78M | 602.00 | 61.57M | 16-Oct-2025 14:31:12.553 |
| LIVESTOCK | 7.90 | 5.06 | 7.73 | 0.00 | 0.00 | 2.94 | 23.70B | 3.40M | 114.00 | 26.90M | 16-Oct-2025 14:30:19.800 |
| TIP | 14.00 | 4.93 | 13.80 | 0.00 | 12.46B | 1.47M | 123.00 | 19.88M | 16-Oct-2025 14:31:18.823 | ||
| JAPAULGOLD | 2.66 | 4.51 | 2.62 | 0.19 | 12.01 | 0.90 | 16.66B | 4.85M | 198.00 | 12.70M | 16-Oct-2025 14:30:19.267 |
| LINKASSURE | 2.09 | 4.31 | 2.04 | 59.89 | 0.02 | 5.56 | 29.26B | 6.92M | 55.00 | 14.09M | 16-Oct-2025 14:30:19.670 |
| VFDGROUP | 11.00 | 1.82 | 10.97 | 0.00 | 0.00 | 0.00 | 0.00 | 2.47M | 136.00 | 26.91M | 16-Oct-2025 14:30:23.930 |
| CORNERST | 6.26 | 0.96 | 6.25 | 8.62 | 0.35 | 5.28 | 113.72B | 791.34K | 70.00 | 5.09M | 16-Oct-2025 14:30:16.587 |
| PRESTIGE | 1.70 | 0.59 | 1.69 | 10.49 | 0.08 | 2.50 | 22.53B | 7.53M | 66.00 | 12.98M | 16-Oct-2025 14:30:21.587 |
| FGS202772 | 75.00 | 0.00 | 75.00 | 0.00 | 0.00 | 0.00 | 0.00 | 0.00 | 16-Oct-2025 14:30:43.233 | ||
| UPL | 5.50 | 0.00 | 5.49 | 7.13 | 0.59 | 0.60 | 2.37B | 100.52K | 18.00 | 597.99K | 16-Oct-2025 14:30:23.747 |
NSE: BEAR Signal - Price crossed below 15 Day MA
This signal implies these stocks are under selling pressure and the price might continue to slide and therefore positions should be monitored closely. Further suggested analysis include looking at the overall market (ASI) to see if the downtrend is market wide, sector wide or specific to the stock. If the overal market trend is upwards, then since these stocks are heading in the opposite direction, then further analysis should be done using commands like PC and RV on the InfoWARE Market Data Terminal. Another command is ALERTS to set price triggers for possible exit is necessar
For more detailed analysis,
- On InfoWARE Market Data Terminal <BEARM> <GO>
- On InfoWARE Finance Mobile App ( Android , iPhone & iPad and Windows 10)
| Symbol | Price | %Chg | 15DMA | PE | EPS | DivY | MktCap | Vol | Trades | Value | LstTradeTime |
|---|---|---|---|---|---|---|---|---|---|---|---|
| NGXMERIVAL | 13,538.74 | -0.24 | 13,553.03 | 12.13 | 38.38 | 0.00 | 0.00 | 117.80M | 6,088.00 | 4.65B | 16-Oct-2025 14:30:45.103 |
| UPDC | 6.35 | -2.36 | 6.45 | 0.00 | 0.00 | 34.25 | 117.86B | 2.29M | 125.00 | 14.66M | 16-Oct-2025 14:30:23.613 |
| NEM | 28.15 | -3.55 | 28.26 | 24.99 | 0.37 | 6.52 | 141.21B | 489.68K | 68.00 | 13.87M | 16-Oct-2025 14:30:20.547 |
| CHAMS | 3.95 | -3.80 | 3.96 | 27.02 | 0.07 | 1.56 | 18.55B | 16.83M | 503.00 | 67.81M | 16-Oct-2025 14:30:16.157 |
| CUSTODIAN | 42.00 | -4.76 | 42.49 | 3.80 | 3.29 | 1.20 | 247.04B | 2.59M | 117.00 | 108.16M | 16-Oct-2025 14:30:16.653 |
| DAARCOMM | 1.03 | -6.80 | 1.08 | 0.00 | 0.00 | 0.00 | 12.36B | 7.78M | 142.00 | 8.30M | 16-Oct-2025 14:30:16.837 |
| HMCALL | 4.05 | -8.15 | 4.24 | 0.00 | 0.00 | 0.00 | 0.00 | 1.32M | 37.00 | 5.50M | 16-Oct-2025 14:31:12.533 |
| SUNUASSUR | 5.21 | -10.75 | 5.69 | 0.00 | 0.00 | 0.99 | 30.27B | 845.51K | 52.00 | 4.44M | 16-Oct-2025 14:30:22.343 |
| LOTUSHAL15 | 93.42 | -11.11 | 96.02 | 0.00 | 0.00 | 2.74K | 17.00 | 274.41K | 16-Oct-2025 14:31:20.290 |
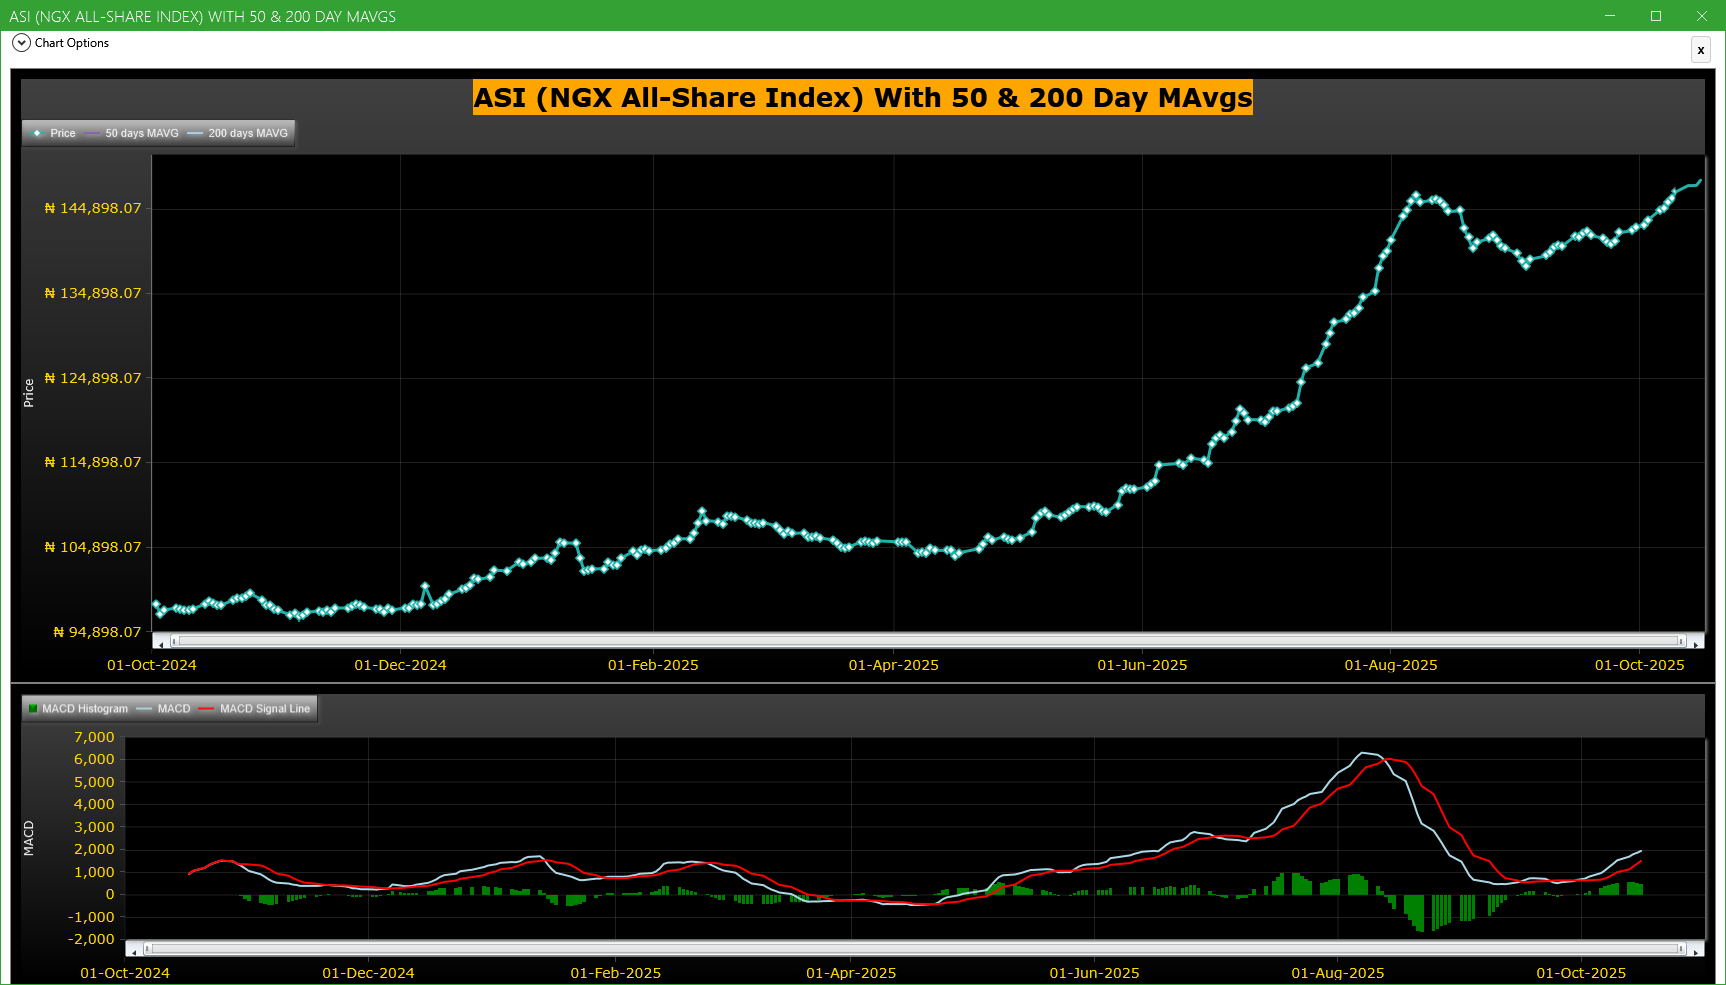
Market Trend - ASI (NGX All-Share-Index) With 50 & 200 Day MAvgs Chart
Technical traders typically use the 50 & 200 day moving averages to aid in choosing
where to enter or exit a position, which then causes these levels to act as strong
support or resistance. As a general guideline, if the price is above a moving average,
the trend is up. If the price is below a moving average, the trend is down.
It is important to note that critics of technical analysis say that moving averages act
as support and resistance because so many traders use these indicators to inform their
trading decisions. Also moving averages tend to work quite well in strong trending conditions
but poorly in choppy or ranging conditions.
Trading Strategies: Crossovers
Crossovers are one of the main moving average strategies. The first type is a price crossover,
which is when the price crosses above or below a moving average to signal a potential change
in trend. Another strategy is to apply two moving averages to a chart: one longer and one
shorter. When the shorter-term MA crosses above the longer-term MA, it is a buy signal, as
it indicates that the trend is shifting up. This is known as a golden cross. Meanwhile, when
the shorter-term MA crosses below the longer-term MA, it is a sell signal, as it indicates that
the trend is shifting down. This is known as a dead/death cross
For more detailed analysis,
- On InfoWARE Market Data Terminal <CI> <GO>
- On InfoWARE Finance Mobile App ( Android , iPhone & iPad and Windows 10) , "Research"
Unusual Volume: Volume traded is more than double the 90 day moving average (All exchanges; ASI & ASem). For more detailed analysis,
- On InfoWARE Market Data Terminal <UV> <GO>
- On InfoWARE Finance Mobile App ( Android , iPhone & iPad and Windows 10)
| Symbol | Name | Volume | 90DAvgVol | %VolChg | Price | LClose | %Chg | Trades | Value |
|---|---|---|---|---|---|---|---|---|---|
| TANTALIZER | TANTALIZERS PLC | 22.23M | 5.29M | 320.69 | 2.35 | 2.33 | 0.86 | 109 | 51.10M |
| CWG | COMPUTER WAREHOUSE GROUP PLC | 6.06M | 2.65M | 128.27 | 18.50 | 18.15 | 1.93 | 216 | 108.68M |
| VITAFOAM | VITAFOAM NIG PLC. | 1.96M | 889.23K | 120.45 | 84.50 | 84.50 | 0.00 | 212 | 162.97M |
| ETERNA | ETERNA PLC. | 1.12M | 395.28K | 183.01 | 41.00 | 41.00 | 0.00 | 149 | 45.67M |
| NIDF | CHAPEL HILL DENHAM NIG. INFRAS DEBT FUND | 963.07K | 219.94K | 337.88 | 113.00 | 113.00 | 0.00 | 162 | 107.51M |
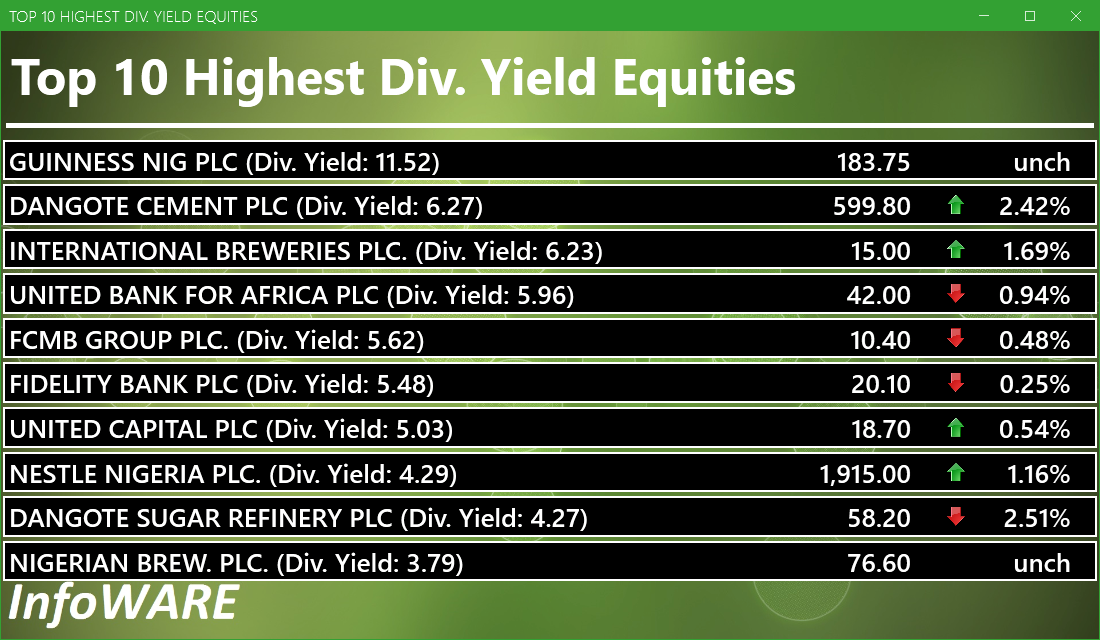
Investment Insights - High Div. Stocks
Dividend stocks distribute a portion of the company earnings to investors on a regular basis and they can a great choice for investors looking for regular income. As an investment or trading strategy, high dividend yield equities provide annual cash payments as against mostly capital gains in the price of a stock. The list in the table below represent the highest dividend paying stocks from the list of the most liquid stocks in the NSE top 30.
For more detailed analysis,
- On InfoWARE Market Data Terminal <HYIELD> <GO>
- On InfoWARE Finance Mobile App ( Android , iPhone & iPad and Windows 10) , "Research"
African Markets
| Name | LClose | Change | %Chg |
|---|---|---|---|
| BRVM Stock Exchange | 332.88 | -0.70 | -0.21 |
| Egyptian Exchange | 37,459.13 | 48.63 | 0.13 |
| Ghana Stock Exchange | 8,495.76 | 14.42 | 0.17 |
| Malawi Stock Exchange | 607,051.41 | -121.43 | -0.02 |
| Tunis Stock Exchange | 12,346.16 | -3.71 | -0.03 |
Nigeria Market Indexes
| Symbol | LClose | %Chg | WTD% | MTD% | QTD% | YTD% | MktCap | Trades |
|---|---|---|---|---|---|---|---|---|
| ASI | 148,355.04 | 0.41 | 0.43 | 3.76 | 3.76 | 43.78 | 22,256 | |
| NGX30 | 5,416.94 | 0.44 | 0.51 | 3.81 | 3.81 | 42.00 | 12,646 | |
| NGXAFRBVI | 3,515.78 | -0.11 | -0.52 | -0.95 | -0.95 | 41.72 | 4,760 | |
| NGXAFRHDYI | 22,083.18 | 0.15 | -0.22 | -0.80 | -0.80 | 29.69 | 6,096 | |
| NGXASEM | 1,392.88 | 0.00 | 0.00 | -9.44 | -9.44 | -12.05 | 4 | |
| NGXBNK | 1,518.17 | 0.21 | -0.31 | 0.09 | 0.09 | 39.61 | 5,160 | |
| NGXCG | 4,150.78 | 0.19 | -0.28 | 2.47 | 2.47 | 46.71 | 11,677 | |
| NGXCNSMRGDS | 3,451.86 | 0.24 | 0.42 | 2.04 | 2.04 | 99.03 | 2,964 | |
| NGXCOMMDTY | 1,171.50 | 0.09 | 0.09 | 4.43 | 4.43 | 17.15 | ||
| NGXGROWTH | 15,335.24 | 0.37 | 0.15 | 1.75 | 1.75 | 97.55 | 229 | |
| NGXINDUSTR | 5,424.39 | 1.44 | 1.82 | 7.04 | 7.04 | 51.87 | 2,036 | |
| NGXINS | 1,277.86 | -1.35 | -0.48 | 6.84 | 6.84 | 62.54 | 1,470 | |
| NGXLOTUSISLM | 12,476.44 | 0.70 | 0.82 | 5.10 | 5.10 | 79.06 | 4,204 | |
| NGXMAINBOARD | 7,134.12 | 0.13 | 0.20 | 1.27 | 1.27 | 42.57 | 16,386 | |
| NGXMERIGRW | 10,060.70 | 0.35 | -1.23 | 1.59 | 1.59 | 54.23 | 3,509 | |
| NGXMERIVAL | 13,538.74 | -0.24 | -0.76 | 1.28 | 1.28 | 29.80 | 6,088 | |
| NGXOILGAS | 2,664.25 | 0.18 | 0.18 | 5.47 | 5.47 | -1.73 | 436 | |
| NGXPENBRD | 2,755.28 | 0.41 | 0.29 | 3.93 | 3.93 | 50.43 | 18,300 | |
| NGXPENSION | 6,893.80 | 0.22 | -0.04 | 2.32 | 2.32 | 52.05 | 14,149 | |
| NGXPREMIUM | 14,917.67 | 0.95 | 0.89 | 8.95 | 8.95 | 53.27 | 5,641 | |
| NGXSOVBND | 665.94 | 0.00 | 0.49 | 1.32 | 1.32 | 10.71 | 0 |
For more detailed analysis,
- On InfoWARE Market Data Terminal <MKTINS> <GO>
- On InfoWARE Finance Mobile App ( Android, iPhone & iPad and Windows 10) , "Market Indexes"
Find the topic interesting? Will like to comment? Contact Us at solutions@infowarelimited.com
Top News

Chart Of The Day - ASI Chart Vs ASI Advance Decline Line (YTD) (16-Oct-2025 15:06:45.133)
InfoWARE AI Analyst Daily Market Report: 16-Oct-2025

[XNSA]>> H2 2025 BC/DR TEST
[MERGROWTH]>> DAILY INDICATIVE PRICES
[LOTUSHAL15]>> DAILY INDICATIVE PRICES
[VETINDETF]>> DAILY INDICATIVE PRICES
[XNSA]>> NGX FIXED INCOME INDICATIVE PRICE LIST FOR OCT 16, 2025
[SIAMLETF40]>> DAILY INDICATIVE PRICES
[XNSA]>> CORDROS MILESTONE FUNDS' BID & OFFER PRICES
[XNSA]>> 29TH ANNUAL STOCKBROKERS CONFERENCE: JOIN US LIVE!
[XNSA]>> AELP CAPACITY BUILDING & ASSDA FORUM
[XNSA]>> DELISTING OF SMART PRODUCTS PLC AND MIGRATION OF JULI PLC TO GROWTH BOA
Chart Of The Day - ASI Chart Vs ASI Advance Decline Line (YTD) (15-Oct-2025 15:17:10.151)
InfoWARE AI Analyst Daily Market Report: 15-Oct-2025
[XNSA]>> REINSTATEMENT OF ECL ASSET MANAGEMENT LIMITED
[VETBANK]>> DAILY INDICATIVE PRICES
[XNSA]>> TIMELY NOTIFICATION AND PRIOR APPROVAL OF CORPORATE CHANGES
[XNSA]>> NGX FIXED INCOME INDICATIVE PRICE LIST FOR OCT 15, 2025
[SIAMLETF40]>> DAILY INDICATIVE SERVICE
[XNSA]>> CORDROS MILESTONE FUNDS' BID & OFFER PRICES
[XNSA]>> COUNTDOWN BEGINS - 29TH ANNUAL STOCKBROKERS CONFERENCE
[XNSA]>> AELP CAPACITY BUILDING & ASSDA FORUM
[XNSA]>> DELISTING OF SMART PRODUCTS PLC AND MIGRATION OF JULI PLC TO GROWTH BOA
Chart Of The Day - ASI Chart Vs ASI Advance Decline Line (YTD) (14-Oct-2025 15:07:09.195)
InfoWARE AI Analyst Daily Market Report: 14-Oct-2025
[MERVALUE]>> DAILY INDICATIVE PRICES
[XNSA]>> RESIGNATION OF A DIRECTOR (NIGERIAN STOCKBROKERS LIMITED)
[XNSA]>> DAILY INDICATIVE PRICES
[XNSA]>> NGX FIXED INCOME INDICATIVE PRICE LIST FOR OCT 14, 2025
[XNSA]>> COUNTDOWN BEGINS: JUST ONE DAY TO THE 29TH ANNUAL STOCKBROKERS CONFEREN
Get IDIA - the stock trading app for the modern investor
Solutions by Business
Product Suites
Company
Contacts
- 8th Floor,
- South Atlantic Petroleum Towers,
- 1 Adeola Odeku Street,
- Victoria Island,
- Lagos, Nigeria.
- Email: solutions@infowarelimited.com
Follow Us
 |
 |
 |
 |