


InfoWARE AI Analyst Daily Market Report: 27-Oct-2025 | InfoWARE Finance
Get IDIA - the stock trading app for the modern investor


InfoWARE AI Analyst Daily Market Report: 27-Oct-2025
(Source: InfoWARE Terminal, Date: 27-Oct-2025)
Dear Investor,
NGX Market Summary – Monday, October 27, 2025
The NGX All Share Index (ASI) closed marginally lower by -0.10% to 155,645.05 as the market began the week on a cautious note. Notably, trading volume plunged to 414.48M units (down 65% from the prior session), while market turnover slipped substantially by -37.90% to 16.99B Naira—a signal of reduced risk appetite and possibly profit-taking after recent robust gains. Market breadth was soft at 0.79x (30 gainers vs 38 losers), with declines outpacing advances, and most sectors reflecting a lackluster mood. Despite today's mild selloff, the YTD ASI return holds strong at 50.70%, while top gainers like ARADEL (+10.00%) and ASOSAVINGS (+9.09%) continue to post outsized returns. Meanwhile, a strong Naira buoyed sentiment in the background, appreciating by 0.16% versus the USD. As we start a new week, let's take a bird's-eye view of key trends, notable movers, and hidden opportunities shaping the market landscape.
Market Breadth & Notable Trends
- Market Breadth: Breadth tilted bearish, with 38 declining stocks overpowering 30 advancers (breadth ratio: 0.79x).
-
Turnover & Volume:
- Turnover fell sharply (-37.90% vs previous day), reflecting lower institutional activity and possible caution ahead.
- Volume dropped to 414.48M units, with only 90 stocks showing volume gains.
-
Notable Volume Surges:
-
ASOSAVINGS (+9.09%) traded 933% above its 90-day average!
FIRSTHOLDCO and ACCESSCORP both also saw volume more than double their typical average.
-
ASOSAVINGS (+9.09%) traded 933% above its 90-day average!
-
Bullish Momentum:
- Several gainers (e.g., ASOSAVINGS - RSI 84.3, ARADEL - RSI 80.6) are deeply overbought, suggesting short-term upside could be capped and profit-taking may set in soon.
- Technical crossovers (15DMA > 50DMA) in ETERNA, CHAMS, and others, with strong MACD readings, reinforce positive momentum—momentum traders take note.
-
Bearish Momentum:
- DEAPCAP and CHAMPION sit among both today's losers and bearish-momentum stocks, reinforcing ongoing sell pressure.
- RSI values in the 50–55 range, not yet oversold, suggest lower prices may still be possible for some laggards.
Top Movers: Gainers & Losers (Gains, Losses)
| Stock | Close | % Chg | RSI | MACD |
|---|---|---|---|---|
| ARADEL | 869.00 | +10.00% | 80.7 | 44.96 |
| NEM | 32.90 | +9.67% | 57.3 | 0.25 |
| ASOSAVINGS | 0.72 | +9.09% | 84.3 | 0.02 |
| ETERNA | 43.50 | +8.75% | 58.5 | 1.79 |
| CHAMS | 4.25 | +7.59% | 54.7 | 0.18 |
| Stock | Close | % Chg | RSI | MACD |
| DEAPCAP | 1.58 | -9.71% | 53.2 | 0.02 |
| CHAMPION | 15.00 | -9.64% | 54.9 | 0.07 |
| REDSTAREX | 10.05 | -8.64% | 50.3 | 0.01 |
| WAPIC | 2.90 | -6.45% | 48.9 | -0.02 |
| UNIVINSURE | 1.10 | -5.98% | 52.0 | 0.01 |
- ARADEL is in a strong technical trend—record RSI (80.7), highest MACD among gainers, and big institutional inflows (over N5.3B today!)
- ASOSAVINGS is momentum king: top gainer last 5 days (+30.9%), outrageous volume spike, but RSI in overbought territory—short-term caution may be warranted despite its run.
- DEAPCAP and CHAMPION not only topped today's losers, but also show bearish momentum signals (price below 15DMA, negative recent returns, tepid RSI)—these stocks are in sustained downtrends.
YTD Gainers & Losers Table – Monday Spotlight
| Top YTD Gainers | YTD %Chg | This Week %Chg |
|---|---|---|
| THE INITIATES PLC (TIP) | +468.0% | -3.40% |
| EUNISELL INTERLINKED (EUNISELL) | +216.3% | +5.18% |
| WEMA BANK (WEMABANK) | +141.8% | +7.32% |
| N.E.M INSURANCE (NEM) | +174.2% | +9.67% |
| CAP PLC (CAP) | +94.7% | 0.00% |
| Top YTD Losers | YTD %Chg | This Week %Chg |
| OANDO PLC | -36.2% | -2.21% |
| JOHN HOLT PLC | -16.6% | 0.00% |
| DEAPCAP | +31.7% | -9.71% |
| MULTIVERSE (MULTIVERSE) | +55.9% | 0.00% |
| REDSTAREX | +127.9% | -8.64% |
- N.E.M INSURANCE is the rare stock present in both today’s top gainers and YTD outperformers (+174.2% YTD): strong evidence of both short and long-term momentum.
- DEAPCAP sits atop the daily and YTD loser lists, despite being technically up YTD—a signal that it’s rolling over after prior runs.
- TIP (THE INITIATES PLC) holds an astronomical +468% YTD but negative this week (-3.40%), suggesting profit-taking is accelerating in high flyers.
Momentum Tables – Bullish & Bearish Insights
| Bullish Momentum (Above 15DMA, Positive RSI/MACD) | ||||
| Stock | Close | RSI | 15DMA | MACD |
|---|---|---|---|---|
| ETERNA | 43.50 | 58.5 | 40.80 | 1.79 |
| CHAMS | 4.25 | 54.7 | 4.12 | 0.18 |
| ASOSAVINGS | 0.72 | 84.3 | 0.54 | 0.02 |
| ARADEL | 869.00 | 80.7 | 583.3 | 44.96 |
| Bearish Momentum (Below 15DMA, Weak RSI/MACD) | ||||
| Stock | Close | RSI | 15DMA | MACD |
| DEAPCAP | 1.58 | 53.2 | 1.72 | 0.02 |
| CHAMPION | 15.00 | 54.9 | 16.06 | 0.07 |
| FIRSTHOLDCO | 31.50 | N/A | 31.86 | N/A |
-
Bullish stocks (e.g., ETERNA, CHAMS, ASOSAVINGS, ARADEL) are showing classic momentum signatures: price above fast-moving averages, elevated RSI, and positive/expanding MACD.
However, ASOSAVINGS and ARADEL have RSI above 80 — usually considered extremely overbought; traders should monitor for signs of reversal. - Bearish candidates (e.g., DEAPCAP, CHAMPION, FIRSTHOLDCO) show price slipping below 15DMA, with RSI not yet at a true oversold level—further declines may be possible before a base forms.
Contrarian Signals
- CHAMPION BREWERIES: Despite a neutral RSI (54.4) and slightly bullish MACD, its -9.8% YTD performance and aggressive -9.6% drop today signal a potential disconnect between price action and momentum indicators, hinting at a possible rebound if selling abates.
- DEAPCAP: Up YTD (31.7%), but today's bearish cross below 15DMA, consistent negative returns and drifting MACD, underline a clear momentum breakdown—caution for bottom fishers.
- NEM: Both a short-term top gainer and strong YTD performer, but RSI of 57 is not yet overbought; investors could be caught trailing the rally as momentum could eventually cool.
Sector Heatmaps
| Sector | Sector Trend | Strongest Performer | Lagging Stock |
|---|---|---|---|
| Financials | Mixed, high volume spikes (ASOSAVINGS, ACCESSCORP) | ASOSAVINGS (+9.09%) | ACCESSCORP (-5.40%) |
| Insurance | Mildly bullish, scattered momentum | NEM (+9.67%) | UNIVINSURE (-5.98%), WAPIC (-6.45%) |
| Beverages | Bearish | -- | CHAMPION (-9.64%) |
| Petroleum | Bullish, strong technicals | ETERNA (+8.75%) | -- |
| Diversified Ind. | Mixed, high retail interest | UACN (+1.55%) | -- |
- Financial sector is seeing unusual volume spikes, signaling sector rotation or renewed speculation.
- Insurance stocks appear bifurcated: NEM's spectacular run stands in contrast to persistent weakness in WAPIC and UNIVINSURE.
- Petroleum stocks (ETERNA, ARADEL) are seeing new bullish surges—likely sector-wide trigger.
Dividend–Beta Matrix: Defensive Playbook
| Stock | Dividend Yield | Beta | Momentum |
|---|---|---|---|
| CORNERST | 5.28% | 0.93 | Bullish (Cross above 15DMA) |
| LIVESTOCK | 2.94% | 0.46 | Bullish (Cross above 15DMA) |
| AFRIPRUD | 1.27% | 0.64 | Neutral |
| ETERNA | 0.68% | 1.34 | Strong Bullish |
| WAPIC | 0.50% | 0.76 | Bearish |
- Defensive opportunities may be found in CORNERST and LIVESTOCK: high yields, low beta, bullish technicals. Suitable for income-focused traders who seek low-risk upside.
- ETERNA is both a high beta play and showing strong bullishness—momentum with some underlying income kicker.
Institutional Clustering Alerts
- ZENITHBANK accounted for 20.17% of institutional traded value today despite slumping -2.53%, highlighting institutional clustering in select blue chips likely due to portfolio repositioning.
- ARADEL's trade value and volume were heavily institutionally driven: over N5.3B institutional activity vs retail N280M, signaling confidence from smart money.
- FIRSTHOLDCO and ACCESSCORP also saw abnormally high volume/turnover with dominance from institutional flows; this can precede major trend reversals or continuations.
Analysis of Dividend Yield in Bullish/Bearish Tables
-
ETERNA: Strong bullish price trend, with moderate 0.68% yield and slightly elevated beta.
CHAMS: Moderate yield 1.56% but high volatility (beta > 1.1), suggesting yield alone should not be relied on in fast-moving stocks. - CONHALLPLC (in bearish table): Dividend yield 2.08% but negative momentum—yield traps possible, watch for value plays among oversold names.
Trader Takeaways & Suggestions
- Momentum traders: Consider partial profit-taking on high-RSI names (ASOSAVINGS, ARADEL, NEM). Potential short-term mean reversion.
- Bargain hunters: Screen for former hot stocks now in sustained selloffs (e.g., DEAPCAP, CHAMPION), but confirm with improved RSI/MACD before acting.
- Defensive income seekers: Focus on low-beta, high-yield stocks with bullish momentum (e.g., CORNERST, LIVESTOCK).
- Institutional tracking: Watch stocks with unusual institutional inflows or clustering, as they can lead to large directional moves (ZENITHBANK, ARADEL, FIRSTHOLDCO). Volatility may spike further around these issues.
- Sector rotation: Petroleum and Insurance sectors are in play; financials show telling volume surges—adapt portfolios accordingly.
- Monitor caution zones: Today’s turnover plunge and rising decliners may signal that broader market correction is not concluded—consider tightening stops or hedges.
Previous Week's Trends
Last week, the NGX ASI was on a steady upward trend, peaking at fresh highs for the year, with financials and select industrials leading. However, by Friday, there were warning signs of exhaustion as volume stalled and more stocks began to lag, setting up the present cautious tone. The abrupt drop in turnover today confirms growing risk aversion as participants await clearer signals.
Trade Activity and Market Microstructure
- Institutionals drove the lion’s share of trade value (88.36% of all Naira traded), but only accounted for 37.93% of trade count—a typical sign of large block trades vs retail "noise.”
- Retail trade volume was lower (38.70% of total), reinforcing the idea that institutions are dictating market direction, especially in blue chips like ARADEL, ACCESSCORP, ZENITHBANK, and MTNN.
- Top Retail Traded Symbols: MTNN, ACCESSCORP, ARADEL, ZENITHBANK, DANGCEM.
- Top Institutional Traded Symbols: ARADEL (heavyweight), ACCESSCORP, FIRSTHOLDCO, MTNN, ZENITHBANK.
-
Patterns Noted:
- Heavy institutional trading in gainers (ARADEL), but also in decliners (ZENITHBANK, ACCESSCORP), may reflect both accumulation on rallies and repositioning on weakness—a sign of rotation rather than a one-way market.
- Unusual volume in speculative or low-priced stocks (ASOSAVINGS, UACN, TIP) indicates retail crowd chasing momentum, highlighting risks as well as opportunity for nimble traders.
- Correlation with technicals: Most institutional "targets” today are trending—ARADEL (bullish, high volume), ZENITHBANK (bearish on the day, high institutional volume, perhaps distribution).
Hidden Insight: The steep drop in turnover and rising decliners, despite still-strong YTD returns, suggests the NGX is now entering a testing phase—with leadership narrowing to stocks with extraordinary technical patterns or institutional sponsorship. Aggressive profit-taking in overbought winners may create short-term volatility, while defensive, high-dividend, low-beta stocks with bullish crossovers warrant close focus as safe havens. Traders should adapt with a blend of sector rotation, technical discipline, and attention to order flow.
|
Top ASI Gainers Over Last 5 Trading Days
|
Top ASI Losers Over Last 5 Trading Days
|
For more detailed analysis, on InfoWARE Market Data Terminal <NSEPERF> <GO>
On InfoWARE Finance Mobile App (Android, iPhone & iPad, Windows Phone and Windows 8/10), "Top Gainers & Losers"
ARADEL HOLDINGS PLC (ARADEL) topped the advancers list closing at N869.00 with a gain of 10.00% followed by N.E.M INSURANCE CO (NIG) PLC. (NEM) which closed at N32.90 with a gain of 9.67%.
On the flip side DEAP CAPITAL MANAGEMENT & TRUST PLC (DEAPCAP) and CHAMPION BREW. PLC. (CHAMPION) topped the decliners log with a loss of -9.71% at a close of N1.58, and -9.64% to close the day at N15.00 respectively.
| Symbol | LClose | %Chg |
|---|---|---|
| ARADEL | 869.00 | 10.00 |
| NEM | 32.90 | 9.67 |
| ASOSAVINGS | 0.72 | 9.09 |
| ETERNA | 43.50 | 8.75 |
| CHAMS | 4.25 | 7.59 |
| Symbol | LClose | %Chg |
|---|---|---|
| DEAPCAP | 1.58 | -9.71 |
| CHAMPION | 15.00 | -9.64 |
| LOTUSHAL15 | 70.00 | -9.09 |
| REDSTAREX | 10.05 | -8.64 |
| WAPIC | 2.90 | -6.45 |
For more detailed analysis,
- On InfoWARE Market Data Terminal <TOPG> <GO>
- On InfoWARE Finance Mobile App ( Android, iPhone & iPad and Windows 10) , "Top Gainers & Losers"
Currency Market
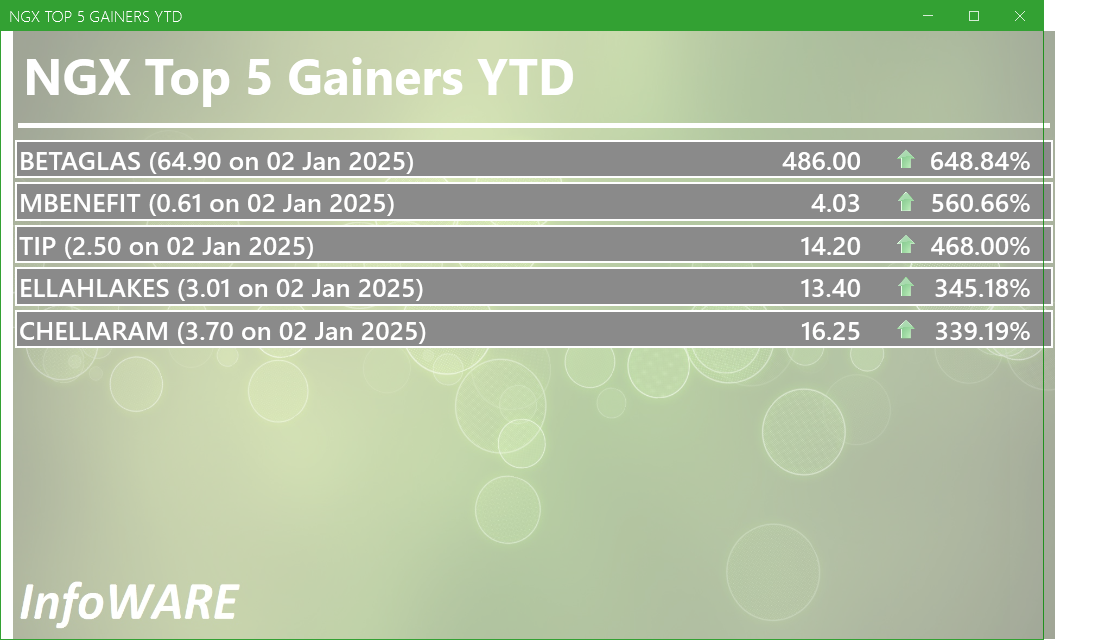
In the currency market, the Naira appreciated 0.16%(2.30) against the Dollar to settle at 1 to 1Investment Insights - Top 5 Gainers YTD
These stocks are the best performers whose price has risen faster than the market as a whole with the best returns year to date. Momentum investors believe that stocks that have outperformed the market will often continue to do so because the factors that caused them to outperform will not suddenly disappear. In addition, other investors seeking to benefit from the stock’s outperformance will often purchase the stock, further bidding its price higher and pushing the stock higher still
For more detailed analysis,
- On InfoWARE Market Data Terminal <T5YTD2> <GO>
- On InfoWARE Finance Mobile App ( Android , iPhone & iPad and Windows 10) , "Research"
NSE: Bull Signal - Price crossed above 15 Day MA
This signal implies these stocks are under buying pressure and the price might continue to rise and therefore positions should be monitored closely. Further suggested analysis include looking at the overall market (ASI) to see if the uptrend is market wide, sector wide or specific to the stock. Portfolio managers tend to use this as a signal to do more research to add to their positions or lock in some profits. Typically further analysis should be done using commands like PC and RV on the InfoWARE Market Data Terminal. Another command is ALERTS to set price triggers for possible exit or entry as necessary
For more detailed analysis,
- On InfoWARE Market Data Terminal <NSEPERF> <GO>
- On InfoWARE Finance Mobile App ( Android , iPhone & iPad and Windows 10) , "Top Gainers & Losers"
| Symbol | Price | %Chg | 15DMA | PE | EPS | DivY | MktCap | Vol | Trades | Value | LstTradeTime |
|---|---|---|---|---|---|---|---|---|---|---|---|
| ETERNA | 43.50 | 8.05 | 40.80 | 29.51 | 0.75 | 0.68 | 56.73B | 912.40K | 233.00 | 37.70M | 27-Oct-2025 14:30:26.883 |
| CHAMS | 4.25 | 7.06 | 4.12 | 27.02 | 0.07 | 1.56 | 19.96B | 10.19M | 382.00 | 41.75M | 27-Oct-2025 14:30:20.717 |
| HMCALL | 4.43 | 6.77 | 4.30 | 0.00 | 0.00 | 0.00 | 0.00 | 3.09M | 42.00 | 13.48M | 27-Oct-2025 14:30:28.023 |
| CORNERST | 6.67 | 6.60 | 6.42 | 8.62 | 0.35 | 5.28 | 121.17B | 1.35M | 91.00 | 8.42M | 27-Oct-2025 14:30:26.413 |
| MEYER | 16.15 | 6.50 | 15.50 | 0.00 | 0.00 | 3.91 | 8.58B | 401.12K | 28.00 | 6.26M | 27-Oct-2025 14:30:28.900 |
| NEWGOLD | 55,555.00 | 5.50 | 54,139.27 | 0.00 | 0.00 | 0.00 | 0.00 | 2.00 | 1.00 | 111.11K | 27-Oct-2025 14:31:17.690 |
| SUNUASSUR | 5.50 | 5.45 | 5.48 | 0.00 | 0.00 | 0.99 | 31.96B | 952.32K | 65.00 | 4.95M | 27-Oct-2025 14:30:30.690 |
| TANTALIZER | 2.40 | 4.17 | 2.33 | 0.00 | 0.00 | 1.50 | 7.71B | 9.46M | 172.00 | 21.27M | 27-Oct-2025 14:30:30.707 |
| LIVESTOCK | 7.80 | 3.85 | 7.77 | 0.00 | 0.00 | 2.94 | 23.40B | 909.22K | 112.00 | 6.94M | 27-Oct-2025 14:30:28.590 |
| UACN | 71.10 | 1.55 | 70.64 | 9.38 | 2.35 | 1.00 | 208.05B | 8.29M | 371.00 | 583.02M | 27-Oct-2025 14:30:31.150 |
| VFDGROUP | 11.10 | 1.35 | 11.07 | 0.00 | 0.00 | 0.00 | 0.00 | 5.22M | 223.00 | 57.49M | 27-Oct-2025 14:30:31.797 |
| NGXINS | 1,289.30 | 1.08 | 1,279.24 | 10.41 | 2.09 | 0.00 | 0.00 | 94.93M | 3,393.00 | 334.32M | 27-Oct-2025 14:30:39.813 |
NSE: BEAR Signal - Price crossed below 15 Day MA
This signal implies these stocks are under selling pressure and the price might continue to slide and therefore positions should be monitored closely. Further suggested analysis include looking at the overall market (ASI) to see if the downtrend is market wide, sector wide or specific to the stock. If the overal market trend is upwards, then since these stocks are heading in the opposite direction, then further analysis should be done using commands like PC and RV on the InfoWARE Market Data Terminal. Another command is ALERTS to set price triggers for possible exit is necessar
For more detailed analysis,
- On InfoWARE Market Data Terminal <BEARM> <GO>
- On InfoWARE Finance Mobile App ( Android , iPhone & iPad and Windows 10)
| Symbol | Price | %Chg | 15DMA | PE | EPS | DivY | MktCap | Vol | Trades | Value | LstTradeTime |
|---|---|---|---|---|---|---|---|---|---|---|---|
| TRANSCORP | 47.90 | -0.52 | 48.03 | 0.00 | 0.00 | 0.23 | 1,947.04B | 4.52M | 333.00 | 217.54M | 27-Oct-2025 14:30:30.850 |
| FIRSTHOLDCO | 31.50 | -1.43 | 31.86 | 0.00 | 0.00 | 66.57M | 730.00 | 2.09B | 27-Oct-2025 14:31:19.560 | ||
| NGXCG | 4,115.02 | -1.82 | 4,157.23 | 443.35 | 327.97 | 0.00 | 0.00 | 184.65M | 19,026.00 | 11.22B | 27-Oct-2025 14:30:39.277 |
| STERLINGNG | 7.70 | -3.90 | 7.91 | 15.75 | 0.30 | 3.19 | 221.69B | 4.67M | 635.00 | 36.61M | 27-Oct-2025 14:30:30.597 |
| CONHALLPLC | 4.51 | -3.99 | 4.54 | 69.63 | 0.03 | 2.08 | 48.28B | 5.08M | 116.00 | 23.02M | 27-Oct-2025 14:31:17.587 |
| CADBURY | 69.50 | -4.32 | 69.52 | 33.25 | 0.64 | 1.88 | 130.54B | 503.24K | 309.00 | 34.98M | 27-Oct-2025 14:30:20.553 |
| VERITASKAP | 2.05 | -5.37 | 2.12 | 48.77 | 0.02 | 4.17 | 28.43B | 11.62M | 175.00 | 24.06M | 27-Oct-2025 14:30:31.770 |
| UNIVINSURE | 1.10 | -6.36 | 1.13 | 0.00 | 0.00 | 0.00 | 17.60B | 19.16M | 139.00 | 21.23M | 27-Oct-2025 14:30:31.340 |
| CHAMPION | 15.00 | -10.67 | 16.06 | 412.83 | 0.01 | 0.41 | 117.44B | 1.89M | 276.00 | 29.59M | 27-Oct-2025 14:30:20.697 |
| DEAPCAP | 1.58 | -10.76 | 1.72 | 188.84 | 0.01 | 13.76 | 2.37B | 2.18M | 75.00 | 3.59M | 27-Oct-2025 14:30:26.623 |
| FGS202770 | 72.00 | -80.56 | 118.13 | 0.00 | 0.00 | 199.00 | 1.00 | 143.28K | 27-Oct-2025 14:30:37.317 |
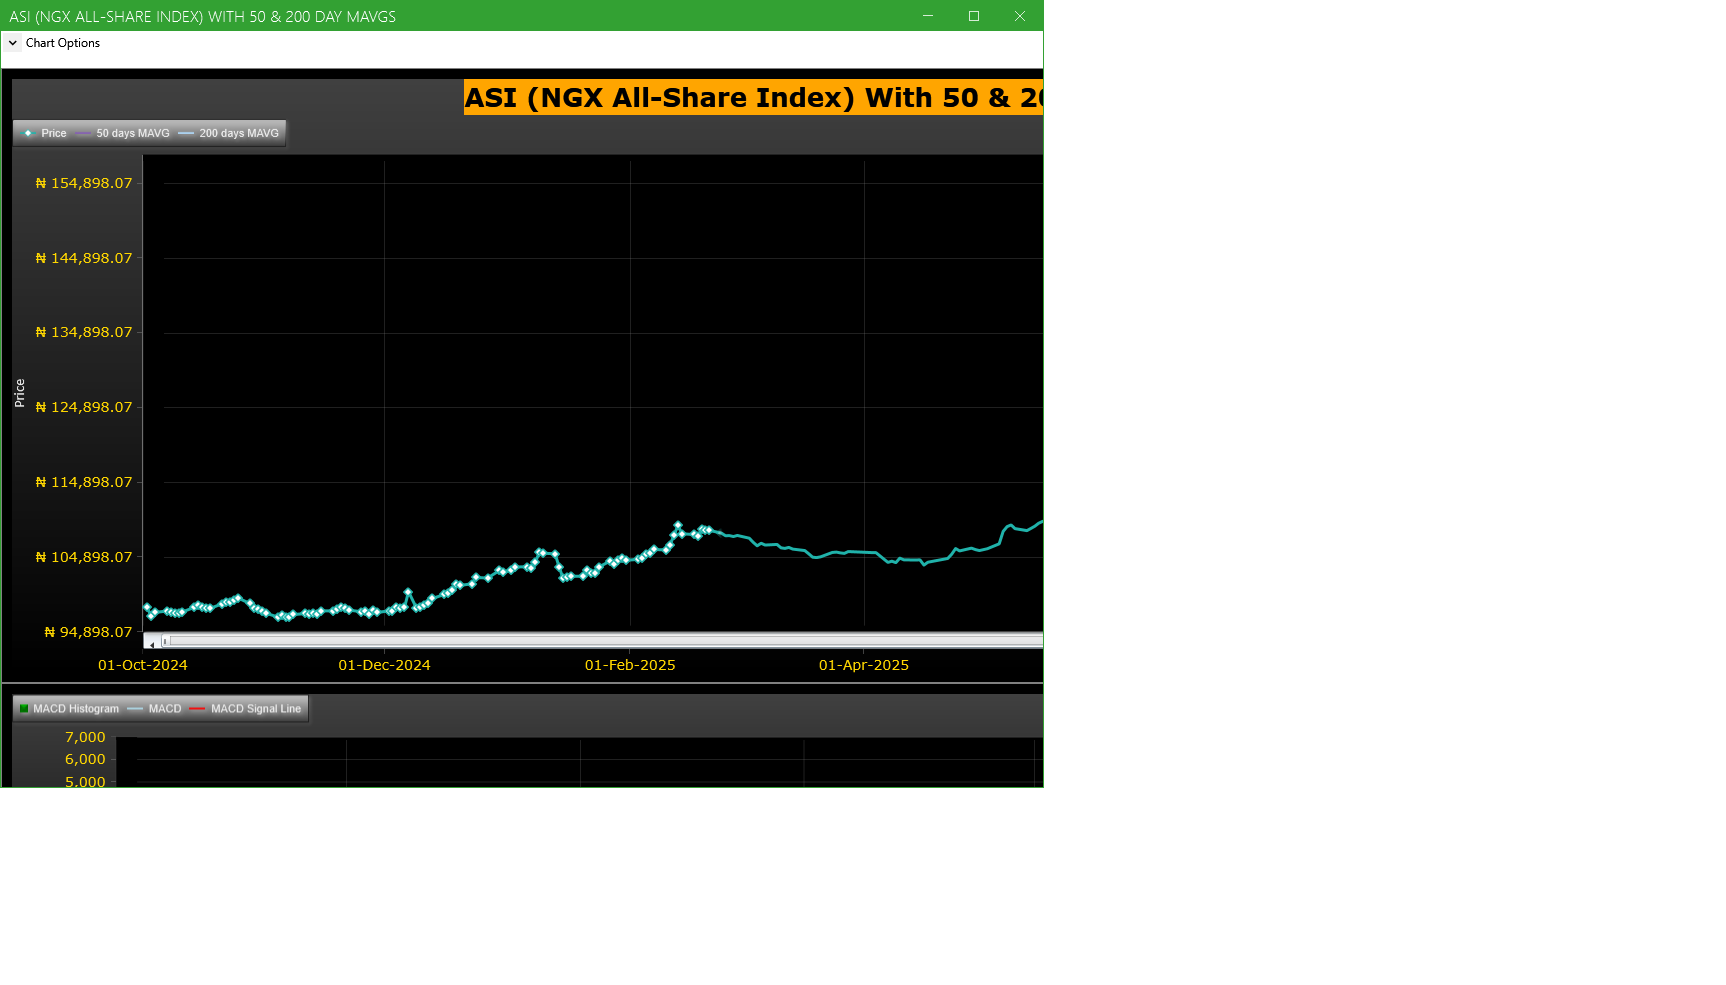
Market Trend - ASI (NGX All-Share-Index) With 50 & 200 Day MAvgs Chart
Technical traders typically use the 50 & 200 day moving averages to aid in choosing
where to enter or exit a position, which then causes these levels to act as strong
support or resistance. As a general guideline, if the price is above a moving average,
the trend is up. If the price is below a moving average, the trend is down.
It is important to note that critics of technical analysis say that moving averages act
as support and resistance because so many traders use these indicators to inform their
trading decisions. Also moving averages tend to work quite well in strong trending conditions
but poorly in choppy or ranging conditions.
Trading Strategies: Crossovers
Crossovers are one of the main moving average strategies. The first type is a price crossover,
which is when the price crosses above or below a moving average to signal a potential change
in trend. Another strategy is to apply two moving averages to a chart: one longer and one
shorter. When the shorter-term MA crosses above the longer-term MA, it is a buy signal, as
it indicates that the trend is shifting up. This is known as a golden cross. Meanwhile, when
the shorter-term MA crosses below the longer-term MA, it is a sell signal, as it indicates that
the trend is shifting down. This is known as a dead/death cross
For more detailed analysis,
- On InfoWARE Market Data Terminal <CI> <GO>
- On InfoWARE Finance Mobile App ( Android , iPhone & iPad and Windows 10) , "Research"
Unusual Volume: Volume traded is more than double the 90 day moving average (All exchanges; ASI & ASem). For more detailed analysis,
- On InfoWARE Market Data Terminal <UV> <GO>
- On InfoWARE Finance Mobile App ( Android , iPhone & iPad and Windows 10)
| Symbol | Name | Volume | 90DAvgVol | %VolChg | Price | LClose | %Chg | Trades | Value |
|---|---|---|---|---|---|---|---|---|---|
| ACCESSCORP | Access Holdings PLC | 68.92M | 33.24M | 107.32 | 23.65 | 25.00 | -5.40 | 2,236 | 1.62B |
| FIRSTHOLDCO | FIRST HOLDCO PLC | 66.57M | 17.51M | 280.26 | 31.50 | 31.95 | -1.41 | 730 | 2.09B |
| UACN | U A C N PLC. | 8.29M | 2.73M | 203.63 | 71.10 | 70.00 | 1.57 | 371 | 583.02M |
| TIP | THE INITIATES PLC | 7.00M | 3.28M | 113.51 | 14.20 | 14.70 | -3.40 | 318 | 100.94M |
| ASOSAVINGS | ASO SAVINGS AND LOANS PLC | 4.36M | 421.91K | 933.05 | 0.72 | 0.66 | 9.09 | 17 | 3.14M |
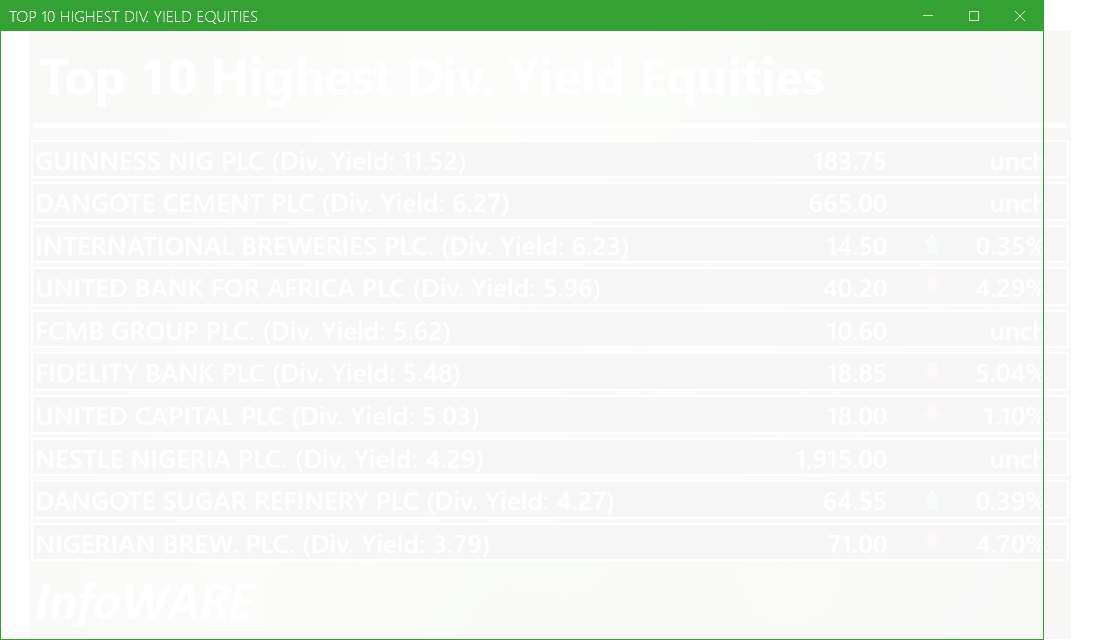
Investment Insights - High Div. Stocks
Dividend stocks distribute a portion of the company earnings to investors on a regular basis and they can a great choice for investors looking for regular income. As an investment or trading strategy, high dividend yield equities provide annual cash payments as against mostly capital gains in the price of a stock. The list in the table below represent the highest dividend paying stocks from the list of the most liquid stocks in the NSE top 30.
For more detailed analysis,
- On InfoWARE Market Data Terminal <HYIELD> <GO>
- On InfoWARE Finance Mobile App ( Android , iPhone & iPad and Windows 10) , "Research"
Investment Insights - Stocks outperforming the ASI but with approximately the same risk
These list of stocks represent equities that are less risky than the ASI but doing better than the ASI (All Shares Index) using the YTD (Year to Date) returns as the measure. The risk is measured by Beta. Beta is an assessment of a stock's tendency to undergo price changes, (its volatility), as well as its potential returns compared to the ASI. It is expressed as a ratio, where a score of 1 represents performance comparable to the ASI, and returns above or below the market may receive scores greater or lower than 1.
For a full list of both positively and negatively corelated stocks visit InfoWARE Market Data Terminal
- On InfoWARE Market Data Terminal <BANL> <GO>
- On InfoWARE Finance Mobile App ( Android , iPhone & iPad and Windows 10)
| Symbol | DivYield | PE | EPS | Beta | %ChgYTD | ASIYTDReturn | BetaDiff |
|---|---|---|---|---|---|---|---|
| HONYFLOUR | 1.40 | 16.28 | 0.31 | 0.99 | 232.37 | 50.70 | 0.01 |
| CAVERTON | 5.52 | 1.15 | 1.57 | 0.98 | 150.20 | 50.70 | 0.02 |
| ROYALEX | 7.81 | 0.00 | 0.00 | 0.96 | 100.00 | 50.70 | 0.04 |
| CORNERST | 5.28 | 8.62 | 0.35 | 0.93 | 68.43 | 50.70 | 0.07 |
| UNIVINSURE | 0.00 | 0.00 | 0.00 | 0.83 | 52.78 | 50.70 | 0.17 |
| FTNCOCOA | 1.60 | 0.00 | 0.00 | 0.79 | 197.87 | 50.70 | 0.21 |
| NB | 3.79 | 16.95 | 1.60 | 0.79 | 121.88 | 50.70 | 0.21 |
| MAYBAKER | 3.75 | 58.94 | 0.14 | 0.78 | 87.77 | 50.70 | 0.22 |
| UNILEVER | 2.81 | 67.09 | 0.40 | 0.75 | 105.56 | 50.70 | 0.25 |
| VETGOODS | 0.00 | 0.71 | 115.12 | 50.70 | 0.29 |
African Markets
| Name | LClose | Change | %Chg |
|---|---|---|---|
| BRVM Stock Exchange | 339.36 | 1.99 | 0.59 |
| Botswana Stock Exchange | 10,617.99 | 0.00 | 0.00 |
| Egyptian Exchange | 37,687.04 | 108.98 | 0.29 |
| Ghana Stock Exchange | 8,367.12 | -11.73 | -0.14 |
| Johannesburg Stock Exchange | 110,443.70 | -299.01 | -0.27 |
| Casablanca Stock Exchange | 19,443.32 | 58.16 | 0.30 |
| Malawi Stock Exchange | 593,333.78 | 2,422.74 | 0.41 |
| Nigeria Stock Exchange | 155,645.05 | 1,158.65 | 0.75 |
| Nairobi Securities Exchange | 179.81 | 1.00 | 0.56 |
| Namibian Stock Exchange | 2,022.26 | -18.78 | -0.92 |
| Rwanda Stock Exchange | 179.16 | 0.00 | 0.00 |
| Tunis Stock Exchange | 12,482.95 | 22.43 | 0.18 |
| Uganda Securities Exchange | 1,480.24 | 0.44 | 0.03 |
Nigeria Market Indexes
| Symbol | LClose | %Chg | WTD% | MTD% | QTD% | YTD% | MktCap | Trades |
|---|---|---|---|---|---|---|---|---|
| ASI | 155,496.15 | -0.10 | 0.00 | 8.75 | 8.75 | 50.70 | 36,348 | |
| NGX30 | 5,688.04 | -0.08 | 0.00 | 9.01 | 9.01 | 49.10 | 21,580 | |
| NGXAFRBVI | 3,348.91 | -2.90 | 0.00 | -5.65 | -5.65 | 34.99 | 7,502 | |
| NGXAFRHDYI | 21,452.13 | -1.58 | 0.00 | -3.63 | -3.63 | 25.98 | 9,462 | |
| NGXASEM | 1,392.88 | 0.00 | 0.00 | -9.44 | -9.44 | -12.05 | 11 | |
| NGXBNK | 1,468.25 | -1.98 | 0.00 | -3.20 | -3.20 | 35.02 | 8,043 | |
| NGXCG | 4,115.02 | -1.79 | 0.00 | 1.58 | 1.58 | 45.45 | 19,026 | |
| NGXCNSMRGDS | 3,609.82 | -0.65 | 0.00 | 6.71 | 6.71 | 108.14 | 4,963 | |
| NGXCOMMDTY | 1,256.95 | 2.31 | 0.00 | 12.04 | 12.04 | 25.69 | ||
| NGXGROWTH | 15,729.73 | -0.26 | 0.00 | 4.36 | 4.36 | 102.63 | 451 | |
| NGXINDUSTR | 6,017.44 | 0.00 | 0.00 | 18.74 | 18.74 | 68.48 | 4,203 | |
| NGXINS | 1,289.30 | 1.09 | 0.00 | 7.79 | 7.79 | 63.99 | 3,393 | |
| NGXLOTUSISLM | 14,031.32 | 1.53 | 0.00 | 18.20 | 18.20 | 101.37 | 8,185 | |
| NGXMAINBOARD | 7,442.40 | 0.22 | 0.00 | 5.65 | 5.65 | 48.73 | 25,238 | |
| NGXMERIGRW | 10,306.58 | 0.90 | 0.00 | 4.07 | 4.07 | 58.00 | 5,005 | |
| NGXMERIVAL | 13,233.50 | -2.32 | 0.00 | -1.01 | -1.01 | 26.87 | 10,408 | |
| NGXOILGAS | 3,027.45 | 4.24 | 0.00 | 19.85 | 19.85 | 11.67 | 732 | |
| NGXPENBRD | 2,902.11 | -0.09 | 0.00 | 9.47 | 9.47 | 58.44 | 30,874 | |
| NGXPENSION | 7,061.49 | -0.48 | 0.00 | 4.80 | 4.80 | 55.74 | 23,840 | |
| NGXPREMIUM | 15,776.61 | -0.67 | 0.00 | 15.23 | 15.23 | 62.10 | 10,659 | |
| NGXSOVBND | 665.07 | 0.00 | 0.00 | 1.19 | 1.19 | 10.56 | 0 |
For more detailed analysis,
- On InfoWARE Market Data Terminal <MKTINS> <GO>
- On InfoWARE Finance Mobile App ( Android, iPhone & iPad and Windows 10) , "Market Indexes"
Find the topic interesting? Will like to comment? Contact Us at solutions@infowarelimited.com
Top News

Chart Of The Day - ASI Chart Vs ASI Advance Decline Line (YTD) (27-Oct-2025 15:10:38.192)
InfoWARE AI Analyst Daily Market Report: 27-Oct-2025

[XNSA]>> APPOINTMENT OF A DIRECTOR
[XNSA]>> FBF PRESENTATION BY THE INITIATES PLC
[XNSA]>> FBF PRESENTATION BY THE INITIATES PLC
[XNSA]>> POSTPONED - FBF PRESENTATION BY ELLAH LAKES PLC
Breaking News! Unusual Volume Alert (27-Oct-2025 12:03:54.946)
Breaking News! Bulls Momentum Alert (27-Oct-2025 12:03:54.262)
Breaking News! Bears Momentum Alert (27-Oct-2025 12:03:54.124)
InfoWARE Analyst Daily Market Report (27-Oct-2025 12:03:53.536)
[XNSA]>> EMERGING AFRICA DAILY MUTUAL FUND PRICES
[VSPBONDETF]>> DAILY INDICATIVE PRICES
[LOTUSHAL15]>> DAILY INDICATIVE PRICES
[XNSA]>> NGX FIXED INCOME INDICATIVE PRICE LIST FOR OCT 27, 2025
[XNSA]>> CORDROS MILESTONE FUNDS' BID & OFFER PRICES
[XNSA]>> H2 2025 BC/DR TEST
[XNSA]>> CLOSING GONG CEREMONY
[XNSA]>> AELP CAPACITY BUILDING & ASSDA FORUM
[STANBICETF30]>> DAILY INDICATIVE PRICES
THE KOKO OCTOBER 24, 2025
InfoWARE AI Analyst Weekly Market Report: 24-Oct-2025
Chart Of The Day - ASI Chart Vs ASI Advance Decline Line (YTD) (24-Oct-2025 15:11:01.935)
InfoWARE AI Analyst Daily Market Report: 24-Oct-2025
[MERGROWTH]>> DAILY INDICATIVE PRICES
[VETGOODS]>> DAILY INDICATIVE PRICES
[LOTUSHAL15]>> DAILY INDICATIVE PRICES
[XNSA]>> FBF PRESENTATION BY ELLAH LAKES PLC
[XNSA]>> NGX FIXED INCOME INDICATIVE PRICE LIST FOR OCT 24, 2025
[XNSA]>> H2 2025 BC/DR TEST
[XNSA]>> CLOSING GONG CEREMONY
Get IDIA - the stock trading app for the modern investor
Solutions by Business
Product Suites
Company
Contacts
- 8th Floor,
- South Atlantic Petroleum Towers,
- 1 Adeola Odeku Street,
- Victoria Island,
- Lagos, Nigeria.
- Email: solutions@infowarelimited.com
Follow Us
 |
 |
 |
 |