


InfoWARE AI Analyst Daily Market Report: 24-Oct-2025 | InfoWARE Finance
Get IDIA - the stock trading app for the modern investor


InfoWARE AI Analyst Daily Market Report: 24-Oct-2025
(Source: InfoWARE Terminal, Date: 24-Oct-2025)
Dear Investor,
NGX Market Summary – Friday, October 24, 2025
The Nigerian equities market ended the week on a resoundingly positive note, with the All Share Index (ASI) gaining +0.75% to close at 154,489.90, marking an impressive +50.85% year-to-date (YTD) return. Trading activity was robust, with turnover up +9.54% to ₦27.36B and volumes climbing above one billion shares. Market breadth was healthy at 1.33x, as advancers (36) outstripped decliners (27), reflecting a powerful bullish undertone. In addition to headline index gains, smart money flowed into big names and select momentum stocks, while pockets of heavy institutional activity and unusual volume flagged some critical stocks for close attention.
Key Market Trends and Observations
-
Market Breadth & Activity:
- Advancers: 36 | Decliners: 27 ⇒ Bullish tilt with breadth ratio 1.33x.
- Trading Volume: 1.18B shares (vs. 902.77M prev.) and +9.54% value increase signals growing appetite for risk.
- Turnover: Robust at ₦27.36B, showing real buying conviction as value flows rose outpaced volume growth.
- Volume Up/Down: 62 stocks saw higher turnover; 77 experienced lower – a nuanced dynamic: fresh bets on select equities amidst some profit-taking elsewhere.
-
Top Daily Gainers:
- ASOSAVINGS +10.00% (RSI: 78.5, MACD trending up) — Intense momentum; overbought conditions but with consistent inflows.
- VETINDETF +10.00% (RSI: 63.7) — ETF rally, could indicate sector rotation or a big block trade.
- IKEJAHOTEL +7.89% (Crossed above 15DMA – bullish signal) — Resurgent hospitality play; new institutional interest observed.
- REGALINS +7.44% — Short-term bounce, but RSI still subdued (37.9), suggesting window dressing or value buying.
- CAVERTON +7.08%
-
Top Daily Losers:
- UNIONDICON -9.09% (Substantial drop on 12x normal volume—institutional exit suspected; triggers caution.)
- NEIMETH -6.67% (Hefty YTD gain, now encountering profit-taking.)
- CORNERST -5.61% (Crossed below 15DMA, RSI at 54.1; recent euphoria fading.)
- HMCALL -4.84% (Unusual volume: 8.64M vs. 1.28M 90d avg.)
- STANBICETF30 -4.76%
-
Unusual Volume:
- FIDELITYBK: +1,548.9% to 820.9M shares — possible strategic accumulation; watch for follow-through.
- TANTALIZER: +534.5% volume — speculative flurry or institution-driven?
- CWG, HMCALL, UNIONDICON all saw volumes at least +300% above norm — suggests tactical block moves. Union Dicon combines high loss with record volume: strong sell-off warning.
Momentum & Technical Signals
-
Bullish Momentum (Above 15DMA):
-
IKEJAHOTEL +7.32% — Technical breakout above 15DMA, PE (51.55), moderate Beta (0.70). Watch for possible mean reversion but institutional volume supports move.
[See sparkline: 15DMA (▲) above 50DMA] - NEM +6.33% — Insurance play with significant Div. Yield and strong momentum, PE (24.99), low Beta (defensive characteristic).
- CHAMPION +3.92% — RSI 54.4 is not overbought, but price above 15DMA with bullish MACD, indicating early-stage rally despite weak YTD (-9.8%). Contrarian signal, see below.
- CUSTODIAN +3.70% — MACD positive, solid value and yield characteristics.
- MCNICHOLS — Defensive tilt, high dividend yield, recently entered bullish territory (slight %Chg).
-
IKEJAHOTEL +7.32% — Technical breakout above 15DMA, PE (51.55), moderate Beta (0.70). Watch for possible mean reversion but institutional volume supports move.
-
Bearish Momentum (Below 15DMA):
- UBA -1.43%, price below 15DMA, RSI cooled to 47.1, suggesting profit-taking after previous institutional accumulation.
- CORNERST -5.94%, now below 15DMA with a still-neutral RSI, suggesting the recent rally has run out of steam.
- HMCALL -5.08% — Listed under both high volume and bearish momentum; momentum traders should monitor for possible further downside.
- UNIONDICON -10.00% — Strong sell-off likely to persist, RSI neutral, but not yet oversold.
- STANBICETF30: -5.00% — ETF under pressure, signals sector/market rotation.
Year-To-Date Gainers & Losers: Highlights & Patterns
| Top 5 YTD Gainers | ||||||
|---|---|---|---|---|---|---|
| Stock | Price | % Chg YTD | RSI | 5D% | DivY | Sector |
| NASCON | 113.90 | +279.67% | 73.48 | +10.58% | 3.09% | Food Processing |
| SKYAVN | 99.50 | +197.46% | 70.67 | +10.49% | 1.15% | Transport |
| EUNISELL | 57.50 | +200.73% | 90.84 | +8.93% | 0.31% | Chemicals |
| PZ | 42.90 | +83.74% | 65.47 | +14.19% | 4.59% | Consumer Goods |
| DANGCEM | 649.30 | +38.89% | 75.72 | +10.83% | 6.27% | Building Materials |
| Top 5 YTD Losers | ||||||
|---|---|---|---|---|---|---|
| Stock | Price | % Chg YTD | RSI | 5D% | DivY | Sector |
| CONOIL | 190.70 | -50.75% | 33.44 | -5.83% | 1.17% | Oil & Gas |
| RTBRISCOE | 3.40 | -20.00% | 46.49 | -9.84% | 4.35% | Automotive |
| JOHNHOLT | 6.50 | -16.56% | 32.34 | -9.72% | 1.25% | Conglomerate |
| LIVINGTRUST | 4.18 | -8.45% | 38.33 | -9.68% | 1.67% | Mortgage Bank |
| MULTIVERSE | 12.55 | +55.90% | 38.06 | -9.71% | 0.85% | Mining |
- Hidden YTD Momentum:
- ASOSAVINGS, top gainer today, is also a top 5 YTD and 5-Day performer (YTD: +32%, RSI: 78.5, MACD positive). Warning: extremely overbought, ripe for a short-term correction but still strong momentum.
- NEIMETH: Paradox — massive YTD gain (+123%) but now in the bottom 5 daily losers and showing negative 5D momentum. Possible reversal zone after outsized rally.
- REGALINS: Appears as top daily gainer but is a YTD loser. Likely "oversold bounce" in the short term, not confirmation of trend reversal.
- HMCALL & UNIONDICON: Appear in both ‘unusual volume’ and bearish tables, compounding risk — large positions unwound.
Contrarian Signals – Mixed Technicals
- CHAMPION (CHAMPION BREW. PLC.):
- YTD loss (-9.8%), RSI at 54.4, but price just broke above 15DMA with bullish MACD and healthy volume — possible reversal after a long downtrend. Watch for sustained flows for confirmation.
- CORNERST:
- RSI neutral (54.1), price below 15DMA, MACD turning flat — could whipsaw traders in both directions. Validate with sectoral moves.
- REGALINS: Top daily gainer, but with negative YTD (-16.1%), and low RSI (37.9) — short-term rally or dead cat bounce?
Sector Heatmap & Institutional/Retail Activity
| Sector | Top Performer (Today) | % Chg (Today) | YTD Trend | Institutional Activity | Technical Bias |
|---|---|---|---|---|---|
| Banking | FIDELITYBK | +0.25% | Bullish | ZENITHBANK (20.17% inst. vol/value) | Green (15DMA bull on Zenith drops, caution; Fidelity big volume, accumulation) |
| Insurance | NEM | +6.33% | Mixed-to-Bullish | Some switch from CORNERST (now bearish) | Bullish 15DMA cross (~NEM), but watch pullback risk |
| Hospitality | IKEJAHOTEL | +7.89% | Resurgent | New institutional flows | Bullish |
| Food Products | UNIONDICON | -9.09% | Mixed | Heavy sell/offloading (unusual vol.) | Bearish 15DMA cross, avoid for now |
| Telecom | MTNN | +0.98% | Stable | Heavy dual retail/institution flows | Steady momentum |
Institutional clustering most visible in ZENITHBANK and ARADEL. FIDELITYBK exhibited blockbuster volume (institutional accumulation highly likely).
Dividend-Beta Matrix (Defensive Stock Mapping)
| Stock | Dividend Yield (%) | Beta | Technical Signal |
|---|---|---|---|
| REGALINS | 6.52 | 0.47 | Bullish move, but longer term trend down |
| MCNICHOLS | 5.88 | -0.11 | Bullish 15DMA cross, risk-off candidate |
| PZ | 4.59 | 0.56 | YTD Top gainer, RSI not overbought yet |
| AFRIPRUD | 1.27 | 0.64 | Solid historically, but today neutral |
| NASCON | 3.09 | 1.24 | YTD Top performer, RSI elevated |
- Defensive Dividend Picks: REGALINS and MCNICHOLS combine high yield with low Beta, but MCNICHOLS also has a bullish technical crossover.
- PZ and NASCON: Blend yield, strong trend persistence, and rising volume — worthy of watchlists for both growth and defensive portfolio purposes.
Institutional Clustering Alerts
- ZENITHBANK: 20.17% of total institutional trade value — heavy bank interest. However, technicals are bearish (price below 15DMA, down -0.52% today); possible accumulation phase or window dressing before quarter close.
- ARADEL: Strong institutional buy-side volume supporting short-term gains. Watch for possible further push next week.
- DANGCEM, MTNN, ACCESSCORP: Appear high in both institution/retail order books — market leadership clusters.
Market Activity & Trade Summary — Retail vs. Institutional
- Institutional vs Retail:
- Institutional: 38.57% of trades but a dominant 88.93% of volumes and 93% of value, showing that big moves (and price-setting trades) still rest with institutions.
- Retail: 61.43% of trade count but only 11.1% of volume/value — more active but with smaller tickets, typical of trend followers and speculative flows.
-
Top 5 Institutional Traded Stocks:
- ARADEL (oil), MTNN (telecom), ZENITHBANK, ACCESSCORP, DANGCEM (cement)
- These are mostly mega-cap, sectoral leaders, and/or stocks in the midst of big technical moves. The clustering around these names by institutions strongly suggests a rotation to quality and market influencers.
-
Top 5 Retail Traded Stocks:
- Nearly the same list: MTNN, UBA, DANGCEM, ARADEL, ZENITHBANK
- Shows retail investors are following "hot” institutional names, risking short-term chases but capturing the bulk of momentum.
Currency Market
- Naira improved by +0.18% against the dollar to ₦1,463/$ — positive for importers, potentially supportive for banks and consumer names.
Trader Suggestions & Action Points
-
Opportunities:
- ASOSAVINGS, at a +32% YTD, strong RSI, but overbought. Great for quick trades, but trail stops rigorously.
- Institutional heavyweights (ARADEL, MTNN, DANGCEM): Watch for next leg higher if flows persist.
- Defensive, High Dividend & Low Beta Stock: MCNICHOLS, REGALINS — especially for risk-off or yield-focused portfolios; MCNICHOLS has the added bonus of a bullish 15DMA technical breakout.
- Unusual Volume Candidates: FIDELITYBK, HMCALL, UNIONDICON — ride momentum on breakouts, but stay nimble; for negative moves (e.g., UNIONDICON), avoid catching falling knives.
-
Cautions:
- Several YTD gainers (NEIMETH, REGALINS) among today's losers — beware sharp mean-reversion trades!
- UNIONDICON, HMCALL: Both high negative momentum and huge volume spikes — risk of more downside if institutional exits continue.
- ZENITHBANK: Heavy institutional clustering but bearish technicals — only enter when technicals confirm rebound.
- Market Breadth cooling—while bullish, the volume-down crowd (77 stocks) could signal a rotating market. Stockpicking matters more than ever.
Ending Note: Hidden Insights
- Institutions setting the tone; retail flows are strong but follow-the-leader in character. Pay particular attention to which "institutional favorites" break out or falter next week.
- Sector leadership is forming around Banks, Building Materials, and select Consumer Goods. Insurance and Real Estate bear watching for possible mean reversion.
- Momentum stocks (ASOSAVINGS, ARADEL, IKEJAHOTEL, NEM) have persistent flows, but watch technicals for exits as some are extremely extended (high RSIs).
As ever, diligent traders and portfolio managers should resist chasing whipsaw moves and instead wait for alignment of technical momentum, institutional flows, and fundamental value. The next phase of leadership is likely to emerge from today's institutional clusters and defensive high-yield plays with bullish reversals.
|
Top ASI Gainers Over Last 5 Trading Days
|
Top ASI Losers Over Last 5 Trading Days
|
For more detailed analysis, on InfoWARE Market Data Terminal <NSEPERF> <GO>
On InfoWARE Finance Mobile App (Android, iPhone & iPad, Windows Phone and Windows 8/10), "Top Gainers & Losers"
ASO SAVINGS AND LOANS PLC (ASOSAVINGS) topped the advancers list closing at N0.66 with a gain of 10.00% followed by VETIVA INDUSTRIAL ETF (VETINDETF) which closed at N59.40 with a gain of 10.00%.
On the flip side UNION DICON SALT PLC. (UNIONDICON) and NEIMETH INTERNATIONAL PHARMACEUTICALS PLC (NEIMETH) topped the decliners log with a loss of -9.09% at a close of N8.00, and -6.67% to close the day at N5.60 respectively.
| Symbol | LClose | %Chg |
|---|---|---|
| ASOSAVINGS | 0.66 | 10.00 |
| VETINDETF | 59.40 | 10.00 |
| Ikejahotel | 20.50 | 7.89 |
| REGALINS | 1.30 | 7.44 |
| CAVERTON | 6.50 | 7.08 |
| Symbol | LClose | %Chg |
|---|---|---|
| UNIONDICON | 8.00 | -9.09 |
| NEIMETH | 5.60 | -6.67 |
| CORNERST | 6.23 | -5.61 |
| LOTUSHAL15 | 77.00 | -5.06 |
| HMCALL | 4.13 | -4.84 |
For more detailed analysis,
- On InfoWARE Market Data Terminal <TOPG> <GO>
- On InfoWARE Finance Mobile App ( Android, iPhone & iPad and Windows 10) , "Top Gainers & Losers"
Currency Market
In the currency market, the Naira appreciated 0.18%(2.57) against the Dollar to settle at 1 to 1Investment Insights - Top 5 Gainers YTD
These stocks are the best performers whose price has risen faster than the market as a whole with the best returns year to date. Momentum investors believe that stocks that have outperformed the market will often continue to do so because the factors that caused them to outperform will not suddenly disappear. In addition, other investors seeking to benefit from the stock’s outperformance will often purchase the stock, further bidding its price higher and pushing the stock higher still
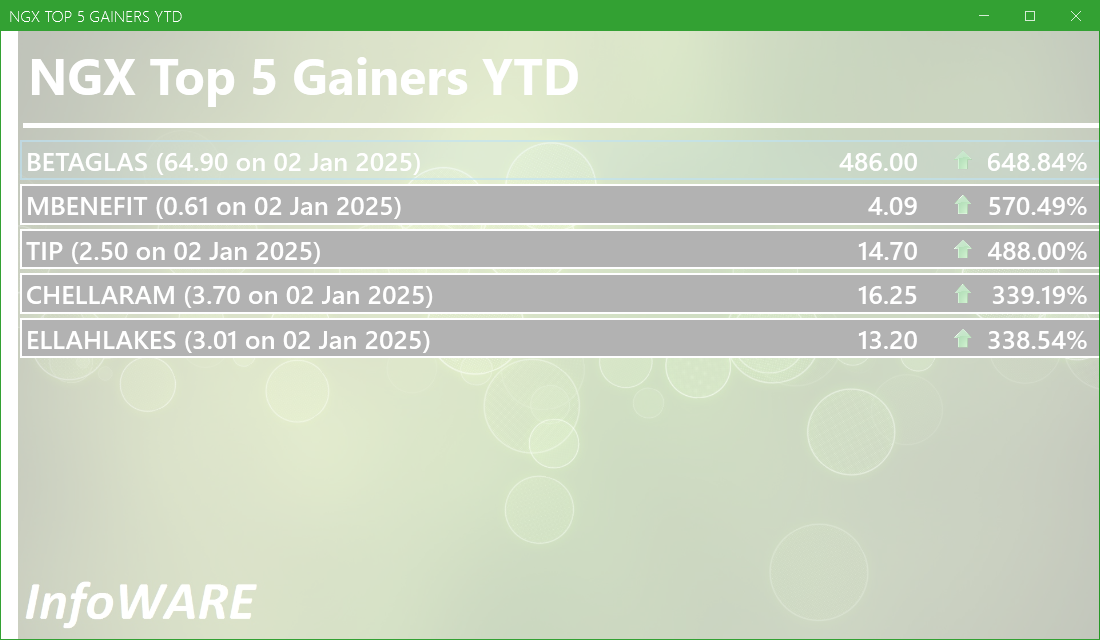
For more detailed analysis,
- On InfoWARE Market Data Terminal <T5YTD2> <GO>
- On InfoWARE Finance Mobile App ( Android , iPhone & iPad and Windows 10) , "Research"
NSE: Bull Signal - Price crossed above 15 Day MA
This signal implies these stocks are under buying pressure and the price might continue to rise and therefore positions should be monitored closely. Further suggested analysis include looking at the overall market (ASI) to see if the uptrend is market wide, sector wide or specific to the stock. Portfolio managers tend to use this as a signal to do more research to add to their positions or lock in some profits. Typically further analysis should be done using commands like PC and RV on the InfoWARE Market Data Terminal. Another command is ALERTS to set price triggers for possible exit or entry as necessary
For more detailed analysis,
- On InfoWARE Market Data Terminal <NSEPERF> <GO>
- On InfoWARE Finance Mobile App ( Android , iPhone & iPad and Windows 10) , "Top Gainers & Losers"
| Symbol | Price | %Chg | 15DMA | PE | EPS | DivY | MktCap | Vol | Trades | Value | LstTradeTime |
|---|---|---|---|---|---|---|---|---|---|---|---|
| IKEJAHOTEL | 20.50 | 7.32 | 19.78 | 51.55 | 0.16 | 0.94 | 42.62B | 1.34M | 90.00 | 26.99M | 24-Oct-2025 14:30:18.920 |
| NEM | 30.00 | 6.33 | 28.73 | 24.99 | 0.37 | 6.52 | 150.49B | 1.58M | 140.00 | 47.29M | 24-Oct-2025 14:30:19.773 |
| CHAMPION | 16.60 | 3.92 | 16.13 | 412.83 | 0.01 | 0.41 | 129.97B | 2.50M | 249.00 | 39.88M | 24-Oct-2025 14:30:11.737 |
| CUSTODIAN | 43.20 | 3.70 | 41.92 | 3.80 | 3.29 | 1.20 | 254.10B | 972.25K | 130.00 | 41.17M | 24-Oct-2025 14:30:12.177 |
| MCNICHOLS | 3.29 | 2.13 | 3.28 | 26.80 | 0.05 | 5.88 | 2.36B | 635.61K | 54.00 | 2.05M | 24-Oct-2025 14:32:26.320 |
NSE: BEAR Signal - Price crossed below 15 Day MA
This signal implies these stocks are under selling pressure and the price might continue to slide and therefore positions should be monitored closely. Further suggested analysis include looking at the overall market (ASI) to see if the downtrend is market wide, sector wide or specific to the stock. If the overal market trend is upwards, then since these stocks are heading in the opposite direction, then further analysis should be done using commands like PC and RV on the InfoWARE Market Data Terminal. Another command is ALERTS to set price triggers for possible exit is necessar
For more detailed analysis,
- On InfoWARE Market Data Terminal <BEARM> <GO>
- On InfoWARE Finance Mobile App ( Android , iPhone & iPad and Windows 10)
| Symbol | Price | %Chg | 15DMA | PE | EPS | DivY | MktCap | Vol | Trades | Value | LstTradeTime |
|---|---|---|---|---|---|---|---|---|---|---|---|
| FG202034S2 | 114.01 | 0.00 | 114.01 | 0.00 | 0.00 | 0.00 | 0.00 | 0.00 | 24-Oct-2025 14:30:23.890 | ||
| NGXMERIVAL | 13,548.25 | -0.40 | 13,601.88 | 12.13 | 38.38 | 0.00 | 0.00 | 882.20M | 7,920.00 | 19.10B | 24-Oct-2025 14:30:27.037 |
| UBA | 42.00 | -1.43 | 42.46 | 8.29 | 4.05 | 5.96 | 1,436.38B | 5.55M | 1,848.00 | 235.10M | 24-Oct-2025 14:32:23.557 |
| INTENEGINS | 2.77 | -4.69 | 2.86 | 0.52 | 2.85 | 3.40 | 3.56B | 335.26K | 30.00 | 929.59K | 24-Oct-2025 14:30:19.007 |
| STANBICETF30 | 500.00 | -5.00 | 517.33 | 0.00 | 0.00 | 2.67K | 50.00 | 1.40M | 24-Oct-2025 14:32:22.600 | ||
| HMCALL | 4.13 | -5.08 | 4.31 | 0.00 | 0.00 | 0.00 | 0.00 | 8.64M | 59.00 | 38.37M | 24-Oct-2025 14:30:18.880 |
| CORNERST | 6.23 | -5.94 | 6.38 | 8.62 | 0.35 | 5.28 | 113.18B | 752.59K | 58.00 | 4.78M | 24-Oct-2025 14:30:12.133 |
| UNIONDICON | 8.00 | -10.00 | 8.23 | 0.00 | 0.00 | 6.25 | 2.19B | 3.27M | 87.00 | 27.83M | 24-Oct-2025 14:30:20.907 |
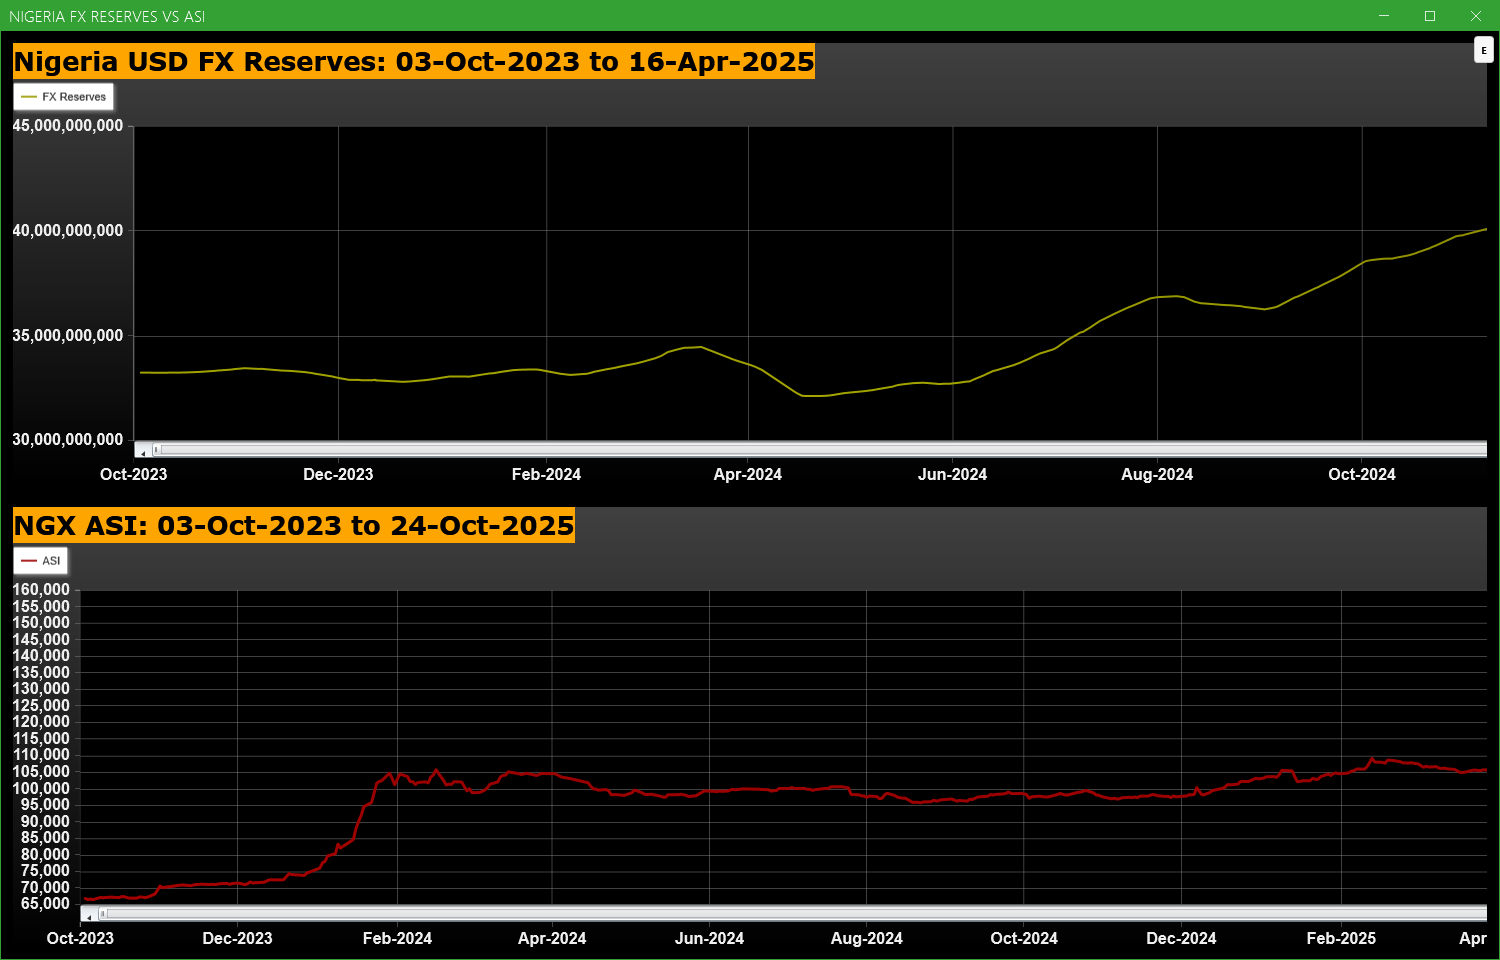
Economic Indicators - Nigeria FX Reserves Vs ASI Chart
Nigeria FX Reserves are assets held on reserve by CBN in foreign currencies. These reserves are used to back liabilities and influence monetary policy. Given the nature of the Nigeria economy, FX Reserves can appear to have an outsize influence on the economy and hence on the capital market. The chart below allows comparison of FX Reserves against the ASI to make investment decisions
For more detailed analysis,
- On InfoWARE Market Data Terminal <CI> <GO>
- On InfoWARE Finance Mobile App ( Android , iPhone & iPad and Windows 10) , "Research"
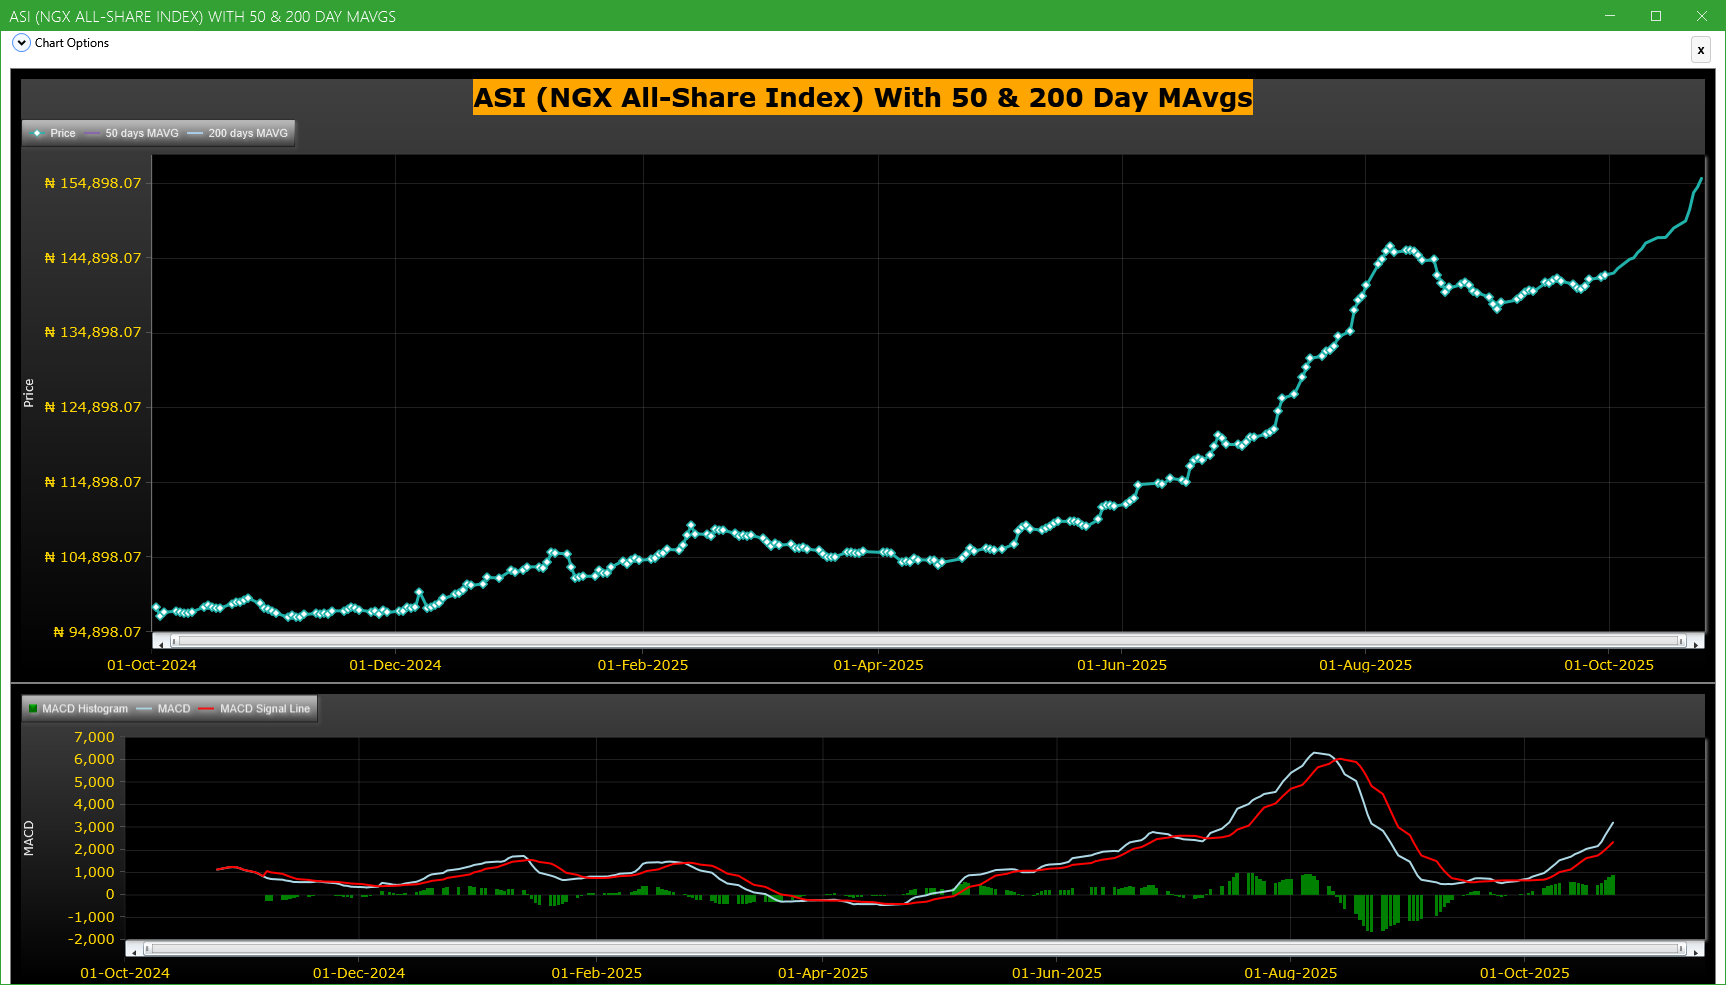
Market Trend - ASI (NGX All-Share-Index) With 50 & 200 Day MAvgs Chart
Technical traders typically use the 50 & 200 day moving averages to aid in choosing
where to enter or exit a position, which then causes these levels to act as strong
support or resistance. As a general guideline, if the price is above a moving average,
the trend is up. If the price is below a moving average, the trend is down.
It is important to note that critics of technical analysis say that moving averages act
as support and resistance because so many traders use these indicators to inform their
trading decisions. Also moving averages tend to work quite well in strong trending conditions
but poorly in choppy or ranging conditions.
Trading Strategies: Crossovers
Crossovers are one of the main moving average strategies. The first type is a price crossover,
which is when the price crosses above or below a moving average to signal a potential change
in trend. Another strategy is to apply two moving averages to a chart: one longer and one
shorter. When the shorter-term MA crosses above the longer-term MA, it is a buy signal, as
it indicates that the trend is shifting up. This is known as a golden cross. Meanwhile, when
the shorter-term MA crosses below the longer-term MA, it is a sell signal, as it indicates that
the trend is shifting down. This is known as a dead/death cross
For more detailed analysis,
- On InfoWARE Market Data Terminal <CI> <GO>
- On InfoWARE Finance Mobile App ( Android , iPhone & iPad and Windows 10) , "Research"
Unusual Volume: Volume traded is more than double the 90 day moving average (All exchanges; ASI & ASem). For more detailed analysis,
- On InfoWARE Market Data Terminal <UV> <GO>
- On InfoWARE Finance Mobile App ( Android , iPhone & iPad and Windows 10)
| Symbol | Name | Volume | 90DAvgVol | %VolChg | Price | LClose | %Chg | Trades | Value |
|---|---|---|---|---|---|---|---|---|---|
| FIDELITYBK | FIDELITY BANK PLC | 820.91M | 49.79M | 1,548.85 | 19.85 | 19.80 | 0.25 | 551 | 16.14B |
| TANTALIZER | TANTALIZERS PLC | 32.67M | 5.15M | 534.51 | 2.30 | 2.25 | 2.22 | 79 | 72.05M |
| CWG | COMPUTER WAREHOUSE GROUP PLC | 10.28M | 2.55M | 303.81 | 18.50 | 18.20 | 1.65 | 249 | 186.70M |
| HMCALL | HALDANE MCCALL PLC | 8.64M | 1.28M | 576.70 | 4.13 | 4.34 | -4.84 | 59 | 38.37M |
| UNIONDICON | UNION DICON SALT PLC. | 3.27M | 244.13K | 1,238.72 | 8.00 | 8.80 | -9.09 | 87 | 27.83M |
Investment Insights - High Div. Stocks
Dividend stocks distribute a portion of the company earnings to investors on a regular basis and they can a great choice for investors looking for regular income. As an investment or trading strategy, high dividend yield equities provide annual cash payments as against mostly capital gains in the price of a stock. The list in the table below represent the highest dividend paying stocks from the list of the most liquid stocks in the NSE top 30.
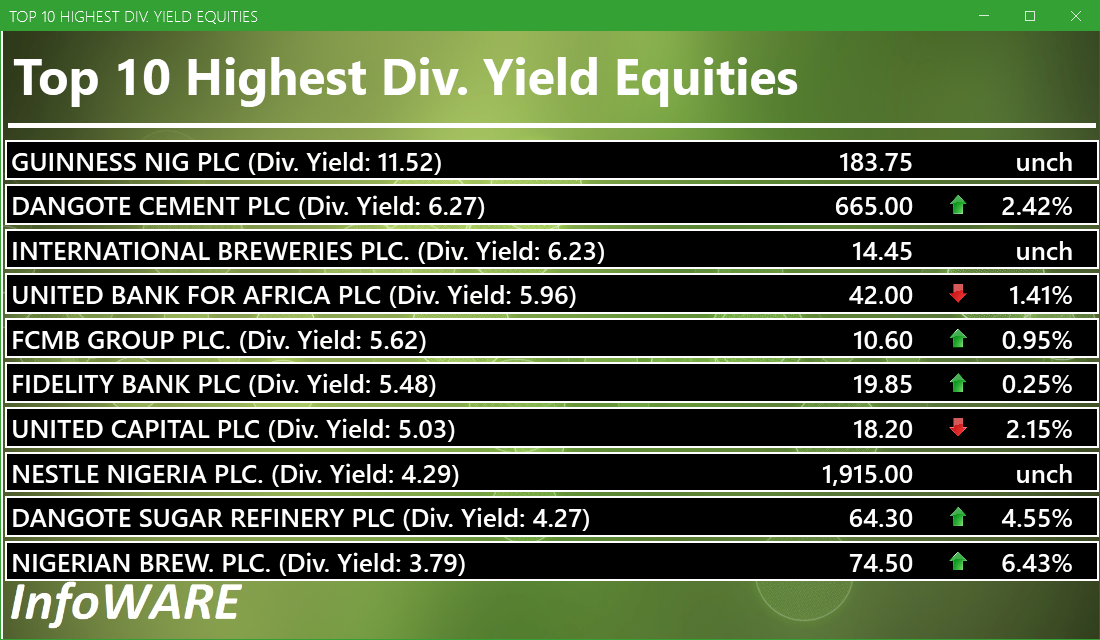
For more detailed analysis,
- On InfoWARE Market Data Terminal <HYIELD> <GO>
- On InfoWARE Finance Mobile App ( Android , iPhone & iPad and Windows 10) , "Research"
Investment Insights - Stocks outperforming the ASI but with approximately the same risk
These list of stocks represent equities that are less risky than the ASI but doing better than the ASI (All Shares Index) using the YTD (Year to Date) returns as the measure. The risk is measured by Beta. Beta is an assessment of a stock's tendency to undergo price changes, (its volatility), as well as its potential returns compared to the ASI. It is expressed as a ratio, where a score of 1 represents performance comparable to the ASI, and returns above or below the market may receive scores greater or lower than 1.
For a full list of both positively and negatively corelated stocks visit InfoWARE Market Data Terminal
- On InfoWARE Market Data Terminal <BANL> <GO>
- On InfoWARE Finance Mobile App ( Android , iPhone & iPad and Windows 10)
| Symbol | DivYield | PE | EPS | Beta | %ChgYTD | ASIYTDReturn | BetaDiff |
|---|---|---|---|---|---|---|---|
| HONYFLOUR | 1.40 | 16.28 | 0.31 | 0.99 | 232.37 | 50.85 | 0.01 |
| CAVERTON | 5.52 | 1.15 | 1.57 | 0.98 | 154.90 | 50.85 | 0.02 |
| ROYALEX | 7.81 | 0.00 | 0.00 | 0.96 | 101.82 | 50.85 | 0.04 |
| CORNERST | 5.28 | 8.62 | 0.35 | 0.93 | 57.32 | 50.85 | 0.07 |
| UNIVINSURE | 0.00 | 0.00 | 0.00 | 0.83 | 62.50 | 50.85 | 0.17 |
| FTNCOCOA | 1.60 | 0.00 | 0.00 | 0.79 | 197.87 | 50.85 | 0.21 |
| NB | 3.79 | 16.95 | 1.60 | 0.79 | 132.81 | 50.85 | 0.21 |
| MAYBAKER | 3.75 | 58.94 | 0.14 | 0.78 | 87.77 | 50.85 | 0.22 |
| UNILEVER | 2.81 | 67.09 | 0.40 | 0.75 | 105.56 | 50.85 | 0.25 |
| VETGOODS | 0.00 | 0.71 | 112.50 | 50.85 | 0.29 |
African Markets
| Name | LClose | Change | %Chg |
|---|---|---|---|
| BRVM Stock Exchange | 337.38 | -1.05 | -0.31 |
| Botswana Stock Exchange | 10,617.99 | 0.00 | 0.00 |
| Egyptian Exchange | 37,687.04 | 108.98 | 0.29 |
| Ghana Stock Exchange | 8,378.59 | -69.27 | -0.82 |
| Johannesburg Stock Exchange | 110,742.69 | 1,904.67 | 1.75 |
| Lusaka Stock Exchange | 25,436.25 | 7.63 | 0.03 |
| Casablanca Stock Exchange | 19,384.53 | -68.08 | -0.35 |
| Malawi Stock Exchange | 590,911.72 | -177.33 | -0.03 |
| Nigeria Stock Exchange | 154,489.90 | 753.31 | 0.49 |
| Nairobi Securities Exchange | 178.80 | 0.45 | 0.25 |
| Namibian Stock Exchange | 2,040.94 | 12.17 | 0.60 |
| Rwanda Stock Exchange | 179.16 | 0.16 | 0.09 |
| Tunis Stock Exchange | 12,461.01 | 33.55 | 0.27 |
| Uganda Securities Exchange | 1,479.76 | 10.87 | 0.74 |
Nigeria Market Indexes
| Symbol | LClose | %Chg | WTD% | MTD% | QTD% | YTD% | MktCap | Trades |
|---|---|---|---|---|---|---|---|---|
| ASI | 155,645.03 | 0.75 | 3.80 | 8.86 | 8.86 | 50.85 | 27,533 | |
| NGX30 | 5,692.66 | 0.75 | 3.95 | 9.10 | 9.10 | 49.22 | 16,728 | |
| NGXAFRBVI | 3,448.78 | -0.47 | -2.31 | -2.84 | -2.84 | 39.02 | 5,530 | |
| NGXAFRHDYI | 21,796.83 | -0.58 | -1.05 | -2.08 | -2.08 | 28.01 | 7,652 | |
| NGXASEM | 1,392.88 | 0.00 | 0.00 | -9.44 | -9.44 | -12.05 | 13 | |
| NGXBNK | 1,497.95 | -0.56 | -1.82 | -1.24 | -1.24 | 37.75 | 6,107 | |
| NGXCG | 4,189.88 | 0.14 | 0.46 | 3.43 | 3.43 | 48.09 | 15,053 | |
| NGXCNSMRGDS | 3,633.37 | 0.95 | 3.85 | 7.41 | 7.41 | 109.49 | 3,873 | |
| NGXCOMMDTY | 1,228.58 | 1.48 | 4.58 | 9.51 | 9.51 | 22.86 | ||
| NGXGROWTH | 15,770.29 | -0.24 | 4.78 | 4.63 | 4.63 | 103.15 | 326 | |
| NGXINDUSTR | 6,017.23 | 1.18 | 8.07 | 18.73 | 18.73 | 68.47 | 3,571 | |
| NGXINS | 1,275.41 | 1.01 | -0.40 | 6.63 | 6.63 | 62.23 | 1,757 | |
| NGXLOTUSISLM | 13,819.80 | 1.14 | 8.78 | 16.41 | 16.41 | 98.34 | 6,867 | |
| NGXMAINBOARD | 7,425.84 | 0.84 | 2.89 | 5.41 | 5.41 | 48.40 | 18,636 | |
| NGXMERIGRW | 10,214.37 | 0.10 | 1.15 | 3.14 | 3.14 | 56.58 | 4,154 | |
| NGXMERIVAL | 13,548.25 | -0.40 | -0.69 | 1.35 | 1.35 | 29.89 | 7,920 | |
| NGXOILGAS | 2,904.21 | 2.96 | 8.42 | 14.97 | 14.97 | 7.12 | 443 | |
| NGXPENBRD | 2,904.68 | 0.78 | 4.14 | 9.56 | 9.56 | 58.58 | 23,480 | |
| NGXPENSION | 7,095.62 | 0.65 | 2.31 | 5.31 | 5.31 | 56.50 | 18,596 | |
| NGXPREMIUM | 15,882.81 | 0.58 | 5.51 | 16.00 | 16.00 | 63.19 | 8,571 | |
| NGXSOVBND | 665.07 | 0.00 | -0.13 | 1.19 | 1.19 | 10.56 | 0 |
For more detailed analysis,
- On InfoWARE Market Data Terminal <MKTINS> <GO>
- On InfoWARE Finance Mobile App ( Android, iPhone & iPad and Windows 10) , "Market Indexes"
Find the topic interesting? Will like to comment? Contact Us at solutions@infowarelimited.com
Top News

THE KOKO OCTOBER 24, 2025
InfoWARE AI Analyst Weekly Market Report: 24-Oct-2025
Chart Of The Day - ASI Chart Vs ASI Advance Decline Line (YTD) (24-Oct-2025 15:11:01.935)
InfoWARE AI Analyst Daily Market Report: 24-Oct-2025

[MERGROWTH]>> DAILY INDICATIVE PRICES
[VETGOODS]>> DAILY INDICATIVE PRICES
[LOTUSHAL15]>> DAILY INDICATIVE PRICES
[XNSA]>> FBF PRESENTATION BY ELLAH LAKES PLC
[XNSA]>> NGX FIXED INCOME INDICATIVE PRICE LIST FOR OCT 24, 2025
[XNSA]>> H2 2025 BC/DR TEST
[XNSA]>> CLOSING GONG CEREMONY
[XNSA]>> AELP CAPACITY BUILDING & ASSDA FORUM
[XNSA]>> VFD GROUP PLC: ACTIVATION OF CODE FOR TRADING IN RIGHTS
[XNSA]>> CORDROS MILESTONE FUNDS' BID & OFFER PRICES
[SIAMLETF40]>> DAILY INDICATIVE PRICES
Chart Of The Day - ASI Chart Vs ASI Advance Decline Line (YTD) (23-Oct-2025 15:11:07.543)
InfoWARE AI Analyst Daily Market Report: 23-Oct-2025
[XNSA]>> APPOINTMENT OF A DIRECTOR
[XNSA]>> RESIGNATION OF A DIRECTOR
[XNSA]>> FBF PRESENTATION BY ELLAH LAKES PLC
[XNSA]>> CORDROS MILESTONE FUNDS' BID & OFFER PRICES
[XNSA]>> H2 2025 BC/DR TEST
[VSPBONDETF]>> DAILY INDICATIVE PRICES
[XNSA]>> CLOSING GONG CEREMONY
[XNSA]>> AELP CAPACITY BUILDING & ASSDA FORUM
[XNSA]>> NGX FIXED INCOME INDICATIVE PRICE LIST FOR OCT 23, 2025
[LOTUSHAL15]>> DAILY INDICATIVE PRICES
[STANBICETF30]>> DAILY INDICATIVE PRICES

MARKET PERFORMANCE REPORT & DAILY PRICE LIST

Daily Market Report
Get IDIA - the stock trading app for the modern investor
Solutions by Business
Product Suites
Company
Contacts
- 8th Floor,
- South Atlantic Petroleum Towers,
- 1 Adeola Odeku Street,
- Victoria Island,
- Lagos, Nigeria.
- Email: solutions@infowarelimited.com
Follow Us
 |
 |
 |
 |