


InfoWARE AI Analyst Daily Market Report: 24-Nov-2025 | InfoWARE Finance
Get IDIA - the stock trading app for the modern investor


InfoWARE AI Analyst Daily Market Report: 24-Nov-2025
(Source: InfoWARE Terminal, Date: 24-Nov-2025)
Dear Investor,
NGX Market Daily Summary – Monday, November 24, 2025
The NGX All-Share Index opened the new week on a soft note, dipping -0.08% to 143,722.62, even as trading activity surged with volume up 7.4% and turnover jumping 13.19% to ₦28.14B. Market breadth was negative, with decliners (30) closely outnumbering advancers (19), as investors saw more pockets of volatility and profit-taking, especially in small- and mid-cap names. Meanwhile, the Naira slipped 0.17% to 1,454/USD.
Weekly Recap
Coming off last week, the ASI cooled after its persistent ascent, with YTD returns easing to 39.19%. Despite the negative breadth, overall trading activity remained robust and select momentum plays continued to push fresh highs, with ETFs and insurance stocks showing increased volatility. Watchers saw a tactical shift with more institutional dominance in volume/value, but rising retail activity in trade count—a flag for increasing speculative trading.
Market Breadth & Activity Trends
- Breadth: Decliners (30) outpaced advancers (19), with a weak breadth ratio of 0.63x, pointing to profit-taking after prior market strength.
- Turnover: Stronger than the previous session (+13.2%)—liquidity remains deep, suggesting institutional presence and high conviction in select names.
- Volume: 685.35M shares traded across 22,847 deals (+7.4% on volume), with up volumes for 76 stocks and down for 67.
- Retail vs Institutional: Institutions dominated, accounting for 82.98% of traded volume and 94.32% of value, while retail investors led in trade count (67.13%).
Top Gainers and Losers
| Gainer | Close | %Chg | RSI |
|---|---|---|---|
| THE SIAML PENSION ETF 40 (SIAMLETF40) | ₦660.00 | 10.00% | 84.01 |
| E-TRANZACT INT'L PLC (ETRANZACT) | ₦14.45 | 9.06% | 35.81 |
| INT'L ENERGY INS. (INTENEGINS) | ₦2.30 | 8.49% | 27.56 |
| NEWGOLD ETF | ₦55,100.00 | 7.83% | 38.40 |
| MCNICHOLS PLC | ₦2.75 | 7.00% | 35.29 |
| Loser | Close | %Chg | RSI |
|---|---|---|---|
| NPF MICROFINANCE BANK (NPFMCRFBK) | ₦2.70 | -7.85% | 48.80 |
| PRESTIGE ASSURANCE (PRESTIGE) | ₦1.36 | -7.48% | 46.13 |
| STERLING NG (STERLINGNG) | ₦6.70 | -6.94% | 42.96 |
| WAPIC INSURANCE (WAPIC) | ₦2.43 | -6.18% | 39.30 |
| DEAP CAPITAL (DEAPCAP) | ₦1.52 | -5.59% | 44.15 |
YTD Top Gainers and Losers (Monday Special)
| Gainer | Price | %ChgYTD | %Chg5Dys | RSI |
|---|---|---|---|---|
| NCR (NIGERIA) PLC | ₦41.10 | 647.27% | 20.88% | 99.07 |
| THE INITIATES PLC (TIP) | ₦11.20 | 364.00% | 4.50% | 43.82 |
| SIAML ETF 40 | ₦600.00 | -17.50% | 10.00% | 84.01 |
| UACN | ₦70.00 | 115.78% | 4.10% | 61.93 |
| JULIUS BERGER | ₦147.00 | -5.31% | 6.37% | 64.98 |
| Loser | Price | %ChgYTD | %Chg5Dys | RSI |
|---|---|---|---|---|
| OMATEK VENTURES | ₦1.11 | 32.50% | -18.46% | 38.66 |
| WAPIC INSURANCE | ₦2.59 | -1.62% | -15.63% | 39.30 |
| LINKAGE ASSURANCE | ₦1.68 | 30.23% | -15.58% | 42.70 |
| VETINDETF | ₦56.00 | 33.81% | -13.71% | 48.07 |
| PRESTIGE ASSURANCE (PRESTIGE) | ₦1.47 | 2.26% | -13.38% | 46.13 |
Momentum Analysis: Bullish & Bearish Breakouts
- RSI Overbought/Bullish: SIAMLETF40’s RSI at 84.01 marks significant overbought momentum, powered by strong ETF inflows—high risk of a near-term pullback but underlying demand is robust. NCR remains extremely overbought (RSI 99.07), likely to draw both momentum hunters and fast profit-takers.
- Bullish 15DMA Crossovers: CILEASING, UPDC, RTBRISCOE, FTNCOCOA all closed above their 15D MA, suggesting a cluster of early-stage rallies in support/logistics, real estate, and autos. Portfolio managers: watch for sector-wide rotation if these breakouts sustain.
- Bearish 15DMA Crossovers: PRESTIGE, NPFMCRFBK, and MERGROWTH ETF all closed below 15DMA—selling pressure is increasing. Notably, both PRESTIGE and NPFMCRFBK were among today’s top losers, showing strong alignment between technical and price weakness.
- Low RSI Bearish Watch: INTENEGINS remains below the 30-level (RSI: 27.6) but up significantly for the day – a possible short-covering or dead-cat bounce scenario.
- MACD Signals: No notable bullish MACD crossovers among high-volume/large-cap names. Some ETF products (SIAMLETF40) showed strong bullish MACD, underlying the surge in passive inflows.
Unusual Volume Alerts
| Stock | Volume | 90D Avg | %VolChg | Close | %Chg |
|---|---|---|---|---|---|
| UNILEVER | 14.89M | 534.26K | 2,686.84% | ₦70.00 | 1.45% |
| GTCO | 203.85M | 22.20M | 818.25% | ₦84.80 | 0.36% |
| FIDELITYBK | 131.51M | 54.93M | 139.40% | ₦19.05 | 0.00% |
| JAPAULGOLD | 68.82M | 17.54M | 292.40% | ₦2.10 | 0.00% |
| NEM | 5.37M | 748.61K | 617.22% | ₦26.00 | 0.00% |
- Surge in UNILEVER, GTCO, JAPAULGOLD volume – watch for news/possible block trades. Consistent upticks in volume without major price spikes can signal quiet accumulation/distribution.
- Top traded by institutions: ZENITHBANK, FIDELITYBK, UBA, ACCESSCORP, FCMB – heavyweights remain institutional favorites for liquidity.
- Top traded by retail: MTNN, ACCESSCORP, ZENITHBANK, UBA, GTCO – overlap with institutional flows but note higher retail interest in telecoms (MTNN).
Sector Heatmap & Institutional/Retail Activity (Top 5 Sectors)
| Sector | Institutional Focus | Retail Focus | Momentum | Beta | Notables |
|---|---|---|---|---|---|
| Banking | ZENITHBANK (20.17%) FIDELITYBK (18.5%) |
GTCO, ZENITHBANK | Strong (High Vol/Value) | 1.09–1.56 | High institutional clustering; retail follows trends |
| Insurance | Low-Mid | WAPIC, NEM, PRESTIGE | Bearish (Biggest Losers Cluster) | Low | Watch for reversal (oversold/short-covering) |
| ETF | SIAMLETF40 (active) | Passive inflows | Bullish (SIAMLETF40, NEWGOLD) | Low | Momentum at extremes—mean reversion risk |
| Telecoms | Low | MTNN (retail-led) | Flat | 1.31 | High-price, high-beta, defensive tilt |
| Real Estate/Conglom | UPDC (bullish 15DMA cross) | UACN (YTD gainer) | Moderate | 0.52–1.10 | Early breakout? Watch for sector rotation |
Dividend–Beta Matrix (Defensive Play Finder)
| Stock | DivY | Beta | Notes |
|---|---|---|---|
| PRESTIGE | 2.50% | –0.17 | Bullish yield, but momentum weak; turning point candidate if price stabilizes |
| NEM | 2.97% | 0.69 | High div + low beta + unusual volume = possible defensive accumulation |
| ACCESSCORP | 1.87% | 1.42 | Attracts both risk-tolerant and income-focused traders |
| LINKASSURE | 5.56% | 0.41 | Highest yield among YTD losers, but price trend is firmly negative; use caution |
| WAPIC | 2.56% | 0.76 | Defensive but currently pressured—ideal for long-term accumulation on further weakness |
Contrarian Signals
- CILEASING: Gained 5.19% with a middling RSI of 41.7 and a bullish 15DMA crossover—momentum could have more room, especially since it led YTD gainers but is not yet technically overbought.
- INTENEGINS: RSI is 27.56 (typically oversold), yet surged 8.49% to be a top gainer—potential short squeeze or reversal play, but high risk.
- PRESTIGE: High dividend yield (2.5%) with negative price momentum and a bearish 15DMA breach suggests possible defensive rotation if downward trend exhausts.
- SIAMLETF40: Up 10% with an extreme overbought RSI (84.0)—momentum may soon meet mean reversion.
- DEAPCAP: Multiyear high PE (188.8) with a declining price and high volatility is a strong caution for buyers despite recent pops.
Institutional Clustering Alerts
- ZENITHBANK: Comprises an estimated 20.17% of institutional trade value share. Strong, steady volume from institutions often forebodes sustained interest, though price drifted sideways – watch for a catalyst or breakout.
- FIDELITYBK: Robust flow from institutions, plus unusual volume, but price movement was neutral – possibly "smart money” rotating positions, so monitor for a directional follow-through.
Market Activity/Trade Summary Analysis
-
Institutions vs. Retail: Institutions took 83% of today's volume and 94% of value traded, while retail investors dominated by a large margin in total trade count (2/3 of trades by "number of deals").
- Institutional: Focused on a few large-cap banks (ZENITHBANK, FIDELITYBK, UBA), controlling market direction and providing stability.
- Retail: Split into high-activity in both blue chips (ZENITHBANK, GTCO, ACCESSCORP) and speculative (MTNN), chasing momentum.
- Correlation alert: Stocks with high institutional AND retail overlap (ZENITHBANK, UBA, ACCESSCORP) tend to see reduced directional volatility, especially on flat days, but are primed for breakouts when news hits.
- Unusual volume outlier: UNILEVER posted a 2,686% volume spike—but on nominal price gain. Smart money may be rotating in quietly.
- Trade Value Insights: Institutional trades concentrated in ZENITHBANK, FIDELITYBK—these are liquidity anchors for local funds.
Traders' Playbook & Strategy Ideas
- Momentum traders: SIAMLETF40, NCR, and NEWGOLD ETF are on fire, but use trailing stops—RSI extremities point to near-term risk of reversals.
- Contrarian opportunity: INTENEGINS and CILEASING are rallying from oversold/neutral RSI—watch for a trend confirmation.
- Caution on PRESTIGE, NPFMCRFBK, DEAPCAP—downtrends are confirmed by both price action and technicals.
- Defensive income seekers: Target high-dividend, low-beta stocks (NEM, LINKASSURE)—wait for technical stabilization on the insurance sector for best entries.
- Track unusual volumes for early signs of large money accumulating (UNILEVER, GTCO).
- Short-term mean reversion setups possible in overextended ETF names, especially if institutional volume fades.
- Watch sector-wide 15DMA breakouts for early trend detection—clusters in logistics, real estate, and autos may flag sector rotation themes.
|
Top ASI Gainers Over Last 5 Trading Days
|
Top ASI Losers Over Last 5 Trading Days
|
For more detailed analysis, on InfoWARE Market Data Terminal <NSEPERF> <GO>
On InfoWARE Finance Mobile App (Android, iPhone & iPad, Windows Phone and Windows 8/10), "Top Gainers & Losers"
THE SIAML PENSION ETF 40 (SIAMLETF40) topped the advancers list closing at N660.00 with a gain of 10.00% followed by E-TRANZACT INTERNATIONAL PLC (ETRANZACT) which closed at N14.45 with a gain of 9.06%.
On the flip side NPF MICROFINANCE BANK PLC (NPFMCRFBK) and PRESTIGE ASSURANCE CO. PLC. (PRESTIGE) topped the decliners log with a loss of -7.85% at a close of N2.70, and -7.48% to close the day at N1.36 respectively.
| Symbol | LClose | %Chg |
|---|---|---|
| SIAMLETF40 | 660.00 | 10.00 |
| ETRANZACT | 14.45 | 9.06 |
| INTENEGINS | 2.30 | 8.49 |
| NEWGOLD | 55,100.00 | 7.83 |
| MCNICHOLS | 2.75 | 7.00 |
| Symbol | LClose | %Chg |
|---|---|---|
| NPFMCRFBK | 2.70 | -7.85 |
| PRESTIGE | 1.36 | -7.48 |
| STERLINGNG | 6.70 | -6.94 |
| WAPIC | 2.43 | -6.18 |
| DEAPCAP | 1.52 | -5.59 |
For more detailed analysis,
- On InfoWARE Market Data Terminal <TOPG> <GO>
- On InfoWARE Finance Mobile App ( Android, iPhone & iPad and Windows 10) , "Top Gainers & Losers"
Currency Market
In the currency market, the Naira fell 0.17%(-2.50) against the Dollar to settle at 1 to 1Investment Insights - Top 5 Gainers YTD
These stocks are the best performers whose price has risen faster than the market as a whole with the best returns year to date. Momentum investors believe that stocks that have outperformed the market will often continue to do so because the factors that caused them to outperform will not suddenly disappear. In addition, other investors seeking to benefit from the stock’s outperformance will often purchase the stock, further bidding its price higher and pushing the stock higher still
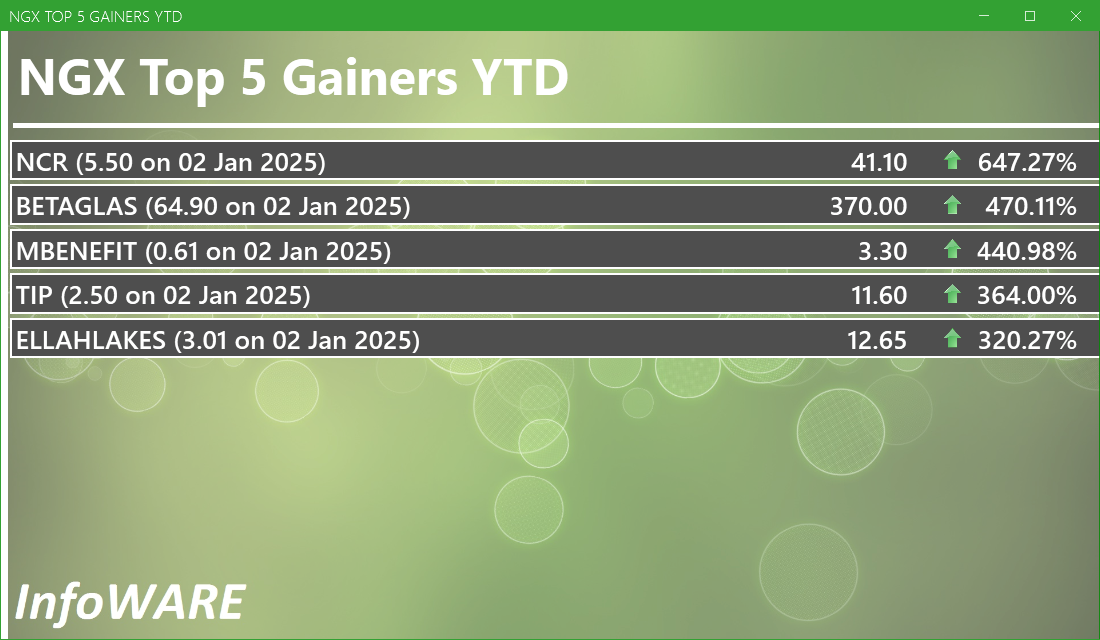
For more detailed analysis,
- On InfoWARE Market Data Terminal <T5YTD2> <GO>
- On InfoWARE Finance Mobile App ( Android , iPhone & iPad and Windows 10) , "Research"
NSE: Bull Signal - Price crossed above 15 Day MA
This signal implies these stocks are under buying pressure and the price might continue to rise and therefore positions should be monitored closely. Further suggested analysis include looking at the overall market (ASI) to see if the uptrend is market wide, sector wide or specific to the stock. Portfolio managers tend to use this as a signal to do more research to add to their positions or lock in some profits. Typically further analysis should be done using commands like PC and RV on the InfoWARE Market Data Terminal. Another command is ALERTS to set price triggers for possible exit or entry as necessary
For more detailed analysis,
- On InfoWARE Market Data Terminal <NSEPERF> <GO>
- On InfoWARE Finance Mobile App ( Android , iPhone & iPad and Windows 10) , "Top Gainers & Losers"
| Symbol | Price | %Chg | 15DMA | PE | EPS | DivY | MktCap | Vol | Trades | Value | LstTradeTime |
|---|---|---|---|---|---|---|---|---|---|---|---|
| CILEASING | 5.59 | 5.19 | 5.34 | 6.50 | 0.64 | 1.20 | 4.37B | 429.19K | 89.00 | 2.32M | 24-Nov-2025 14:30:54.160 |
| UPDC | 6.00 | 5.00 | 5.98 | 0.00 | 0.00 | 34.25 | 111.36B | 2.52M | 97.00 | 14.49M | 24-Nov-2025 14:31:01.533 |
| RTBRISCOE | 3.30 | 4.55 | 3.26 | 0.00 | 0.00 | 4.35 | 3.88B | 492.07K | 36.00 | 1.57M | 24-Nov-2025 14:30:57.543 |
| FTNCOCOA | 5.00 | 2.00 | 4.91 | 0.00 | 0.00 | 1.60 | 19.50B | 1.51M | 134.00 | 7.55M | 24-Nov-2025 14:30:54.993 |
| FGS202766 | 100.00 | 0.00 | 98.33 | 0.00 | 0.00 | 0.00 | 0.00 | 0.00 | 24-Nov-2025 14:31:23.323 | ||
| NGXCNSMRGDS | 3,444.58 | -0.02 | 3,441.88 | 30.19 | 55.24 | 0.00 | 0.00 | 24.75M | 2,885.00 | 1.64B | 24-Nov-2025 14:31:27.333 |
NSE: BEAR Signal - Price crossed below 15 Day MA
This signal implies these stocks are under selling pressure and the price might continue to slide and therefore positions should be monitored closely. Further suggested analysis include looking at the overall market (ASI) to see if the downtrend is market wide, sector wide or specific to the stock. If the overal market trend is upwards, then since these stocks are heading in the opposite direction, then further analysis should be done using commands like PC and RV on the InfoWARE Market Data Terminal. Another command is ALERTS to set price triggers for possible exit is necessar
For more detailed analysis,
- On InfoWARE Market Data Terminal <BEARM> <GO>
- On InfoWARE Finance Mobile App ( Android , iPhone & iPad and Windows 10)
| Symbol | Price | %Chg | 15DMA | PE | EPS | DivY | MktCap | Vol | Trades | Value | LstTradeTime |
|---|---|---|---|---|---|---|---|---|---|---|---|
| FGS202760 | 99.00 | 0.00 | 99.00 | 0.00 | 0.00 | 0.00 | 0.00 | 0.00 | 24-Nov-2025 14:31:23.067 | ||
| FGS202886 | 100.00 | 0.00 | 100.00 | 0.00 | 0.00 | 0.00 | 0.00 | 0.00 | 24-Nov-2025 14:31:24.590 | ||
| FCMB | 10.50 | -1.90 | 10.56 | 104.31 | 0.09 | 5.62 | 207.93B | 37.99M | 708.00 | 386.69M | 24-Nov-2025 14:31:51.127 |
| NGXSOVBND | 645.96 | -3.92 | 667.59 | 0.00 | 0.00 | 0.00 | 0.00 | 951.00 | 2.00 | 286.00K | 24-Nov-2025 14:31:28.510 |
| MERGROWTH | 400.00 | -5.00 | 416.52 | 0.00 | 0.00 | 483.00 | 2.00 | 198.20K | 24-Nov-2025 14:31:51.297 | ||
| PRESTIGE | 1.36 | -8.09 | 1.43 | 10.49 | 0.08 | 2.50 | 18.02B | 1.67M | 60.00 | 2.37M | 24-Nov-2025 14:30:57.253 |
| NPFMCRFBK | 2.70 | -8.52 | 2.88 | 5.63 | 0.27 | 8.00 | 16.18B | 875.15K | 47.00 | 2.37M | 24-Nov-2025 14:30:56.883 |
| FG152028S1 | 30.00 | -226.67 | 93.47 | 0.00 | 28.68B | 951.00 | 2.00 | 286.00K | 24-Nov-2025 14:31:18.583 |
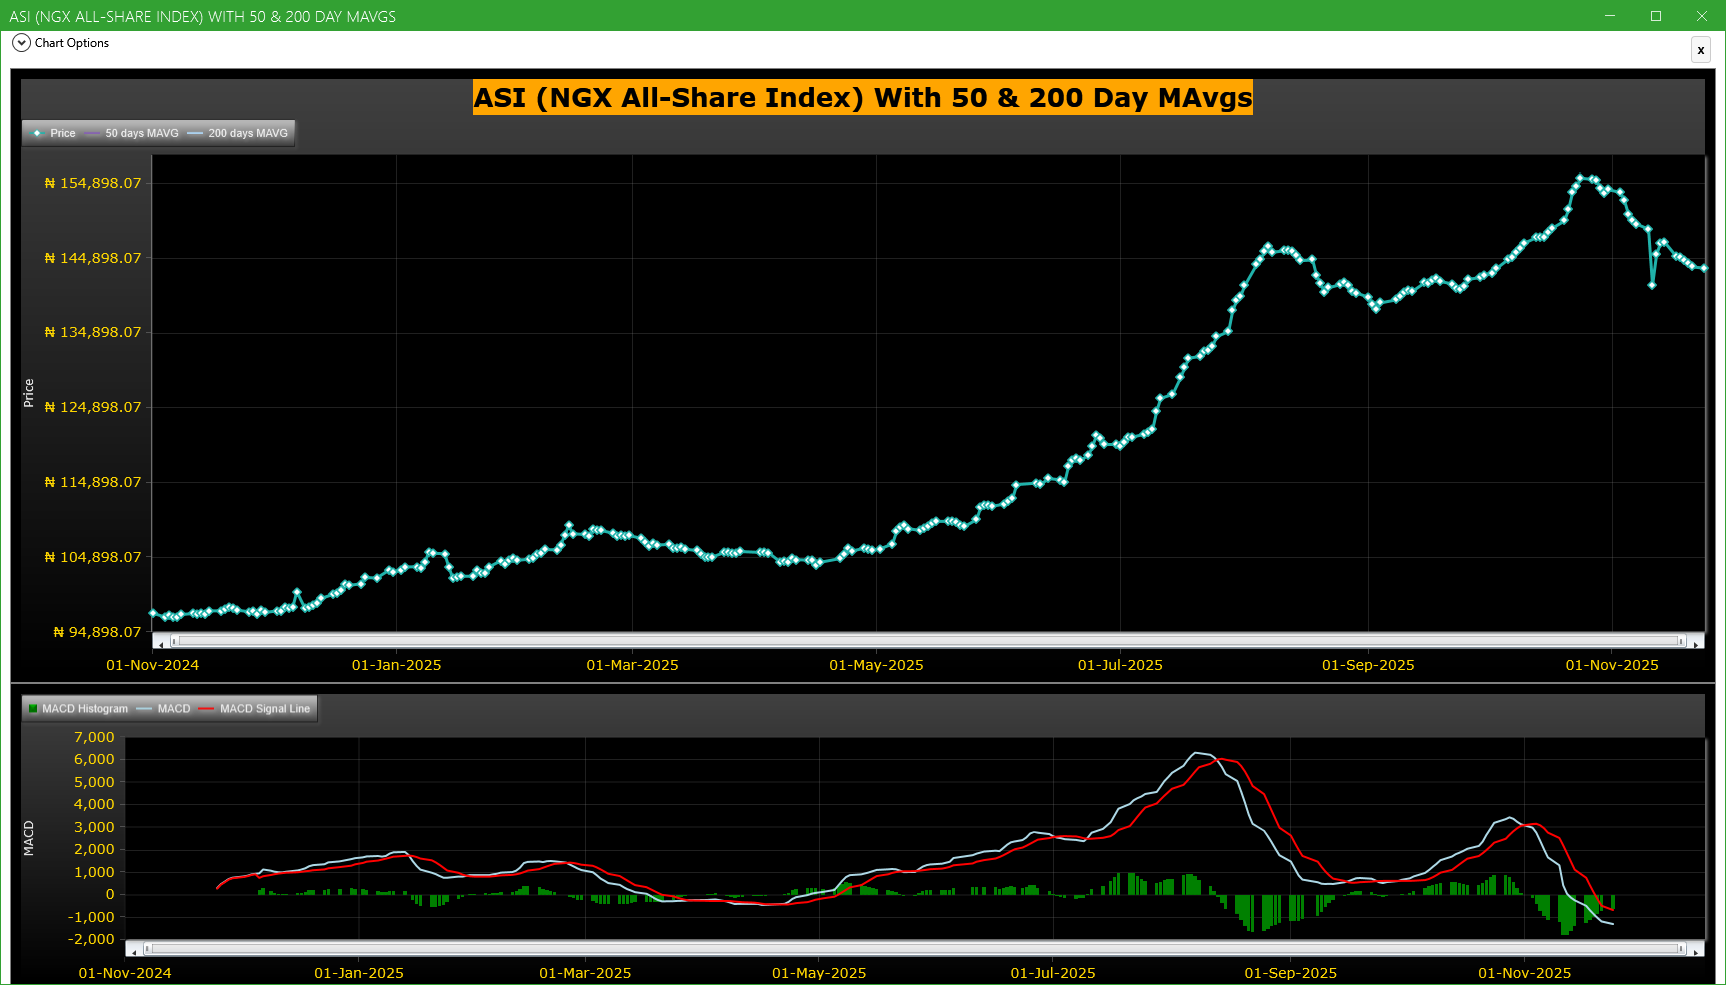
Market Trend - ASI (NGX All-Share-Index) With 50 & 200 Day MAvgs Chart
Technical traders typically use the 50 & 200 day moving averages to aid in choosing
where to enter or exit a position, which then causes these levels to act as strong
support or resistance. As a general guideline, if the price is above a moving average,
the trend is up. If the price is below a moving average, the trend is down.
It is important to note that critics of technical analysis say that moving averages act
as support and resistance because so many traders use these indicators to inform their
trading decisions. Also moving averages tend to work quite well in strong trending conditions
but poorly in choppy or ranging conditions.
Trading Strategies: Crossovers
Crossovers are one of the main moving average strategies. The first type is a price crossover,
which is when the price crosses above or below a moving average to signal a potential change
in trend. Another strategy is to apply two moving averages to a chart: one longer and one
shorter. When the shorter-term MA crosses above the longer-term MA, it is a buy signal, as
it indicates that the trend is shifting up. This is known as a golden cross. Meanwhile, when
the shorter-term MA crosses below the longer-term MA, it is a sell signal, as it indicates that
the trend is shifting down. This is known as a dead/death cross
For more detailed analysis,
- On InfoWARE Market Data Terminal <CI> <GO>
- On InfoWARE Finance Mobile App ( Android , iPhone & iPad and Windows 10) , "Research"
Unusual Volume: Volume traded is more than double the 90 day moving average (All exchanges; ASI & ASem). For more detailed analysis,
- On InfoWARE Market Data Terminal <UV> <GO>
- On InfoWARE Finance Mobile App ( Android , iPhone & iPad and Windows 10)
| Symbol | Name | Volume | 90DAvgVol | %VolChg | Price | LClose | %Chg | Trades | Value |
|---|---|---|---|---|---|---|---|---|---|
| GTCO | GUARANTY TRUST HOLDING COMPANY PLC | 203.85M | 22.20M | 818.25 | 84.80 | 84.50 | 0.36 | 973 | 17.24B |
| FIDELITYBK | FIDELITY BANK PLC | 131.51M | 54.93M | 139.40 | 19.05 | 19.05 | 0.00 | 588 | 2.50B |
| JAPAULGOLD | JAPAUL GOLD & VENTURES PLC | 68.82M | 17.54M | 292.40 | 2.10 | 2.10 | 0.00 | 181 | 145.91M |
| UNILEVER | UNILEVER NIGERIA PLC. | 14.89M | 534.26K | 2,686.84 | 70.00 | 69.00 | 1.45 | 143 | 1.03B |
| NEM | N.E.M INSURANCE CO (NIG) PLC. | 5.37M | 748.61K | 617.22 | 26.00 | 26.00 | 0.00 | 101 | 140.13M |
Investment Insights - High Div. Stocks
Dividend stocks distribute a portion of the company earnings to investors on a regular basis and they can a great choice for investors looking for regular income. As an investment or trading strategy, high dividend yield equities provide annual cash payments as against mostly capital gains in the price of a stock. The list in the table below represent the highest dividend paying stocks from the list of the most liquid stocks in the NSE top 30.
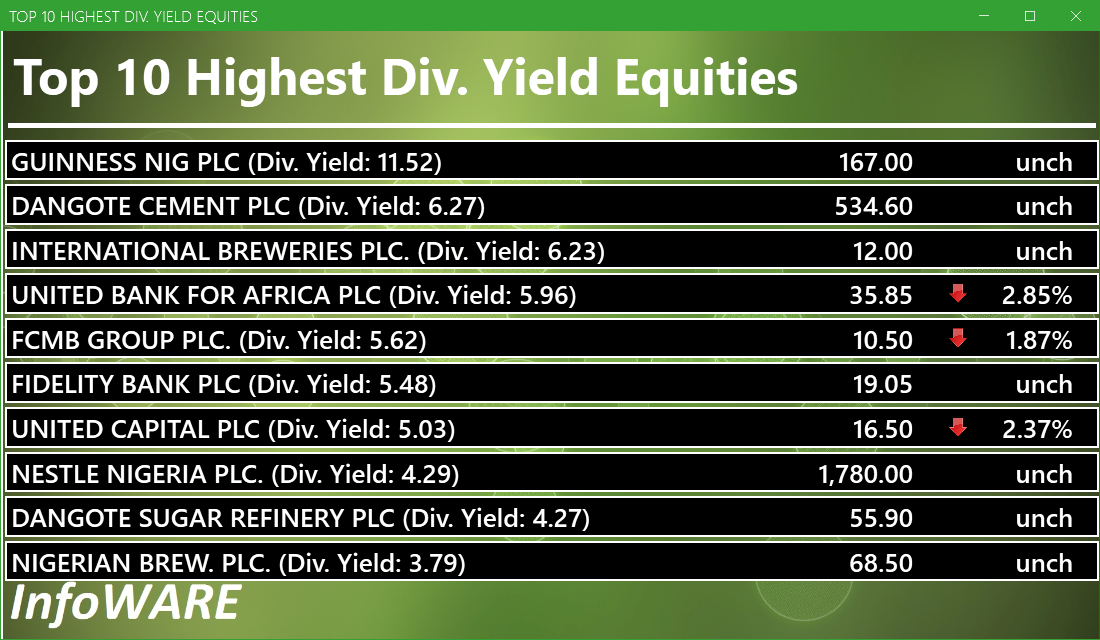
For more detailed analysis,
- On InfoWARE Market Data Terminal <HYIELD> <GO>
- On InfoWARE Finance Mobile App ( Android , iPhone & iPad and Windows 10) , "Research"
Investment Insights - Stocks outperforming the ASI but with approximately the same risk
These list of stocks represent equities that are less risky than the ASI but doing better than the ASI (All Shares Index) using the YTD (Year to Date) returns as the measure. The risk is measured by Beta. Beta is an assessment of a stock's tendency to undergo price changes, (its volatility), as well as its potential returns compared to the ASI. It is expressed as a ratio, where a score of 1 represents performance comparable to the ASI, and returns above or below the market may receive scores greater or lower than 1.
For a full list of both positively and negatively corelated stocks visit InfoWARE Market Data Terminal
- On InfoWARE Market Data Terminal <BANL> <GO>
- On InfoWARE Finance Mobile App ( Android , iPhone & iPad and Windows 10)
| Symbol | DivYield | PE | EPS | Beta | %ChgYTD | ASIYTDReturn | BetaDiff |
|---|---|---|---|---|---|---|---|
| HONYFLOUR | 1.40 | 16.28 | 0.31 | 0.99 | 160.12 | 39.19 | 0.01 |
| CAVERTON | 5.52 | 1.15 | 1.57 | 0.98 | 115.69 | 39.19 | 0.02 |
| ROYALEX | 7.81 | 0.00 | 0.00 | 0.96 | 67.27 | 39.19 | 0.04 |
| CORNERST | 5.28 | 8.62 | 0.35 | 0.93 | 46.46 | 39.19 | 0.07 |
| UNIVINSURE | 0.00 | 0.00 | 0.00 | 0.83 | 61.11 | 39.19 | 0.17 |
| FTNCOCOA | 1.60 | 0.00 | 0.00 | 0.79 | 165.96 | 39.19 | 0.21 |
| NB | 3.79 | 16.95 | 1.60 | 0.79 | 114.06 | 39.19 | 0.21 |
| MAYBAKER | 3.75 | 58.94 | 0.14 | 0.78 | 81.38 | 39.19 | 0.22 |
| UNILEVER | 2.81 | 67.09 | 0.40 | 0.75 | 94.44 | 39.19 | 0.25 |
| VETGOODS | 0.00 | 0.71 | 103.49 | 39.19 | 0.29 |
African Markets
| Name | LClose | Change | %Chg |
|---|---|---|---|
| BRVM Stock Exchange | 344.28 | -0.14 | -0.04 |
| Botswana Stock Exchange | 10,646.68 | 0.00 | 0.00 |
| Egyptian Exchange | 40,445.66 | 145.08 | 0.36 |
| Ghana Stock Exchange | 8,521.02 | 23.79 | 0.28 |
| Johannesburg Stock Exchange | 109,641.30 | -2,260.41 | -2.02 |
| Lusaka Stock Exchange | 25,238.08 | -705.67 | -2.72 |
| Casablanca Stock Exchange | 18,205.28 | 92.38 | 0.51 |
| Malawi Stock Exchange | 635,645.46 | -508.92 | -0.08 |
| Nigeria Stock Exchange | 143,722.62 | -461.39 | -0.32 |
| Nairobi Securities Exchange | 187.91 | -0.36 | -0.19 |
| Namibian Stock Exchange | 1,962.00 | -30.08 | -1.51 |
| Rwanda Stock Exchange | 179.20 | 0.00 | 0.00 |
| Tunis Stock Exchange | 13,262.04 | 68.61 | 0.52 |
| Uganda Securities Exchange | 1,584.74 | 0.63 | 0.04 |
Nigeria Market Indexes
| Symbol | LClose | %Chg | WTD% | MTD% | QTD% | YTD% | MktCap | Trades |
|---|---|---|---|---|---|---|---|---|
| ASI | 143,614.61 | -0.08 | 0.00 | -6.59 | 0.44 | 39.19 | 22,847 | |
| NGX30 | 5,257.48 | -0.07 | 0.00 | -6.75 | 0.76 | 37.82 | 12,926 | |
| NGXAFRBVI | 3,067.08 | -0.31 | 0.00 | -7.57 | -13.59 | 23.63 | 4,882 | |
| NGXAFRHDYI | 20,465.60 | -0.57 | 0.00 | -6.11 | -8.06 | 20.19 | 5,876 | |
| NGXASEM | 1,392.88 | 0.00 | 0.00 | 0.00 | -9.44 | -12.05 | 3 | |
| NGXBNK | 1,368.93 | -0.27 | 0.00 | -6.44 | -9.75 | 25.89 | 5,535 | |
| NGXCG | 3,808.04 | -0.16 | 0.00 | -6.84 | -6.00 | 34.60 | 12,175 | |
| NGXCNSMRGDS | 3,444.58 | -0.02 | 0.00 | -3.01 | 1.83 | 98.61 | 2,885 | |
| NGXCOMMDTY | 1,182.74 | 0.00 | 0.00 | -2.07 | 5.43 | 18.27 | ||
| NGXGROWTH | 14,068.77 | 0.36 | 0.00 | -9.28 | -6.66 | 81.23 | 328 | |
| NGXINDUSTR | 5,234.06 | 0.00 | 0.00 | -12.12 | 3.28 | 46.55 | 1,908 | |
| NGXINS | 1,074.85 | -0.79 | 0.00 | -11.39 | -10.14 | 36.72 | 1,399 | |
| NGXLOTUSISLM | 12,735.92 | 0.00 | 0.00 | -6.43 | 7.28 | 82.78 | 4,261 | |
| NGXMAINBOARD | 7,040.76 | -0.05 | 0.00 | -3.93 | -0.06 | 40.70 | 16,254 | |
| NGXMERIGRW | 9,917.21 | -0.38 | 0.00 | -3.90 | 0.14 | 52.03 | 3,408 | |
| NGXMERIVAL | 12,173.23 | -0.45 | 0.00 | -6.58 | -8.94 | 16.71 | 6,625 | |
| NGXOILGAS | 2,705.44 | 0.00 | 0.00 | -3.31 | 7.10 | -0.21 | 274 | |
| NGXPENBRD | 2,693.28 | -0.08 | 0.00 | -6.21 | 1.59 | 47.04 | 18,971 | |
| NGXPENSION | 6,575.14 | -0.18 | 0.00 | -5.45 | -2.41 | 45.02 | 14,516 | |
| NGXPREMIUM | 13,991.20 | -0.13 | 0.00 | -10.94 | 2.19 | 43.75 | 6,265 | |
| NGXSOVBND | 645.96 | -3.77 | 0.00 | -3.36 | -1.72 | 7.38 | 2 |
For more detailed analysis,
- On InfoWARE Market Data Terminal <MKTINS> <GO>
- On InfoWARE Finance Mobile App ( Android, iPhone & iPad and Windows 10) , "Market Indexes"
Find the topic interesting? Will like to comment? Contact Us at solutions@infowarelimited.com
Top News

Chart Of The Day - ASI Chart Vs ASI Advance Decline Line (YTD) (24-Nov-2025 15:11:54.845)
InfoWARE AI Analyst Daily Market Report: 24-Nov-2025

[XNSA]>> CORDROS MILESTONE FUNDS' BID & OFFER PRICES
[VSPBONDETF]>> DAILY INDICATIVE PRICES
[VSPBONDETF]>> DAILY INDICATIVE PRICES
[XNSA]>> EMERGING AFRICA DAILY MUTUAL FUND PRICES
[XNSA]>> H2 2025 BC/DR TEST
[XNSA]>> LISTING OF 2025, Q3 SCRIP UNIT OF 243,424 UNITS OF NIDF
[XNSA]>> AELP CAPACITY BUILDING & ASSDA FORUM
[XNSA]>>GO-LIVE NOTIFICATION: TRANSITION TO T+2 SETTLEMENT CYCLE
InfoWARE AI Analyst Weekly Market Report: 21-Nov-2025
Chart Of The Day - ASI Chart Vs ASI Advance Decline Line (YTD) (21-Nov-2025 15:07:14.650)
InfoWARE AI Analyst Daily Market Report: 21-Nov-2025
[VETINDETF]>> DAILY INDICATIVE PRICES
[XNSA]>> NORRENBERGER MUTUAL FUNDS WEEKLY UPDATE TO NGX
[XNSA]>> H2 2025 BC/DR TEST
[XNSA]>> CORDROS MILESTONE FUNDS' BID & OFFER PRICES
[XNSA]>> NGX FIXED INCOME INDICATIVE PRICE LIST FOR NOV 21, 2025
[STANBICETF30]>> DAILY INDICATIVE PRICES
[XNSA]>> AELP CAPACITY BUILDING & ASSDA FORUM
[XNSA]>>GO-LIVE NOTIFICATION: TRANSITION TO T+2 SETTLEMENT CYCLE
[XNSA]>> NOTIFICATION OF PRICE ADJUSTMENT
Chart Of The Day - ASI Chart Vs ASI Advance Decline Line (YTD) (20-Nov-2025 15:11:12.969)
InfoWARE AI Analyst Daily Market Report: 20-Nov-2025
[MERGROWTH]>> DAILY INDICATIVE PRICES
[VETBANK]>> DAILY INDICATIVE PRICES
[XNSA]>> NGX FIXED INCOME INDICATIVE PRICE LIST FOR NOV 20, 2025
[LOTUSHAL15]>> DAILY INDICATIVE PRICES
[XNSA]>> H2 2025 BC/DR TEST
[XNSA]>> CORDROS MILESTONE FUNDS' BID & OFFER PRICES
Get IDIA - the stock trading app for the modern investor
Solutions by Business
Product Suites
Company
Contacts
- 8th Floor,
- South Atlantic Petroleum Towers,
- 1 Adeola Odeku Street,
- Victoria Island,
- Lagos, Nigeria.
- Email: solutions@infowarelimited.com
Follow Us
 |
 |
 |
 |