


InfoWARE AI Analyst Daily Market Report: 23-Dec-2025 | InfoWARE Finance
Get IDIA - the stock trading app for the modern investor


InfoWARE AI Analyst Daily Market Report: 23-Dec-2025
(Source: InfoWARE Terminal, Date: 23-Dec-2025)
Dear Investor,
Daily NGX Market Summary • Tuesday, December 23, 2025
Market Wrap
The NGX All Share Index rallied today, gaining 0.59% to close at 152,459.07, sustaining robust YTD returns of 48.63%. Turnover soared by 110.6% to ₦20.78B, and volumes jumped to 677.4M shares, spotlighting major institutional trades amid a moderate market breadth of 0.94x (31 advancers vs. 33 decliners). The session was driven by powerful momentum in industrials and selected financials, but was offset by sell-offs in ETFs and a few high-flying names confronting profit-taking. Notably, momentum signals and unusual volume spikes suggest tactical, short-term opportunities—but with caution as overbought symptoms bubble up for some leaders.
Key Market Trends
- Turnover & Volume Boom: Massive surge in both turnover (+110.6%) and volume (up 65%+ over prior session) signals heavy institutional participation and active rotation, especially in large-cap banks and industrials.
- Advancers vs. Decliners: Breadth is neutral to mildly negative (31 vs. 33); though headline index is up, leadership is narrowing and rotation into select momentum plays is evident.
- Market Breadth Divergence: Advancers led by ALEX (+9.96%) and CUSTODIAN (+9.69%), while decliners like NEWGOLD ETF (-10.8%) and MERGROWTH (-9.98%) reflect heightened ETF volatility.
- Unusual Volume Spike: VFDGROUP drew 4657% above its typical volume—potential accumulation, block trades, or entry of a new institutional player.
- RSI/Momentum Overheating: Several top gainers (notably ALEX RSI 99.6 and FIRSTHOLDCO RSI 94.1) demonstrate extreme overbought conditions.
- Bullish Crossovers: Notable names crossed above 15DMA: CUSTODIAN and FTNCOCOA—both with strong price surges and positive technicals.
- Bearish Crosses: Select key stocks are breaking below 15DMA—caution warranted especially for ETF heavyweights and ZENITHBANK.
YTD Leaders & Laggards (Top 5)
| Symbol | Name | Price | %ChgYTD | 5-Day % | RSI |
|---|---|---|---|---|---|
| ALEX | ALUMINIUM EXTRUSION IND. PLC. | 13.55 | 108.39% | 32.44% | 99.6 |
| AUSTINLAZ | AUSTIN LAZ & COMPANY PLC | 2.65 | 60.77% | 32.27% | 62.2 |
| INTENEGINS | INTERNATIONAL ENERGY INSURANCE | 2.49 | 44.39% | 18.94% | 52.17 |
| MECURE | MECURE INDUSTRIES PLC | 60.30 | 369.06% | 18.55% | 98.5 |
| FIRSTHOLDCO | FIRST HOLDCO PLC | 46.00 | 78.37% | 17.94% | 94.1 |
| Symbol | Name | Price | %ChgYTD | 5-Day % | RSI |
|---|---|---|---|---|---|
| STANBICETF30 | STANBIC IBTC ETF 30 | 900.00 | -29.70% | -12.02% | 44.7 |
| MERGROWTH | MERISTEM GROWTH ETF | 581.00 | 21.63% | -11.55% | 53.9 |
| LINKASSURE | LINKAGE ASSURANCE PLC | 1.60 | 24.81% | -10.56% | 41.2 |
| SOVRENINS | SOVEREIGN TRUST INSURANCE | 3.98 | 206.5% | -9.81% | 63.3 |
| MERVALUE | MERISTEM VALUE ETF | 353.00 | 45.87% | -9.79% | 55.2 |
Noteworthy Gainers & Losers Today
- ALUMINIUM EXTRUSION IND. (ALEX): +9.96%, RSI 99.6—Outperformance continues, but RSI flags severe overbought and risk of short-term pullback.
- AUSTIN LAZ (AUSTINLAZ): +9.81%, RSI 62.2—Significant breakout with volume 10X normal. Fresh momentum; but watch volatility.
- FIRSTHOLDCO: +9.35%, RSI 94.1—Sustained, parabolic rally; deeply overbought. Both retail and institutional investors active.
- NEWGOLD ETF: -10.82%, RSI 55.8—Sharp correction, possible rebalancing or institutional sell-side flow. Technicals neutral; may stabilize soon.
- GREENWETF: -6.67%—Breakdown below 15DMA; watch for continued bearishness if market volatility persists.
- ROYAL EXCHANGE (ROYALEX): -7.21%, crossed below 15DMA—Downtrend with negative volume momentum, despite a dividend yield of 7.81%. Potential dividend trap if weak price persists.
Volume & Momentum Standouts
-
Unusual Volume:
- VFDGROUP: Volume at 4,657% above 90-day average—potential stealth accumulation or major block activity.
- NSLTECH & CHAMS: Significant spikes (+607% and +181%, respectively), warranting short-term attention for traders.
- AUSTINLAZ: Also with 10X volume on a high-momentum day—surfacing as a tactical opportunity.
- Bullish Crosses: CUSTODIAN (+8.8%, crossed 15DMA), FTNCOCOA (+8.0%, 15DMA cross), LIVINGTRUST (+8.0%); healthy breadth among non-banking mid-caps.
- Bearish Crosses: ZENITHBANK and ETFs (NEWGOLD, GREENWETF) dipped below 15DMA—potential trend exhaustion or sector rotation.
- Overlaps: ALEX and FIRSTHOLDCO are YTD leaders, top 5 gainers today, and signal extreme technical momentum. Careful for late entries.
Contrarian Signals
- FIRSTHOLDCO: Massive gain, RSI at 94+, strong institutional and retail activity—but such extreme RSI and parabolic runups rarely last; potential for a "buy the rumor, sell the news” event.
- CUSTODIAN: Price just crossed above 15DMA with modest RSI (35.2) and negative MACD—momentum may be stalling, not yet a runaway trend.
- ZENITHBANK: High institutional turnover (see below), but broke below 15DMA and mildly negative momentum. Indicates some fund rotation or hedging despite index strength.
- ROYALEX: High dividend (7.81%) but under price pressure, below 15DMA—a classic "dividend trap” risk if trend doesn’t reverse.
- CHAMS: Spiking volume (+181%) on a modestly positive day, potentially indicating late-comer buying or speculative froth.
Sector Heatmap
| Sector | Leaders | Change | Technical/Breadth | Comment |
|---|---|---|---|---|
| Industrial | ALEX (+9.96%) | ▲ Up | RSI 99.6, Bullish Price Cross | Momentum extremes, leader of today's move |
| Diversified | CUSTODIAN (+9.7%) | ▲ Up | 15DMA Breakout, RSI in mid-range | Early momentum play, further potential if volume builds |
| ETF | NEWGOLD (-10.8%) GREENWETF (-6.7%) |
▼ Down | Below 15DMA, high volatility | Sector-wide ETF correction or rotation |
| Banking | FIRSTHOLDCO (+9.4%) ZENITHBANK (-0.8%) |
Mixed | Momentum divergence | Rotation within sector, profit taking on prior outperformers |
| Crop Processing | FTNCOCOA (+8.7%) | ▲ Up | 15DMA Crossover | Emerging interest after consolidation |
| Other Fin. Inst. | ROYALEX (-7.2%) | ▼ Down | Below DMA, high div. yield | Possible dividend trap; watch reversal or further slide |
Dividend-Beta Matrix: Defensive Stock Scouting
| Symbol | Div. Yield | Beta | YTD Chg. | Momentum Signal | Comment |
|---|---|---|---|---|---|
| ROYALEX | 7.81% | 0.96 | -7.2% (day) | Bearish cross | High yield, high risk of further downside ("yield trap") |
| CUSTODIAN | 1.20% | 0.54 | +9.69% (day) | Bullish cross | Decent yield, low beta, turning bullish |
| ZENITHBANK | 2.25% | 1.20 | -0.8% | Bearish cross | Defensive dividend, but price trend worsening |
| LIVINGTRUST | 1.67% | 0.00 | +8.7% | Bullish cross | Low risk, improving momentum |
- Comment: Only CUSTODIAN and LIVINGTRUST currently offer a blend of positive price trend, dividend support and relatively low beta, qualifying as "defensive momentum" picks. ROYALEX shows high yield, but beware the classic dividend trap scenario.
Institutional Clustering Alerts
- ZENITHBANK: 20.17% institutional trade value share (₦1.24B out of ₦6.13B across top 5), with majority sell-side—signaling likely fund rotation. Shares break below 15DMA—watch for short-term downside moves.
- FIRSTHOLDCO: Heavy institution buying (₦1.32B, 12.4% of major volume), with extreme momentum. Both retail and fund managers are piling in, but froth can turn to profit-taking swiftly.
- ARADEL: Quiet accumulation (₦815M) with small price move—possible stealth institutional buildup.
Market Activity & Trade Analytics
- Institutional vs Retail:
- Institutionals: 33.6% of trade count, but dominate with 76.2% of volume and 87.5% of trade value; impact concentrated in select high-value names.
- Retails: 66.4% of trade count, but just 23.8% of volume and 12.5% of value.
- Top 5 Institutional Buys: FIRSTHOLDCO (₦1.32B), ACCESSCORP, MTNN, ZENITHBANK, ARADEL. All heavyweights, all actively traded and feature in bullish/bearish DMA lists.
- Top 5 Retail Trades: MTNN, GTCO, ACCESSCORP, ZENITHBANK, FIRSTHOLDCO—same names as institutions, but with smaller lot sizes. Retail crowd is chasing momentum trades, especially in big banks and telcos.
- Hidden Insight: When both institutional and retail flows converge on same symbols (e.g., FIRSTHOLDCO, ZENITHBANK), moves tend to be more extended—but also more at risk for "air-pocket” corrections when trend exhausts. Caution: Overlapping interest is bullish... until the exit rush begins.
Actionable Insights & Trading Suggestions
- Momentum Opportunities: ALEX, FIRSTHOLDCO, MECURE—but tight stop-losses are crucial due to RSI extremes and potential for sharp reversals.
- Detecting Reversals: ETFs (NEWGOLD, GREENWETF) and ROYALEX are under selling pressure and show bearish technicals; short-term traders may seek quick rebounds, but avoid overstaying weak hands.
- Monitor Unusual Volumes: Watch VFDGROUP, CHAMS, NSLTECH for breakout follow-through or, if exhausted, for abrupt reversals; volume spikes can precede trend exhaustion as well as new rallies.
- Defensive Play: CUSTODIAN and LIVINGTRUST combine decent yields, low beta, and positive momentum—suitable for cautious accumulation.
- Avoid Yield Traps: ROYALEX sports high dividends but a negative trend—wait for technical confirmation of reversal before entry.
- ETF Watch: Further weakness in liquidity-heavy ETFs could spill over into broad market mood. Caution on high-beta plays if selloff accelerates.
- For Swing Traders: Trailing stop strategies advised on overbought leaders; volume/price climaxes historically precede mean-reversion pullbacks.
|
Top ASI Gainers Over Last 5 Trading Days
|
Top ASI Losers Over Last 5 Trading Days
|
For more detailed analysis, on InfoWARE Market Data Terminal <NSEPERF> <GO>
On InfoWARE Finance Mobile App (Android, iPhone & iPad, Windows Phone and Windows 8/10), "Top Gainers & Losers"
ALUMINIUM EXTRUSION IND. PLC. (ALEX) topped the advancers list closing at N14.90 with a gain of 9.96% followed by AUSTIN LAZ & COMPANY PLC (AUSTINLAZ) which closed at N2.91 with a gain of 9.81%.
On the flip side NEWGOLD EXCHANGE TRADED FUND (ETF) (NEWGOLD) and STANBIC IBTC ETF 30 (STANBICETF30) topped the decliners log with a loss of -10.82% at a close of N53,507.00, and -10.00% to close the day at N810.00 respectively.
| Symbol | LClose | %Chg |
|---|---|---|
| ALEX | 14.90 | 9.96 |
| AUSTINLAZ | 2.91 | 9.81 |
| CUSTODIAN | 38.50 | 9.69 |
| FIRSTHOLDCO | 50.30 | 9.35 |
| FTNCOCOA | 5.10 | 8.74 |
| Symbol | LClose | %Chg |
|---|---|---|
| NEWGOLD | 53,507.00 | -10.82 |
| STANBICETF30 | 810.00 | -10.00 |
| MERGROWTH | 523.00 | -9.98 |
| ROYALEX | 1.80 | -7.22 |
| GREENWETF | 350.00 | -6.67 |
For more detailed analysis,
- On InfoWARE Market Data Terminal <TOPG> <GO>
- On InfoWARE Finance Mobile App ( Android, iPhone & iPad and Windows 10) , "Top Gainers & Losers"
Currency Market
In the currency market, the Naira was unchanged against the dollar at 1 to 1NSE: Bull Signal - Price crossed above 15 Day MA
This signal implies these stocks are under buying pressure and the price might continue to rise and therefore positions should be monitored closely. Further suggested analysis include looking at the overall market (ASI) to see if the uptrend is market wide, sector wide or specific to the stock. Portfolio managers tend to use this as a signal to do more research to add to their positions or lock in some profits. Typically further analysis should be done using commands like PC and RV on the InfoWARE Market Data Terminal. Another command is ALERTS to set price triggers for possible exit or entry as necessary
For more detailed analysis,
- On InfoWARE Market Data Terminal <NSEPERF> <GO>
- On InfoWARE Finance Mobile App ( Android , iPhone & iPad and Windows 10) , "Top Gainers & Losers"
| Symbol | Price | %Chg | 15DMA | PE | EPS | DivY | MktCap | Vol | Trades | Value | LstTradeTime |
|---|---|---|---|---|---|---|---|---|---|---|---|
| CUSTODIAN | 38.50 | 8.83 | 38.00 | 3.80 | 3.29 | 1.20 | 226.45B | 223.72K | 99.00 | 8.60M | 23-Dec-2025 14:41:10.037 |
| FTNCOCOA | 5.10 | 8.04 | 4.77 | 0.00 | 0.00 | 1.60 | 19.89B | 2.62M | 168.00 | 13.05M | 23-Dec-2025 14:41:10.413 |
| LIVINGTRUST | 3.74 | 8.02 | 3.58 | 35.78 | 0.02 | 1.67 | 18.70B | 2.31M | 28.00 | 8.18M | 23-Dec-2025 14:41:09.130 |
| NGXMERIVAL | 12,827.78 | 0.25 | 12,824.52 | 12.13 | 38.38 | 0.00 | 0.00 | 87.93M | 5,841.00 | 3.62B | 23-Dec-2025 14:41:15.270 |
NSE: BEAR Signal - Price crossed below 15 Day MA
This signal implies these stocks are under selling pressure and the price might continue to slide and therefore positions should be monitored closely. Further suggested analysis include looking at the overall market (ASI) to see if the downtrend is market wide, sector wide or specific to the stock. If the overal market trend is upwards, then since these stocks are heading in the opposite direction, then further analysis should be done using commands like PC and RV on the InfoWARE Market Data Terminal. Another command is ALERTS to set price triggers for possible exit is necessar
For more detailed analysis,
- On InfoWARE Market Data Terminal <BEARM> <GO>
- On InfoWARE Finance Mobile App ( Android , iPhone & iPad and Windows 10)
| Symbol | Price | %Chg | 15DMA | PE | EPS | DivY | MktCap | Vol | Trades | Value | LstTradeTime |
|---|---|---|---|---|---|---|---|---|---|---|---|
| ZENITHBANK | 62.50 | -0.80 | 63.10 | 3.33 | 13.30 | 2.25 | 1,962.28B | 19.91M | 1,434.00 | 1.24B | 23-Dec-2025 14:41:08.843 |
| VETBANK | 14.00 | -1.43 | 14.13 | 0.00 | 0.00 | 28.39K | 23.00 | 443.26K | 23-Dec-2025 14:41:09.293 | ||
| DAARCOMM | 0.90 | -4.44 | 0.93 | 0.00 | 0.00 | 0.00 | 10.80B | 625.30K | 68.00 | 568.85K | 23-Dec-2025 14:41:09.833 |
| GREENWETF | 350.00 | -7.14 | 353.20 | 0.00 | 0.00 | 47.00 | 5.00 | 16.96K | 23-Dec-2025 14:41:09.280 | ||
| ROYALEX | 1.80 | -7.78 | 1.87 | 0.00 | 0.00 | 7.81 | 9.26B | 2.07M | 113.00 | 3.87M | 23-Dec-2025 14:41:09.457 |
| NEWGOLD | 53,507.00 | -12.13 | 56,041.13 | 0.00 | 0.00 | 0.00 | 0.00 | 6.00 | 2.00 | 331.51K | 23-Dec-2025 14:41:09.260 |
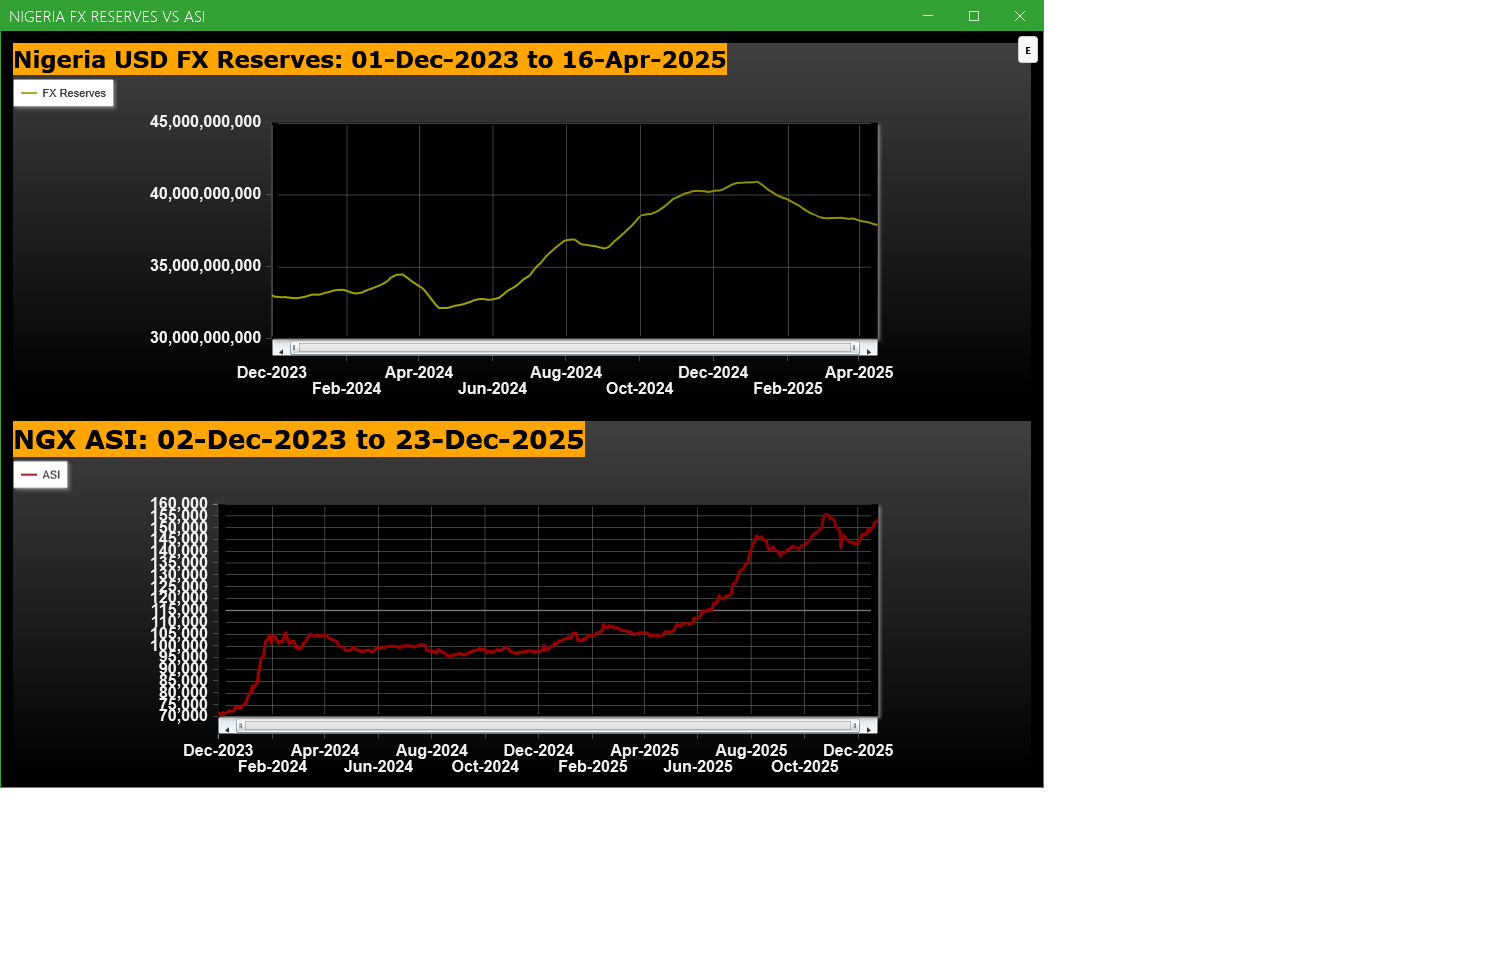
Economic Indicators - Nigeria FX Reserves Vs ASI Chart
Nigeria FX Reserves are assets held on reserve by CBN in foreign currencies. These reserves are used to back liabilities and influence monetary policy. Given the nature of the Nigeria economy, FX Reserves can appear to have an outsize influence on the economy and hence on the capital market. The chart below allows comparison of FX Reserves against the ASI to make investment decisions
For more detailed analysis,
- On InfoWARE Market Data Terminal <CI> <GO>
- On InfoWARE Finance Mobile App ( Android , iPhone & iPad and Windows 10) , "Research"
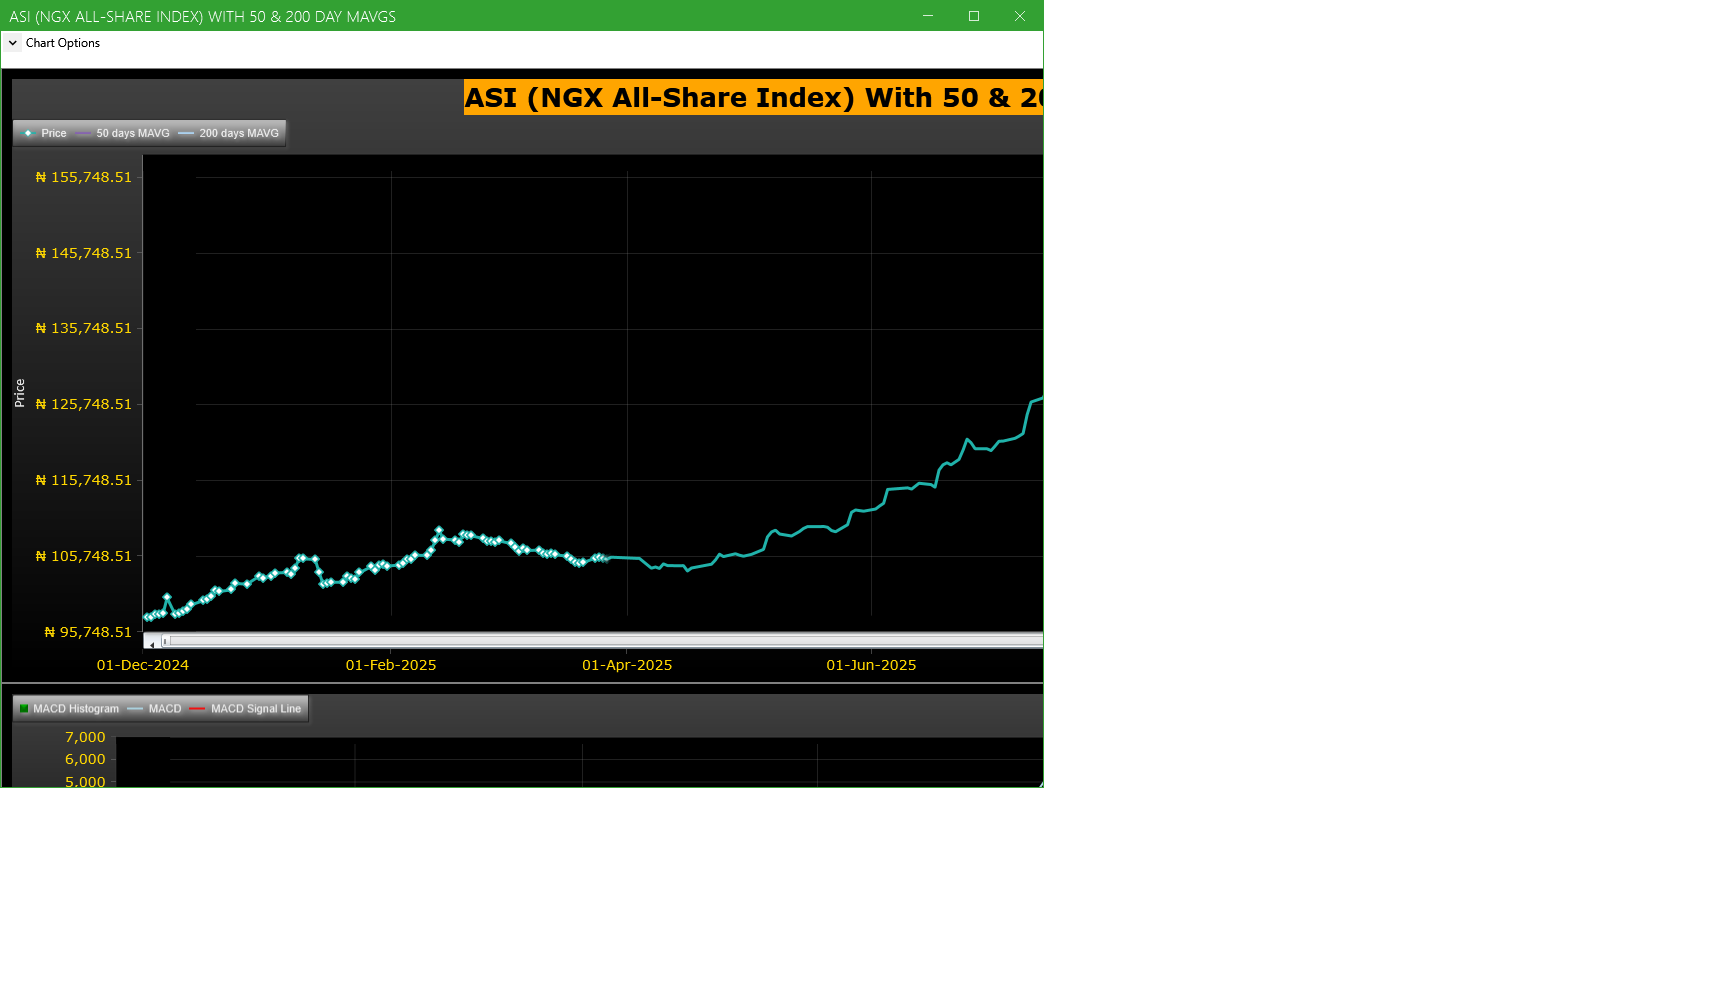
Market Trend - ASI (NGX All-Share-Index) With 50 & 200 Day MAvgs Chart
Technical traders typically use the 50 & 200 day moving averages to aid in choosing
where to enter or exit a position, which then causes these levels to act as strong
support or resistance. As a general guideline, if the price is above a moving average,
the trend is up. If the price is below a moving average, the trend is down.
It is important to note that critics of technical analysis say that moving averages act
as support and resistance because so many traders use these indicators to inform their
trading decisions. Also moving averages tend to work quite well in strong trending conditions
but poorly in choppy or ranging conditions.
Trading Strategies: Crossovers
Crossovers are one of the main moving average strategies. The first type is a price crossover,
which is when the price crosses above or below a moving average to signal a potential change
in trend. Another strategy is to apply two moving averages to a chart: one longer and one
shorter. When the shorter-term MA crosses above the longer-term MA, it is a buy signal, as
it indicates that the trend is shifting up. This is known as a golden cross. Meanwhile, when
the shorter-term MA crosses below the longer-term MA, it is a sell signal, as it indicates that
the trend is shifting down. This is known as a dead/death cross
For more detailed analysis,
- On InfoWARE Market Data Terminal <CI> <GO>
- On InfoWARE Finance Mobile App ( Android , iPhone & iPad and Windows 10) , "Research"
Unusual Volume: Volume traded is more than double the 90 day moving average (All exchanges; ASI & ASem). For more detailed analysis,
- On InfoWARE Market Data Terminal <UV> <GO>
- On InfoWARE Finance Mobile App ( Android , iPhone & iPad and Windows 10)
| Symbol | Name | Volume | 90DAvgVol | %VolChg | Price | LClose | %Chg | Trades | Value |
|---|---|---|---|---|---|---|---|---|---|
| VFDGROUP | VFD GROUP PLC | 191.97M | 4.04M | 4,657.42 | 10.85 | 10.60 | 2.36 | 164 | 2.07B |
| GTCO | GUARANTY TRUST HOLDING COMPANY PLC | 63.45M | 26.25M | 141.73 | 88.00 | 88.10 | -0.11 | 1,387 | 5.59B |
| NSLTECH | SECURE ELECTRONIC TECHNOLOGY PLC | 39.33M | 5.56M | 607.39 | 0.75 | 0.78 | -3.85 | 206 | 28.35M |
| CHAMS | CHAMS PLC | 39.25M | 13.94M | 181.51 | 3.55 | 3.51 | 1.14 | 480 | 131.82M |
| AUSTINLAZ | AUSTIN LAZ & COMPANY PLC | 3.79M | 335.97K | 1,026.91 | 2.91 | 2.65 | 9.81 | 93 | 10.98M |
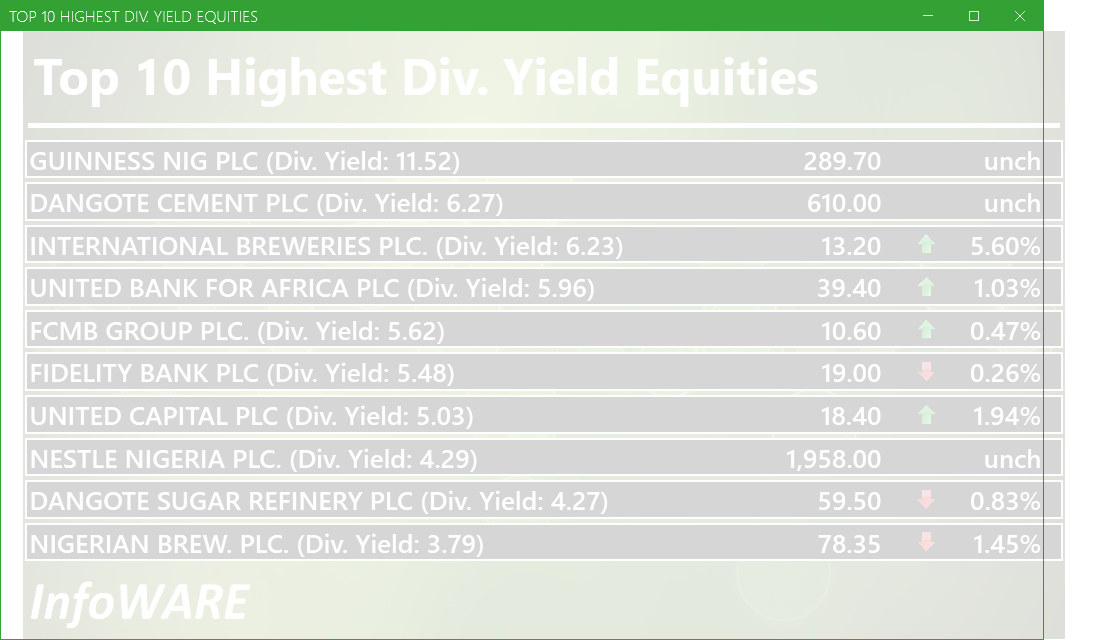
Investment Insights - High Div. Stocks
Dividend stocks distribute a portion of the company earnings to investors on a regular basis and they can a great choice for investors looking for regular income. As an investment or trading strategy, high dividend yield equities provide annual cash payments as against mostly capital gains in the price of a stock. The list in the table below represent the highest dividend paying stocks from the list of the most liquid stocks in the NSE top 30.
For more detailed analysis,
- On InfoWARE Market Data Terminal <HYIELD> <GO>
- On InfoWARE Finance Mobile App ( Android , iPhone & iPad and Windows 10) , "Research"
African Markets
| Name | LClose | Change | %Chg |
|---|---|---|---|
| BRVM Stock Exchange | 340.78 | -3.06 | -0.89 |
| Botswana Stock Exchange | 10,963.74 | 2.19 | 0.02 |
| Egyptian Exchange | 41,102.76 | -243.95 | -0.59 |
| Ghana Stock Exchange | 8,759.11 | 3.50 | 0.04 |
| Johannesburg Stock Exchange | 115,909.60 | 1,056.65 | 0.92 |
| Lusaka Stock Exchange | 25,505.22 | 83.89 | 0.33 |
| Casablanca Stock Exchange | 18,941.74 | 3.79 | 0.02 |
| Malawi Stock Exchange | 606,515.03 | -1,398.20 | -0.23 |
| Nigeria Stock Exchange | 152,459.07 | 395.37 | 0.26 |
| Nairobi Securities Exchange | 184.78 | 0.22 | 0.12 |
| Namibian Stock Exchange | 2,074.47 | -19.90 | -0.95 |
| Rwanda Stock Exchange | 181.75 | 0.00 | 0.00 |
| Uganda Securities Exchange | 1,621.24 | 53.16 | 3.39 |
Nigeria Market Indexes
| Symbol | LClose | %Chg | WTD% | MTD% | QTD% | YTD% | MktCap | Trades |
|---|---|---|---|---|---|---|---|---|
| ASI | 153,354.11 | 0.59 | 0.59 | 7.08 | 7.26 | 48.63 | 27,455 | |
| NGX30 | 5,594.43 | 0.60 | 0.60 | 6.82 | 7.21 | 46.65 | 16,326 | |
| NGXAFRBVI | 3,168.40 | -0.01 | -0.01 | 1.76 | -10.74 | 27.72 | 5,495 | |
| NGXAFRHDYI | 21,118.99 | 0.31 | 0.31 | 1.63 | -5.13 | 24.03 | 6,524 | |
| NGXASEM | 1,392.88 | 0.00 | 0.00 | 0.00 | -9.44 | -12.05 | 1 | |
| NGXBNK | 1,480.91 | 1.23 | 1.23 | 7.05 | -2.36 | 36.19 | 8,008 | |
| NGXCG | 4,193.84 | 0.88 | 0.88 | 9.25 | 3.53 | 48.23 | 14,201 | |
| NGXCNSMRGDS | 3,794.52 | 1.30 | 1.30 | 12.05 | 12.17 | 118.79 | 3,419 | |
| NGXCOMMDTY | 1,178.57 | 0.00 | 0.00 | -0.25 | 5.06 | 17.85 | 1,892 | |
| NGXGROWTH | 27,813.93 | 7.42 | 7.42 | 88.13 | 84.54 | 258.29 | 579 | |
| NGXINDUSTR | 5,627.49 | 0.21 | 0.21 | 9.70 | 11.04 | 57.56 | 2,619 | |
| NGXINS | 1,163.08 | -0.13 | -0.13 | 7.32 | -2.76 | 47.94 | 1,333 | |
| NGXLOTUSISLM | 13,482.03 | 0.30 | 0.30 | 5.65 | 13.57 | 93.49 | 5,971 | |
| NGXMAINBOARD | 7,305.78 | 0.54 | 0.54 | 4.59 | 3.71 | 46.00 | 18,381 | |
| NGXMERIGRW | 9,994.69 | -0.17 | -0.17 | 0.31 | 0.92 | 53.22 | 3,444 | |
| NGXMERIVAL | 12,827.78 | 0.25 | 0.25 | 4.16 | -4.04 | 22.98 | 5,841 | |
| NGXOILGAS | 2,675.53 | -0.02 | -0.02 | -0.77 | 5.92 | -1.31 | 1,615 | |
| NGXPENBRD | 2,877.80 | 0.48 | 0.48 | 6.81 | 8.55 | 57.12 | 22,545 | |
| NGXPENSION | 7,038.25 | 0.57 | 0.57 | 6.30 | 4.46 | 55.23 | 17,263 | |
| NGXPREMIUM | 15,707.08 | 0.61 | 0.61 | 11.51 | 14.72 | 61.38 | 8,091 | |
| NGXSOVBND | 680.95 | 0.00 | 0.00 | 1.11 | 3.60 | 13.20 | 0 |
For more detailed analysis,
- On InfoWARE Market Data Terminal <MKTINS> <GO>
- On InfoWARE Finance Mobile App ( Android, iPhone & iPad and Windows 10) , "Market Indexes"
Find the topic interesting? Will like to comment? Contact Us at solutions@infowarelimited.com
Top News

Chart Of The Day - ASI Chart Vs ASI Advance Decline Line (YTD) (23-Dec-2025 15:15:36.087)
InfoWARE AI Analyst Daily Market Report: 23-Dec-2025

[XNSA]>> FIDSON HEALTHCARE PLC: ACTIVATION OF CODE FOR TRADING IN RIGHTS
[XNSA]>> SUPPLEMENTARY LISTING
[XNSA]>> FIDSON HEALTHCARE PLC: ACTIVATION OF CODE FOR TRADING IN RIGHTS
[VSPBONDETF]>> DAILY INDICATIVE PRICES
[XNSA]>> EARLY MARKET CLOSURE ON 24TH AND 31ST DECEMBER 2025
[LOTUSHAL15]>> DAILY INDICATIVE PRICES
[XNSA]>> CORDROS MILESTONE FUNDS' BID & OFFER PRICES
[XNSA]>> INTRODUCTION OF COMMERCIAL PAPER LISTING AND TRADING ON NGX
[STANBICETF30]>> DAILY INDICATIVE PRICES
[XNSA]>> EXTENSION FOR TRADING IN RIGHTS ISSUE
[XNSA]>> CHAMPION BREWERIES PLC: ACTIVATION OF CODE FOR TRADING IN RIGHTS
Chart Of The Day - ASI Chart Vs ASI Advance Decline Line (YTD) (22-Dec-2025 15:07:31.005)
InfoWARE AI Analyst Daily Market Report: 22-Dec-2025
[XNSA]>> DAILY FUND PRICE SUBMISSION - FCMB ASSET MANAGEMENT LIMITED
[XNSA]>> CORDROS MILESTONE FUNDS' BID & OFFER PRICES
[VSPBONDETF]>> DAILY INDICATIVE PRICES
[XNSA]>> INTRODUCTION OF COMMERCIAL PAPER LISTING AND TRADING ON NGX
[SIAMLETF40]>> DAILY INDICATIVE PRICES
[XNSA]>> EXTENSION FOR TRADING IN RIGHTS ISSUE
[XNSA]>> CHAMPION BREWERIES PLC: ACTIVATION OF CODE FOR TRADING IN RIGHTS
Chart Of The Day - ASI Chart Vs ASI Advance Decline Line (YTD) (19-Dec-2025 15:11:10.629)
InfoWARE AI Analyst Daily Market Report: 19-Dec-2025
[XNSA]>> OFF MARKET TRADE
[XNSA]>> OFF MARKET TRADE
[XNSA]>> OFF MARKET TRADE
[SIAMLETF40]>> DAILY INDICATIVE PRICES
[XNSA]>> INTRODUCTION OF COMMERCIAL PAPER LISTING AND TRADING ON NGX
[XNSA]>> EXTENSION FOR TRADING IN RIGHTS ISSUE
Get IDIA - the stock trading app for the modern investor
Solutions by Business
Product Suites
Company
Contacts
- 8th Floor,
- South Atlantic Petroleum Towers,
- 1 Adeola Odeku Street,
- Victoria Island,
- Lagos, Nigeria.
- Email: solutions@infowarelimited.com
Follow Us
 |
 |
 |
 |