


InfoWARE AI Analyst Daily Market Report: 19-Dec-2025 | InfoWARE Finance
Get IDIA - the stock trading app for the modern investor


InfoWARE AI Analyst Daily Market Report: 19-Dec-2025
(Source: InfoWARE Terminal, Date: 19-Dec-2025)
Dear Investor,
NGX Daily Market Summary – Friday, December 19, 2025
The Nigerian equities market surged strongly today, with the NGX All Share Index (+1.13%) closing at 150,363.05. Year-to-date gains now stand at a robust 47.37%, highlighting a stellar performance through 2025. Market turnover soared to ₦11.01B (+167.22% vs. previous day), driven by heavy institutional flows, while trading volume rocketed to 487.06M shares from yesterday’s 58.75M. Market breadth was positive at 1.32x (37 advancers vs. 28 decliners), reflecting broad participation in the rally. Notably, several names flashed both bullish and contrarian signals on technicals, and sector and investor activity revealed key rotation themes as year-end approaches.
📈 Key Market Trends
- Market Breadth: Advancers outpaced decliners (37 vs. 28), signaling strong underlying momentum and suggesting sustained institutional support.
-
Unusual Volume Spikes:
- STERLINGNG: +1,669% volume surge – typically a harbinger of institutional repositioning.
- TANTALIZER: +384.54% above average, linking with its top gainer status (+9.80%).
- CHAMS: +173% volume and top gainer table, pointing to potentially sustainable bullish momentum.
- Turnover Analysis: The spike in turnover (to ₦11.01B) reflects institutional end-of-year repositioning, amplifying liquidity and short-term volatility. Such jumps can signal trend persistence in favored tickers.
- Bullish Crossovers: Multiple stocks closed above their 15DMA ("bullish momentum”); several show corroborating MACD or RSI signals (see below).
- Bearish Crossovers: Select ETFs (MERGROWTH, MERVALUE), ACCESSCORP, ROYALEX, and others fell below 15DMA, even as the broader market rose. Contrarian watch recommended.
🔥 Top Gainers & Losers
- Top Gainer: AUSTINLAZ +10.00% – sustained momentum, bullish crossover above 15DMA, with RSI at 36.7 (not overbought).
- TANTALIZER +9.80% – high RSI (57.1), volume surge, and price uptrend reinforce momentum story.
- ALEX +9.78% – RSI 99.2 (overbought!), riding strong positive 125D ROC, could face mean-reversion soon.
- CHAMPION +9.71% – RSI (58.9), positive MACD, buoyed by YTD gain of 344.88% (see YTD table).
- Top Loser: MERGROWTH -9.99%, MERVALUE -9.78% – ETFs leading the selloff, both triggered bearish 15DMA crossunder and negative price momentum.
- SOVRENINS (-7.42%) and ROYALEX (-6.84%) – insurance/finance pressure continues amid market-wide strength.
- YTD Gainers overlap today's performers: ALEX, CHAMPION, TANTALIZER continue to outperform, showing momentum persistence; ASOSAVINGS remains a standout YTD.
- YTD Losers: ETFs (MERGROWTH, MERVALUE), LIVINGTRUST, JAPAULGOLD – some showing continued deterioration, especially where technical breakdown aligns with fundamental weakness.
🔮 Insights & Predictions
- Turnover Increase: The dramatic surge in market turnover can precede trend continuation as liquidity thickens; often institutions ‘window-dress’ into year-end winners. Watch continued strength in high turnover, high momentum names.
- Advance/Decline Trend: Strong advancers signal sector and broad-market tailwinds; decliners are often concentrated in specialized ETFs and select insurance/banking plays.
-
Unusual Volume:
- STERLINGNG and FCMB: Large volume surges could precede near-term breakouts or "fast money” reversals. Monitor for follow-through buying and entrance of retail.
- TANTALIZER, CHAMS: High volume plus uptrend may attract short-term traders seeking continuation.
-
Momentum Bullish Stocks:
- ALEX and ASOSAVINGS: RSI readings near or above 98–99 signal "overbought”; institutional traders may soon start profit-taking.
- CHAMPION: YTD gainer with solid momentum, but RSI below 70, suggesting possible room for further upside, but watch for trend exhaustion signs.
- AFRIPRUD: Yields 1.27%, Beta 0.64; offers a rare mix of defensive yield, low risk, and technical upturn – attractive for conservative allocators seeking returns with lower volatility.
-
Bearish Momentum Stocks:
- ACCESSCORP, MERVALUE, MERGROWTH: Crossed below 15DMA, confirming downtrends despite overall bullish market.
- ROYALEX, LINKASSURE: Price and technicals weak, but below 15DMA while market rallies – contrarian or broken stories; low conviction for value buyers till reversal triggers.
⚡ Contrarian Signals
- CHAMPION: RSI 58.9 (neutral), but strong price, positive MACD, and top YTD gainer list (+344.88%). While not overbought, YTD return is stretched; trailing stop suggested for momentum traders.
- TANTALIZER: On top gainers, strong volume, RSI below overbought at 57.1 – but continued inflows even as some peers appear over-extended.
- ALEX: RSI at extreme 99.2, price at top of YTD table. Typically a warning of impending correction, but momentum crowd may push one last leg higher.
- SOVRENINS: On top loser list, despite high RSI (71.4) – a technical divergence pointing to, potentially, failed rallies and reversal pressure.
- MERISTEM ETFs: High RSI, negative MACD, breakdown below moving averages and sharp price drops. Could reflect rotational exits or tactical allocation changes.
🌡️ Sector Heatmaps
| Sector | Top Performer | Price Change (%) | Institutional Activity | Retail Activity | Technical Trend |
|---|---|---|---|---|---|
| Banking | FIRSTHOLDCO | +5.39 | High (Inst. Vol: 48.3M) | Moderate | Bullish (above 15DMA) |
| Other Financial Institutions | AFRIPRUD | +8.82 | Medium | Medium | Bullish (above 15DMA, strong yield/Low Beta) |
| Insurance | SOVRENINS | -7.42 | Low | Low | Bearish (below 15DMA) |
| Processing Systems | CHAMS | +8.54 | Low | High | Bullish (high volume, above 15DMA) |
| Hospitality | TANTALIZER | +9.80 | Low | High | Strong Bullish (RSI 57.1, volume up) |
| ETF | MERGROWTH | -9.99 | Low | Low | Bearish (below 15DMA, large drawdown) |
💰 Dividend–Beta Matrix (Defensive Opportunities)
| Stock | Dividend Yield (%) | Beta | Technical Trend | Comment |
|---|---|---|---|---|
| AFRIPRUD | 1.27 | 0.64 | Bullish (above 15DMA) | Low risk, defensive play with yield; fits balanced portfolios |
| GUINNESS | 11.52 | 0.33 | Bullish, YTD outperformer | High yield & low beta, may attract risk-off flows |
| CAVERTON | 5.52 | 0.98 | Bullish (just above 15DMA) | Volatile, but technicals improving |
| ABCTRANS | 2.19 | 0.01 | Bullish breakout | Low beta with yield, speculative |
🏦 Institutional Clustering Alerts
- ZENITHBANK: Made up 20.17% of institutional trade value – shows heavy institutional clustering, attention warranted for breakout or reversal.
- FIRSTHOLDCO: Led institutional activity by volume and value (48.3M shares; ₦2.19B) and up 5.39% – momentum likely persists unless large profit-taking emerges.
- GTCO & ACCESSCORP: Strong presence in both retail and institutional flows, but ACCESSCORP sits on bearish technical signals; possible short-term whipsawing.
💡 Additional Commentary on High Yield & Bullish/Bearish Tables
- AFRIPRUD: High yield, bullish momentum – attractive for defensive investors seeking to pair yield with technical uptrends.
- ABCTRANS, CAVERTON: Both provide reasonable yield with bullish signals, potentially lower-beta income trades.
- Insurers (e.g., NEM, GUINEAINS): Show yield and technical strength but require sector-wide caution due to recent rotation out of financials.
🚨 Trade Suggestions
- Momentum traders: Consider trailing stops on overbought leaders (ALEX, ASOSAVINGS), while riding trends in TANTALIZER, CHAMS, FIRSTHOLDCO (institutional support). Watch for mean reversion on extreme RSI names.
- Defensive/income portfolios: Accumulate AFRIPRUD or GUINNESS on pullbacks; both offer robust yields and lower beta.
- Contrarian players: ETFs (MERGROWTH, MERVALUE) now deeply oversold; value hunters may start to nibble, but confirmation required.
- Avoid: Chasing insurance/banking laggards below 15DMA unless reversal emerges; these have lagged despite broad market rally.
- Unusual volume: Use TANTALIZER, STERLINGNG watchlist as they may offer short-term trading opportunities.
🏦 Market Activity — Retail vs Institutional Insights
Retail accounted for 61.26% of trade count but only 11.76% of trade value and 17.86% of volume. Institutional flows dominated value (88.24%) and volume (82.14%), confirming a session led by big investors.
| Investor Type | Total Trades | Total Volume | Gross Trade Amount (₦) | % of Trades | % of Volume | % of Value |
|---|---|---|---|---|---|---|
| Institutional | 1,795 | 737,197,950 | ₦14,665,228,753 | 38.74% | 82.14% | 88.24% |
| Retail | 24,457 | 160,299,402 | ₦1,954,077,595 | 61.26% | 17.86% | 11.76% |
- Top 5 Institutional Stocks:
- FIRSTHOLDCO: Heavy volume and value, institutional long bias.
- ZENITHBANK: Some selling despite clustering, possible rotation.
- ACCESSCORP: Divided flows; technicals weak, possible unwinding.
- GTCO: Balanced, both retail and institutional flows, neutral close.
- MTNN: Split between sectors, institutional accumulation visible.
- Top 5 Retail Stocks:
- MTNN: Attracted highest retail trade count but modest price action.
- ACCESSCORP, GTCO, ZENITHBANK: All major banking names; reflects retail risk appetite but technical trends diverge, implying institutions may be exiting as retail enters.
- ELLAHLAKES: Modest positive performance and retail popularity.
- Pattern: Institutions dominated high volume/value names and drove the bullish tone, especially in already rising winners. Retail investors were more active in banking names and laggards, a classic late-cycle "FOMO” signature.
🌟 Hidden Insights & Competitive Edge
- Volume/Value rotation: Institutional clustering in outperforming sectors (Banking, Diversified Financials) with retail skew in laggards could portend late-stage rotation. Tactical traders may find opportunity fading in "consensus longs” – caution advised for new positions in overextended names.
- Defensive yield with momentum: Stocks like AFRIPRUD and GUINNESS blend low beta with yield and uptrending technicals. These set up as strong defensive trades, especially if broader market volatility returns.
- ETF capitulation: Harsh drawdowns and technical breakdown in MERGROWTH, MERVALUE may soon reach exhaustion; watch for snapback rallies, but only if overall liquidity remains robust.
- Divergent RSI/MACD: Several top gainers have not reached overbought RSI, suggesting more upside, but vigilantly manage positions where RSI/price divergence emerges (e.g., SOVRENINS, ALEX).
Tuesday/Wednesday YTD Top Movers Table
| YTD Top Gainers | ||||||
|---|---|---|---|---|---|---|
| Stock | Price | %Chg5Dys | %ChgYTD | RSI | DivYield | PE |
| ASOSAVINGS | 3.21 | 200.00 | 542.00 | 98.21 | 10.00 | 35.46 |
| CHAMPION | 15.45 | 19.37 | 344.88 | 58.93 | 0.41 | 412.83 |
| ALEX | 11.25 | 45.29 | 72.73 | 99.24 | 6.99 | 20.14 |
| MECURE | 55.00 | 31.89 | 295.68 | 98.03 | 0.00 | — |
| GUINNESS | 289.70 | 20.96 | 312.38 | 95.03 | 11.52 | 31.75 |
| YTD Top Losers | ||||||
| Stock | Price | %Chg5Dys | %ChgYTD | RSI | DivYield | PE |
| MERGROWTH | 591.32 | -20.04 | 34.90 | 55.69 | 0.00 | — |
| LIVINGTRUST | 3.31 | -12.99 | -23.52 | 38.36 | 1.67 | 35.78 |
| JAPAULGOLD | 2.40 | -10.86 | 11.22 | 50.05 | 0.90 | 0.19 |
| INTENEGINS | 2.27 | -9.92 | 21.39 | 38.41 | 3.40 | 0.52 |
| NEWGOLD | 53000 | -9.40 | 82.11 | 43.8 | 0.00 | 0.00 |
🇳🇬 Currency Market Roundup
- The Naira appreciated slightly by 0.01% against the Dollar, closing at 1,453/$.
Strategic Takeaways
- Monitor profit-taking in extreme technical names (ALEX, ASOSAVINGS), but stay open to trend follow-through in high momentum, high volume stocks.
- Institutions remain in control; follow their activity for signals of sector rotation or year-end window dressing.
- Defensive names offering high yield and momentum (AFRIPRUD, GUINNESS) offer appealing risk/reward in the current landscape.
- Expectation: Possible pause/consolidation next week if RSI/MACD divergences increase and liquidity dissipates post-turnover spike.
- Traders: Be nimble; use stops. Investors: Consider scaling into defensive, high yield, or low beta names on sector rotation.
|
Top ASI Gainers Over Last 5 Trading Days
|
Top ASI Losers Over Last 5 Trading Days
|
For more detailed analysis, on InfoWARE Market Data Terminal <NSEPERF> <GO>
On InfoWARE Finance Mobile App (Android, iPhone & iPad, Windows Phone and Windows 8/10), "Top Gainers & Losers"
AUSTIN LAZ & COMPANY PLC (AUSTINLAZ) topped the advancers list closing at N2.42 with a gain of 10.00% followed by UNION DICON SALT PLC. (UNIONDICON) which closed at N6.60 with a gain of 10.00%.
On the flip side MERISTEM GROWTH EXCHANGE TRADED FUND (MERGROWTH) and MERISTEM VALUE EXCHANGE TRADED FUND (MERVALUE) topped the decliners log with a loss of -10.00% at a close of N532.20, and -9.79% to close the day at N353.00 respectively.
| Symbol | LClose | %Chg |
|---|---|---|
| AUSTINLAZ | 2.42 | 10.00 |
| UNIONDICON | 6.60 | 10.00 |
| TANTALIZER | 2.69 | 9.80 |
| ALEX | 12.35 | 9.78 |
| CHAMPION | 16.95 | 9.71 |
| Symbol | LClose | %Chg |
|---|---|---|
| MERGROWTH | 532.20 | -10.00 |
| MERVALUE | 353.00 | -9.79 |
| SIAMLETF40 | 1,148.00 | -7.44 |
| SOVRENINS | 3.87 | -7.42 |
| ROYALEX | 1.77 | -6.84 |
For more detailed analysis,
- On InfoWARE Market Data Terminal <TOPG> <GO>
- On InfoWARE Finance Mobile App ( Android, iPhone & iPad and Windows 10) , "Top Gainers & Losers"
Currency Market
In the currency market, the Naira appreciated 0.01%(0.10) against the Dollar to settle at 1 to 1Investment Insights - Top 5 Gainers YTD
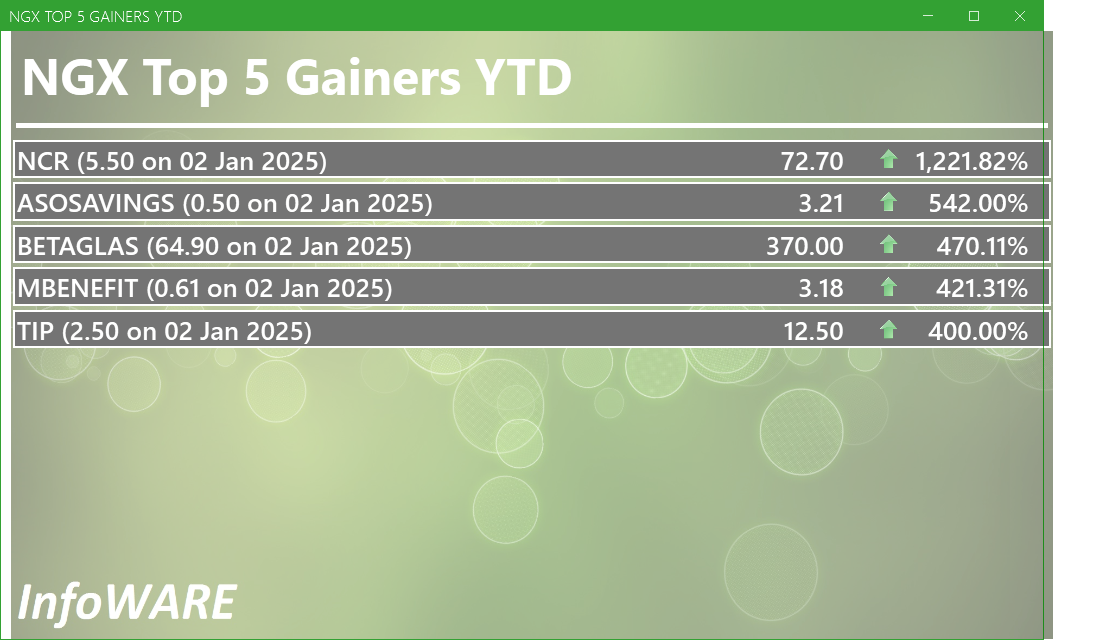
These stocks are the best performers whose price has risen faster than the market as a whole with the best returns year to date. Momentum investors believe that stocks that have outperformed the market will often continue to do so because the factors that caused them to outperform will not suddenly disappear. In addition, other investors seeking to benefit from the stock’s outperformance will often purchase the stock, further bidding its price higher and pushing the stock higher still
For more detailed analysis,
- On InfoWARE Market Data Terminal <T5YTD2> <GO>
- On InfoWARE Finance Mobile App ( Android , iPhone & iPad and Windows 10) , "Research"
NSE: Bull Signal - Price crossed above 15 Day MA
This signal implies these stocks are under buying pressure and the price might continue to rise and therefore positions should be monitored closely. Further suggested analysis include looking at the overall market (ASI) to see if the uptrend is market wide, sector wide or specific to the stock. Portfolio managers tend to use this as a signal to do more research to add to their positions or lock in some profits. Typically further analysis should be done using commands like PC and RV on the InfoWARE Market Data Terminal. Another command is ALERTS to set price triggers for possible exit or entry as necessary
For more detailed analysis,
- On InfoWARE Market Data Terminal <NSEPERF> <GO>
- On InfoWARE Finance Mobile App ( Android , iPhone & iPad and Windows 10) , "Top Gainers & Losers"
| Symbol | Price | %Chg | 15DMA | PE | EPS | DivY | MktCap | Vol | Trades | Value | LstTradeTime |
|---|---|---|---|---|---|---|---|---|---|---|---|
| AUSTINLAZ | 2.42 | 9.09 | 2.29 | 0.00 | 0.00 | 0.00 | 2.61B | 2.25M | 42.00 | 5.44M | 19-Dec-2025 14:30:11.660 |
| UNIONDICON | 6.60 | 9.09 | 6.29 | 0.00 | 0.00 | 6.25 | 1.80B | 1.27M | 47.00 | 8.02M | 19-Dec-2025 14:30:24.563 |
| AFRIPRUD | 13.60 | 8.82 | 12.87 | 19.57 | 0.61 | 1.27 | 27.20B | 1.66M | 109.00 | 22.42M | 19-Dec-2025 14:30:11.437 |
| VETGRIF30 | 59.00 | 8.73 | 56.65 | 0.00 | 0.00 | 11.65K | 19.00 | 633.10K | 19-Dec-2025 14:31:05.470 | ||
| ABCTRANS | 3.50 | 8.57 | 3.25 | 6.68 | 0.17 | 2.19 | 8.37B | 1.13M | 102.00 | 3.73M | 19-Dec-2025 14:30:11.333 |
| CHAMS | 3.28 | 8.54 | 3.08 | 27.02 | 0.07 | 1.56 | 15.40B | 36.94M | 466.00 | 114.03M | 19-Dec-2025 14:31:04.340 |
| GUINEAINS | 1.22 | 6.56 | 1.17 | 66.79 | 0.01 | 1.96 | 7.49B | 854.44K | 52.00 | 1.01M | 19-Dec-2025 14:30:21.700 |
| NEM | 26.30 | 5.70 | 25.89 | 24.99 | 0.37 | 6.52 | 131.93B | 3.39M | 168.00 | 81.80M | 19-Dec-2025 14:30:23.113 |
| BUACEMENT | 170.00 | 4.71 | 163.40 | 0.00 | 0.00 | 2.11 | 5,756.94B | 587.24K | 549.00 | 98.54M | 19-Dec-2025 14:30:11.783 |
| VFDGROUP | 10.60 | 3.30 | 10.38 | 0.00 | 0.00 | 0.00 | 0.00 | 1.10M | 82.00 | 11.51M | 19-Dec-2025 14:30:24.980 |
| CWG | 18.60 | 3.23 | 18.36 | 0.00 | 0.00 | 2.46 | 46.96B | 4.43M | 170.00 | 76.56M | 19-Dec-2025 14:30:20.283 |
| CAVERTON | 5.35 | 2.80 | 5.24 | 1.15 | 1.57 | 5.52 | 17.93B | 1.33M | 96.00 | 7.42M | 19-Dec-2025 14:30:11.887 |
| CUSTODIAN | 39.00 | 2.56 | 38.41 | 3.80 | 3.29 | 1.20 | 229.39B | 20.77M | 83.00 | 809.63M | 19-Dec-2025 14:30:20.120 |
| NGXMERIGRW | 9,993.00 | 0.41 | 9,969.79 | 34.89 | 293.99 | 0.00 | 0.00 | 27.75M | 2,786.00 | 2.06B | 19-Dec-2025 14:30:33.563 |
| FG202031S1 | 105.75 | 0.00 | 105.73 | 0.00 | 0.00 | 0.00 | 0.00 | 0.00 | 19-Dec-2025 14:30:28.537 |
NSE: BEAR Signal - Price crossed below 15 Day MA
This signal implies these stocks are under selling pressure and the price might continue to slide and therefore positions should be monitored closely. Further suggested analysis include looking at the overall market (ASI) to see if the downtrend is market wide, sector wide or specific to the stock. If the overal market trend is upwards, then since these stocks are heading in the opposite direction, then further analysis should be done using commands like PC and RV on the InfoWARE Market Data Terminal. Another command is ALERTS to set price triggers for possible exit is necessar
For more detailed analysis,
- On InfoWARE Market Data Terminal <BEARM> <GO>
- On InfoWARE Finance Mobile App ( Android , iPhone & iPad and Windows 10)
| Symbol | Price | %Chg | 15DMA | PE | EPS | DivY | MktCap | Vol | Trades | Value | LstTradeTime |
|---|---|---|---|---|---|---|---|---|---|---|---|
| NGXAFRBVI | 3,187.72 | -1.12 | 3,220.08 | 3.14 | 35.50 | 0.00 | 0.00 | 54.69M | 4,114.00 | 3.19B | 19-Dec-2025 14:30:32.983 |
| ACCESSCORP | 20.50 | -2.20 | 20.68 | 8.56 | 2.81 | 1.87 | 728.68B | 22.64M | 1,290.00 | 470.01M | 19-Dec-2025 14:31:09.730 |
| LINKASSURE | 1.70 | -5.88 | 1.76 | 59.89 | 0.02 | 5.56 | 23.80B | 5.86M | 68.00 | 9.94M | 19-Dec-2025 14:30:22.330 |
| EUNISELL | 80.00 | -6.25 | 80.03 | 0.00 | 0.00 | 0.31 | 18.94B | 312.45K | 78.00 | 24.76M | 19-Dec-2025 14:30:21.030 |
| ROYALEX | 1.77 | -7.34 | 1.87 | 0.00 | 0.00 | 7.81 | 9.11B | 1.62M | 63.00 | 2.97M | 19-Dec-2025 14:30:23.780 |
| MERVALUE | 353.00 | -10.85 | 375.84 | 0.00 | 0.00 | 1.19K | 5.00 | 428.62K | 19-Dec-2025 14:31:05.300 | ||
| MERGROWTH | 532.20 | -11.11 | 585.44 | 0.00 | 0.00 | 19.00 | 2.00 | 10.11K | 19-Dec-2025 14:31:05.287 |
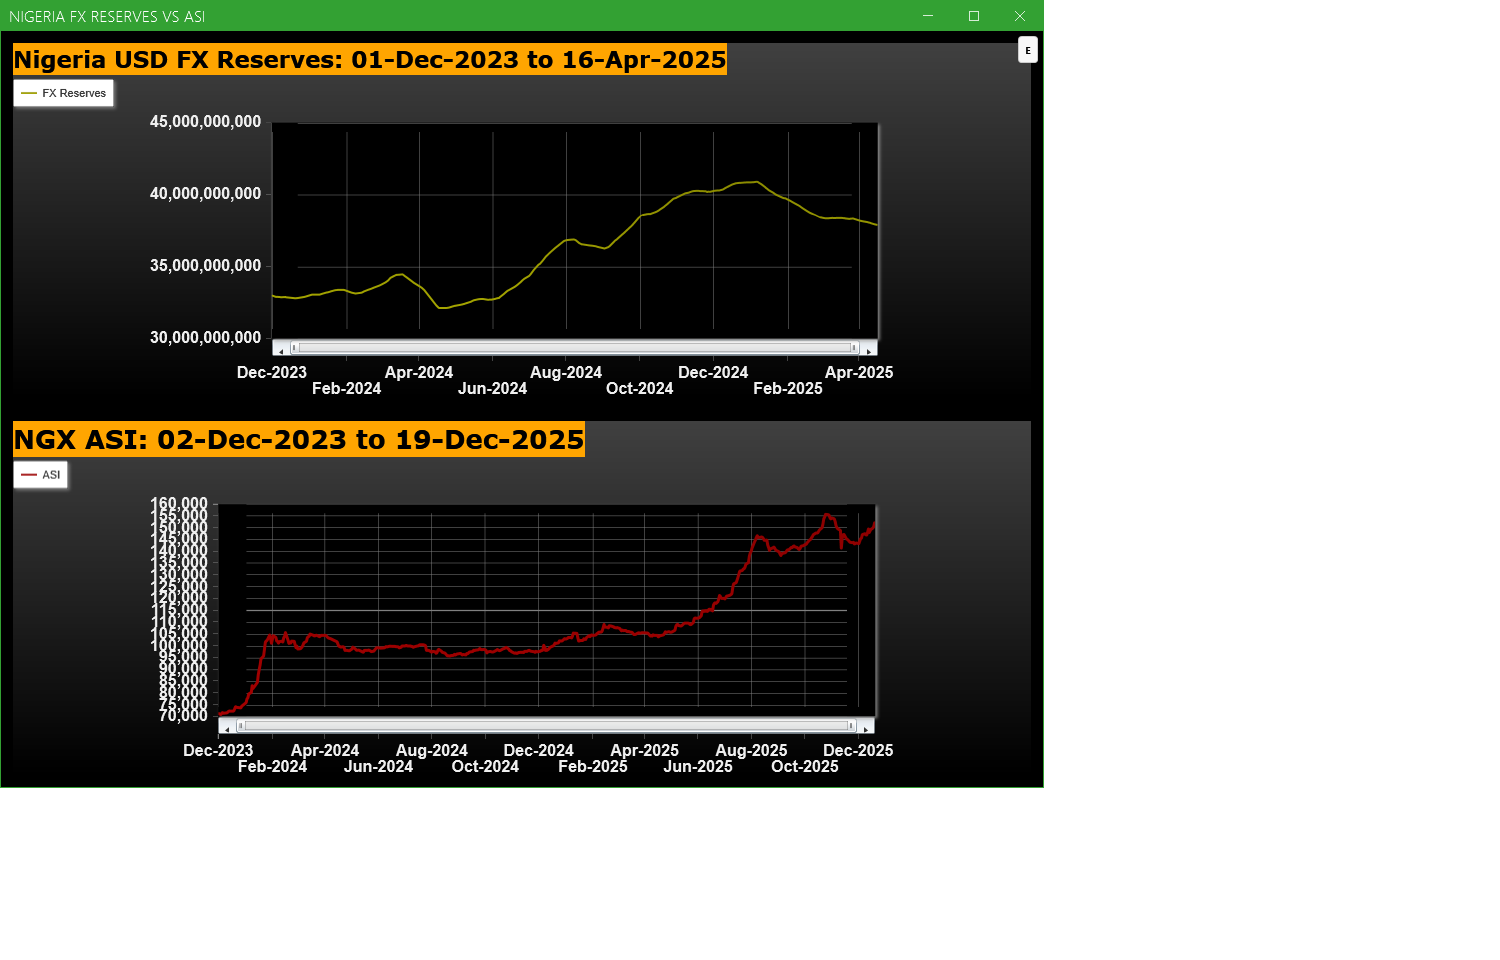
Economic Indicators - Nigeria FX Reserves Vs ASI Chart
Nigeria FX Reserves are assets held on reserve by CBN in foreign currencies. These reserves are used to back liabilities and influence monetary policy. Given the nature of the Nigeria economy, FX Reserves can appear to have an outsize influence on the economy and hence on the capital market. The chart below allows comparison of FX Reserves against the ASI to make investment decisions
For more detailed analysis,
- On InfoWARE Market Data Terminal <CI> <GO>
- On InfoWARE Finance Mobile App ( Android , iPhone & iPad and Windows 10) , "Research"
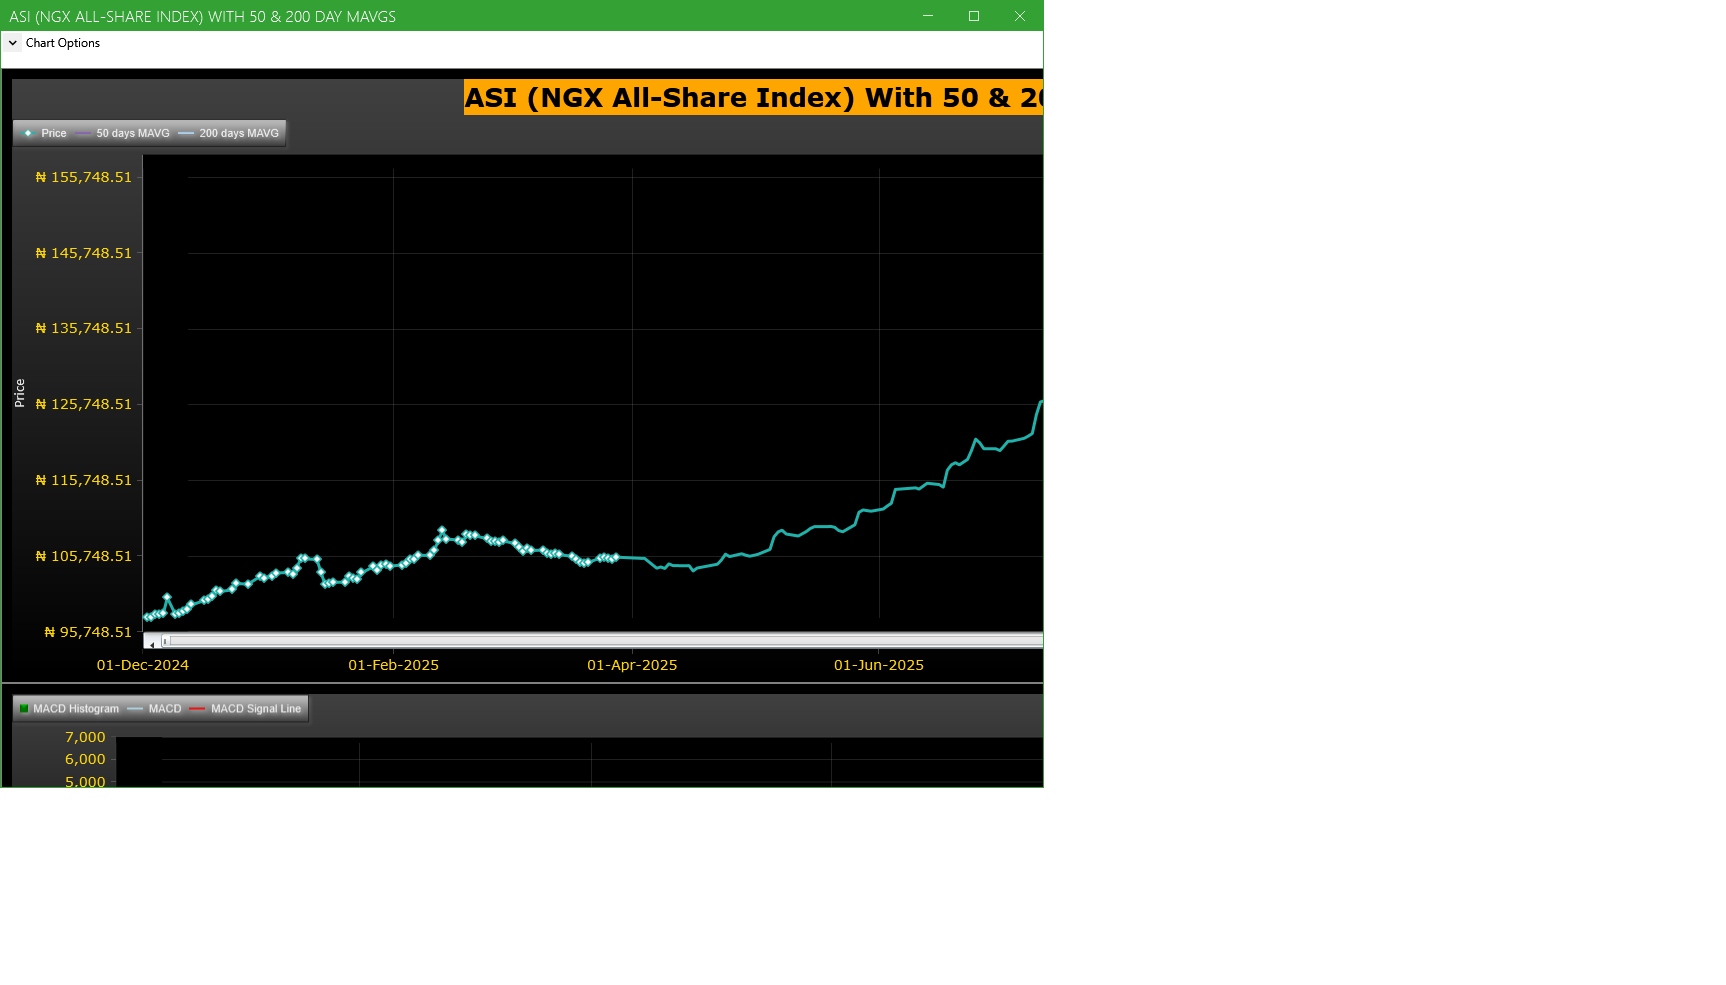
Market Trend - ASI (NGX All-Share-Index) With 50 & 200 Day MAvgs Chart
Technical traders typically use the 50 & 200 day moving averages to aid in choosing
where to enter or exit a position, which then causes these levels to act as strong
support or resistance. As a general guideline, if the price is above a moving average,
the trend is up. If the price is below a moving average, the trend is down.
It is important to note that critics of technical analysis say that moving averages act
as support and resistance because so many traders use these indicators to inform their
trading decisions. Also moving averages tend to work quite well in strong trending conditions
but poorly in choppy or ranging conditions.
Trading Strategies: Crossovers
Crossovers are one of the main moving average strategies. The first type is a price crossover,
which is when the price crosses above or below a moving average to signal a potential change
in trend. Another strategy is to apply two moving averages to a chart: one longer and one
shorter. When the shorter-term MA crosses above the longer-term MA, it is a buy signal, as
it indicates that the trend is shifting up. This is known as a golden cross. Meanwhile, when
the shorter-term MA crosses below the longer-term MA, it is a sell signal, as it indicates that
the trend is shifting down. This is known as a dead/death cross
For more detailed analysis,
- On InfoWARE Market Data Terminal <CI> <GO>
- On InfoWARE Finance Mobile App ( Android , iPhone & iPad and Windows 10) , "Research"
Unusual Volume: Volume traded is more than double the 90 day moving average (All exchanges; ASI & ASem). For more detailed analysis,
- On InfoWARE Market Data Terminal <UV> <GO>
- On InfoWARE Finance Mobile App ( Android , iPhone & iPad and Windows 10)
| Symbol | Name | Volume | 90DAvgVol | %VolChg | Price | LClose | %Chg | Trades | Value |
|---|---|---|---|---|---|---|---|---|---|
| STERLINGNG | STERLING FINANCIAL HOLDINGS COMPANY PLC | 278.72M | 15.75M | 1,669.60 | 7.10 | 6.90 | 2.90 | 327 | 1.96B |
| FCMB | FCMB GROUP PLC. | 75.64M | 25.53M | 196.24 | 10.60 | 10.60 | 0.00 | 391 | 801.42M |
| TANTALIZER | TANTALIZERS PLC | 58.96M | 12.17M | 384.54 | 2.69 | 2.45 | 9.80 | 286 | 137.58M |
| CONHALLPLC | CONSOLIDATED HALLMARK INSURANCE PLC | 50.69M | 24.28M | 108.71 | 4.30 | 4.21 | 2.14 | 59 | 211.05M |
| CHAMS | CHAMS PLC | 36.94M | 13.52M | 173.31 | 3.28 | 3.00 | 9.33 | 466 | 114.03M |
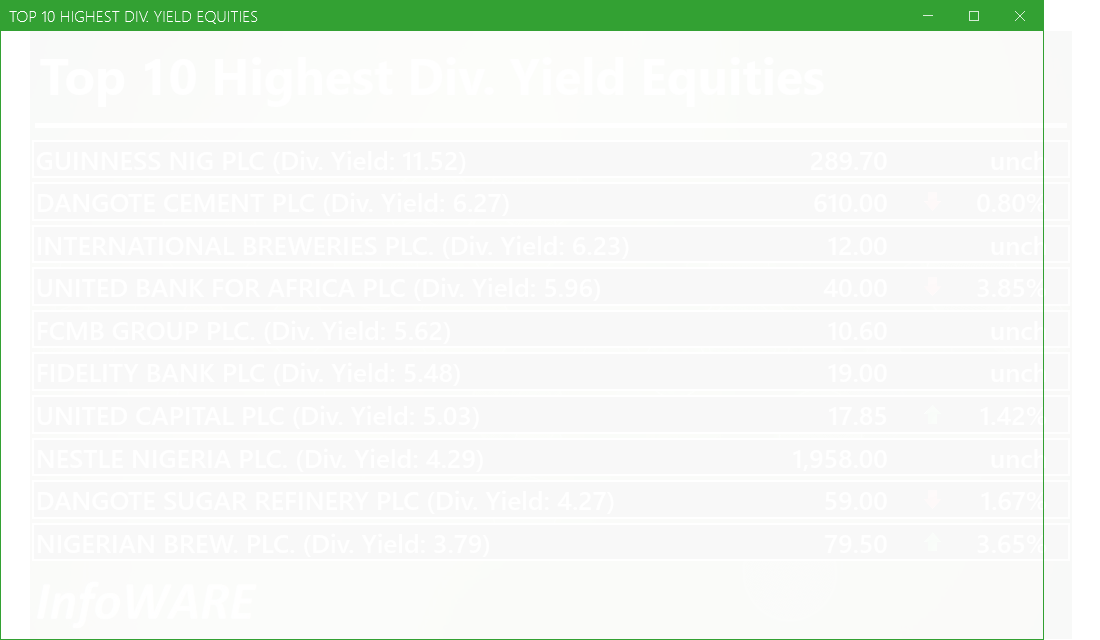
Investment Insights - High Div. Stocks
Dividend stocks distribute a portion of the company earnings to investors on a regular basis and they can a great choice for investors looking for regular income. As an investment or trading strategy, high dividend yield equities provide annual cash payments as against mostly capital gains in the price of a stock. The list in the table below represent the highest dividend paying stocks from the list of the most liquid stocks in the NSE top 30.
For more detailed analysis,
- On InfoWARE Market Data Terminal <HYIELD> <GO>
- On InfoWARE Finance Mobile App ( Android , iPhone & iPad and Windows 10) , "Research"
Investment Insights - Stocks outperforming the ASI but with approximately the same risk
These list of stocks represent equities that are less risky than the ASI but doing better than the ASI (All Shares Index) using the YTD (Year to Date) returns as the measure. The risk is measured by Beta. Beta is an assessment of a stock's tendency to undergo price changes, (its volatility), as well as its potential returns compared to the ASI. It is expressed as a ratio, where a score of 1 represents performance comparable to the ASI, and returns above or below the market may receive scores greater or lower than 1.
For a full list of both positively and negatively corelated stocks visit InfoWARE Market Data Terminal
- On InfoWARE Market Data Terminal <BANL> <GO>
- On InfoWARE Finance Mobile App ( Android , iPhone & iPad and Windows 10)
| Symbol | DivYield | PE | EPS | Beta | %ChgYTD | ASIYTDReturn | BetaDiff |
|---|---|---|---|---|---|---|---|
| HONYFLOUR | 1.40 | 16.28 | 0.31 | 0.99 | 156.50 | 47.37 | 0.01 |
| CAVERTON | 5.52 | 1.15 | 1.57 | 0.98 | 109.80 | 47.37 | 0.02 |
| ROYALEX | 7.81 | 0.00 | 0.00 | 0.96 | 60.91 | 47.37 | 0.04 |
| UNIVINSURE | 0.00 | 0.00 | 0.00 | 0.83 | 59.72 | 47.37 | 0.17 |
| FTNCOCOA | 1.60 | 0.00 | 0.00 | 0.79 | 135.11 | 47.37 | 0.21 |
| NB | 3.79 | 16.95 | 1.60 | 0.79 | 148.44 | 47.37 | 0.21 |
| MAYBAKER | 3.75 | 58.94 | 0.14 | 0.78 | 89.36 | 47.37 | 0.22 |
| UNILEVER | 2.81 | 67.09 | 0.40 | 0.75 | 100.00 | 47.37 | 0.25 |
| VETGOODS | 0.00 | 0.71 | 101.16 | 47.37 | 0.29 | ||
| VETGRIF30 | 0.00 | 0.71 | 56.29 | 47.37 | 0.29 |
African Markets
| Name | LClose | Change | %Chg |
|---|---|---|---|
| BRVM Stock Exchange | 342.66 | -3.57 | -1.03 |
| Botswana Stock Exchange | 10,918.01 | -14.21 | -0.13 |
| Egyptian Exchange | 40,926.86 | -576.90 | -1.39 |
| Ghana Stock Exchange | 8,745.74 | 24.42 | 0.28 |
| Johannesburg Stock Exchange | 114,515.80 | 467.60 | 0.41 |
| Lusaka Stock Exchange | 25,599.51 | -2.56 | -0.01 |
| Malawi Stock Exchange | 607,964.21 | -304.13 | -0.05 |
| Nigeria Stock Exchange | 150,363.05 | 524.44 | 0.35 |
| Nairobi Securities Exchange | 183.84 | 3.07 | 1.70 |
| Namibian Stock Exchange | 2,093.84 | 8.34 | 0.40 |
| Rwanda Stock Exchange | 181.75 | 0.78 | 0.43 |
| Tunis Stock Exchange | 13,220.28 | 39.54 | 0.30 |
| Uganda Securities Exchange | 1,558.43 | 18.48 | 1.20 |
Nigeria Market Indexes
| Symbol | LClose | %Chg | WTD% | MTD% | QTD% | YTD% | MktCap | Trades |
|---|---|---|---|---|---|---|---|---|
| ASI | 152,057.38 | 1.13 | 1.75 | 6.18 | 6.35 | 47.37 | 22,530 | |
| NGX30 | 5,545.74 | 1.13 | 1.52 | 5.89 | 6.28 | 45.37 | 12,737 | |
| NGXAFRBVI | 3,187.72 | -1.11 | -1.48 | 2.38 | -10.19 | 28.50 | 4,114 | |
| NGXAFRHDYI | 21,058.80 | -0.23 | 0.14 | 1.34 | -5.40 | 23.67 | 4,957 | |
| NGXASEM | 1,392.88 | 0.00 | 0.00 | 0.00 | -9.44 | -12.05 | 4 | |
| NGXBNK | 1,463.56 | 0.08 | 1.85 | 5.80 | -3.51 | 34.59 | 6,053 | |
| NGXCG | 4,159.15 | 0.31 | 2.43 | 8.35 | 2.67 | 47.01 | 11,609 | |
| NGXCNSMRGDS | 3,726.91 | 3.82 | 5.34 | 10.05 | 10.17 | 114.89 | 3,255 | |
| NGXCOMMDTY | 1,176.90 | -0.14 | 0.34 | -0.39 | 4.91 | 17.69 | 1,527 | |
| NGXGROWTH | 23,909.47 | 0.20 | 24.10 | 61.72 | 58.64 | 208.00 | 412 | |
| NGXINDUSTR | 5,565.13 | 1.46 | 0.72 | 8.49 | 9.81 | 55.81 | 2,011 | |
| NGXINS | 1,170.98 | 0.04 | 2.19 | 8.05 | -2.10 | 48.94 | 1,375 | |
| NGXLOTUSISLM | 13,412.80 | 1.22 | 1.63 | 5.11 | 12.99 | 92.50 | 4,984 | |
| NGXMAINBOARD | 7,238.33 | 1.91 | 2.27 | 3.62 | 2.75 | 44.65 | 15,447 | |
| NGXMERIGRW | 9,993.00 | 0.41 | 0.55 | 0.30 | 0.91 | 53.19 | 2,786 | |
| NGXMERIVAL | 12,899.22 | -1.21 | 0.56 | 4.74 | -3.51 | 23.67 | 4,600 | |
| NGXOILGAS | 2,675.99 | -0.03 | -0.12 | -0.76 | 5.94 | -1.30 | 1,289 | |
| NGXPENBRD | 2,858.94 | 1.19 | 1.75 | 6.11 | 7.84 | 56.09 | 18,353 | |
| NGXPENSION | 6,997.51 | 0.26 | 1.64 | 5.69 | 3.85 | 54.33 | 13,776 | |
| NGXPREMIUM | 15,616.57 | -0.25 | 0.69 | 10.87 | 14.06 | 60.45 | 6,238 | |
| NGXSOVBND | 680.95 | 0.00 | 3.23 | 1.11 | 3.60 | 13.20 | 0 |
For more detailed analysis,
- On InfoWARE Market Data Terminal <MKTINS> <GO>
- On InfoWARE Finance Mobile App ( Android, iPhone & iPad and Windows 10) , "Market Indexes"
Find the topic interesting? Will like to comment? Contact Us at solutions@infowarelimited.com
Top News

Chart Of The Day - ASI Chart Vs ASI Advance Decline Line (YTD) (19-Dec-2025 15:11:10.629)
InfoWARE AI Analyst Daily Market Report: 19-Dec-2025

[XNSA]>> OFF MARKET TRADE
[XNSA]>> OFF MARKET TRADE
[XNSA]>> OFF MARKET TRADE
[SIAMLETF40]>> DAILY INDICATIVE PRICES
[XNSA]>> INTRODUCTION OF COMMERCIAL PAPER LISTING AND TRADING ON NGX
[XNSA]>> EXTENSION FOR TRADING IN RIGHTS ISSUE
[XNSA]>> CHAMPION BREWERIES PLC: ACTIVATION OF CODE FOR TRADING IN RIGHTS
Chart Of The Day - ASI Chart Vs ASI Advance Decline Line (YTD) (18-Dec-2025 15:14:25.375)
InfoWARE Analyst Daily Market Report (18-Dec-2025 15:14:20.446)
[XNSA]>> CORDROS MILESTONE FUNDS' BID & OFFER PRICES
[VSPBONDETF]>> DAILY INDICATIVE PRICES
[LOTUSHAL15]>> DAILY INDICATIVE PRICES
[XNSA]>> INTRODUCTION OF COMMERCIAL PAPER LISTING AND TRADING ON NGX
[XNSA]>> APPOINTMENT OF A DIRECTOR
[XNSA]>> EXTENSION FOR TRADING IN RIGHTS ISSUE
[XNSA]>> CHAMPION BREWERIES PLC: ACTIVATION OF CODE FOR TRADING IN RIGHTS
Chart Of The Day - ASI Chart Vs ASI Advance Decline Line (YTD) (17-Dec-2025 15:08:18.368)
InfoWARE Analyst Daily Market Report (17-Dec-2025 15:08:13.696)
[XNSA]>> CORDROS MILESTONE FUNDS' BID & OFFER PRICES
[XNSA]>> OFF MARKET TRADE
[XNSA]>> OFF MARKET TRADE
[XNSA]>> INTRODUCTION OF COMMERCIAL PAPER LISTING AND TRADING ON NGX
[LOTUSHAL15]>> DAILY INDICATIVE PRICES
[VSPBONDETF]>> DAILY INDICATIVE PRICES
[XNSA]>> CHAMPION BREWERIES PLC: ACTIVATION OF CODE FOR TRADING IN RIGHTS
Chart Of The Day - ASI Chart Vs ASI Advance Decline Line (YTD) (16-Dec-2025 15:12:35.486)
InfoWARE AI Analyst Daily Market Report: 16-Dec-2025
[XNSA]>> OFF MARKET TRADE
Get IDIA - the stock trading app for the modern investor
Solutions by Business
Product Suites
Company
Contacts
- 8th Floor,
- South Atlantic Petroleum Towers,
- 1 Adeola Odeku Street,
- Victoria Island,
- Lagos, Nigeria.
- Email: solutions@infowarelimited.com
Follow Us
 |
 |
 |
 |