


InfoWARE AI Analyst Daily Market Report: 22-Dec-2025 | InfoWARE Finance
Get IDIA - the stock trading app for the modern investor


InfoWARE AI Analyst Daily Market Report: 22-Dec-2025
(Source: InfoWARE Terminal, Date: 22-Dec-2025)
Dear Investor,
NGX Market Summary – Monday, December 22, 2025
The Nigerian equities market kicked off the festive week on a positive note, with the NGX All Share Index (ASI) nudging up by 0.26% to close at 152,057.38. Year-to-date returns remain robust at 47.76%. However, market turnover moderated with total value traded down -10.41% compared to the last session, and aggregate market volumes slipped as well. Despite this, bulls were in the driver’s seat: market breadth advanced strongly at 1.82x (40 gainers vs. 22 losers), suggesting broad buying interest even as institutional activity (by value) dominated the trading tape. In an intriguing twist, ETFs were at both ends of the gainers/losers spectrum, highlighting asset allocation moves possibly tied to year-end portfolio reshuffling.
Market Breadth & Trends
- Bullish Breadth: 40 advancing stocks vs. 22 decliners (1.82x ratio) signaled a decisively positive market tone, defying the -10.41% drop in turnover.
- Volume split: Out of 141 listed, volume rose in 72 while falling in 69. This even split hints at selective buying, magnified by ETF and speculative flows.
- Institutional investors made up 63.12% of volume and an overwhelming 84.81% of value traded; retail participation was more dispersed (61.70% of trades, but just 15.19% by value).
Top Gainers & Losers
| Stock | % Change | Current Value | RSI | Key Insight |
|---|---|---|---|---|
| NEWGOLD ETF | +13.21% | 59,999.98 | 43.8 | ETF strength with muted RSI; signs of tactical flows, not euphoria |
| SIAMLETF40 | +10.00% | 1,262.80 | 82.55 | Overbought (RSI>80) – potential for near-term reversal |
| ALEX | +9.72% | 13.55 | 99.43 | Exceptionally overbought, MACD still positive; ripe for profit-taking |
| INTENEGINS | +9.69% | 2.49 | 38.41 | Fresh momentum, but not overbought |
| MECURE | +9.64% | 60.3 | 98.03 | Heavily overbought; likely short-term peak approaching |
| Loser | % Change | Current Value | RSI | Key Insight |
| ABCTRANS | -10.00% | 3.15 | 54.75 | Pullback, RSI neutral, high volume |
| CUSTODIAN | -10.00% | 35.1 | 50.46 | Heavy sell-off with high volume, not oversold |
| STANBICETF30 | -10.00% | 900.0 | 48.68 | ETF under pressure, moderate RSI |
| PRESTIGE | -7.41% | 1.5 | 52.01 | Insurance sector weakness, not technically oversold |
| GUINEAINS | -7.38% | 1.13 | 53.11 | Gradual slide continues, neutral RSI |
Insights & Actionable Predictions
- Turnover Dip: The -10.41% fall in traded value, alongside strong breadth, signals rotation into less liquid, smaller-cap names and ETFs. With institutional trades still dominating value, expect professional investors to quietly rebalance into year-end, while retail chases price action.
-
Volume Surges & Unusual Trading:
- CUSTODIAN saw a +558.7% surge in volume vs 90-day average, coinciding with a -10% price drop and 15-day moving average breakdown: this is classic distribution—likely institutional selling, not just retail panic.
- TANTALIZER (+283% vol), CHAMPION (+282% vol), and ABCTRANS (+11% drop on heavy turnover) point to speculative action and "capitulation" in some retail favorites.
- Bullish Momentum Standouts: NEWGOLD and INTENEGINS closed above their 15DMA, with positive price trends and no sign of technical exhaustion. PRESCO offers a defensive angle—recent 15DMA cross with modest RSI—attracting dividends-oriented buyers in Crop Production sector.
-
Bearish Momentum Hotspots:
- CUSTODIAN (RSI 50.46, MACD negative, breakdown below 15DMA): further downside likely, maintain caution.
- GUINEAINS, ABCTRANS, UBA, and NEM also triggered bearish 15DMA breakdown signals; all on sliding momentum, but none yet at oversold RSI.
-
YTD Trends:
- Bullish continuity: The best 5-day gainers like ALEX (+32.2% in 5 days, RSI 99.4) and MECURE (+19.6%, RSI 98) have massively outperformed YTD, but both are now at risk of technical mean reversion.
- Losers overlap: CUSTODIAN appears in both top daily/weekly and YTD losers, indicating underlying structural weakness perhaps from sectoral or company-specific fundamental issues.
Contrarian Signals
- CHAMPION (CHAMPION BREW. PLC.) – Despite a healthy RSI of 54.4 and bullish MACD, stock remains down -9.8% YTD, and +15.9% in 5D with +282% surge in volume. Momentum is rising, but fundamentals may not have turned—candidates for short-term reversal trades.
- SIAMLETF40 – Gained +10% today, buoyed by strong flows, but RSI is hovering around 82.5 (deeply overbought)—watch for abrupt reversal or profit-taking.
- CUSTODIAN – Heavily sold, high volume, but RSI neutral at 50.5—suggests room for further decline, but could attract mean-reversion buyers soon.
Sector Performance Heatmap
| Sector | Top Mover | % Change | Retail vs Institutional Focus | Technical Trend |
|---|---|---|---|---|
| ETF | NEWGOLD, SIAMLETF40 | +13.2% | Both heavy institutional flows, opportunistic moves | Extremely overbought (SIAMLETF40), short-term traders alert |
| Insurance | INTENEGINS, SUNUASSUR, NEM | +9.69% / -3.95% | Mixed – retail active | Bullish cross (INTENEGINS), Bearish momentum (GUINEAINS, NEM) |
| Diversified Industries | CUSTODIAN | -10.0% | Institutional exit, volatility spike | Bearish: heavy volume + 15DMA breakdown |
| Crop Production | PRESCO | +1.38% | Defensive, institutional | Bullish trend, 15DMA cross |
| Beverages/Brewers | CHAMPION | +15.91% | Retail-led, high volume | Bullish MACD, neutral RSI |
| Banking | FIRSTHOLDCO (Inst), UBA, ZENITHBANK | +2.33% | Institutional (ZENITHBANK high), retail (UBA, GTCO) | ZENITHBANK neutral, UBA bearish crossover |
Dividend Yield vs. Beta (Defensive Stock Matrix)
| Stock | Dividend Yield | Beta | Implication |
|---|---|---|---|
| PRESCO | 0.44% | 0.31 | Defensive with momentum; potential flight-to-safety trade |
| INTENEGINS | 3.40% | 0.01 | High-yield, near-zero risk; value trade candidate |
| UPDCREIT | 10.87% | -0.11 | Yield play but on bearish momentum, risk of further selloff |
| AFRIPRUD (Reference) | 1.27% | 0.64 | Historically defensive, watch for price stability |
- Implication: Stocks with high dividend yields and low beta, e.g., INTENEGINS, offer safe harbor for risk-averse investors, especially when coupled with bullish technical trends. However, a yield like UPDCREIT's 10.87% on a bearish signal may attract "yield traps"—caution advised as price can continue eroding yield gains.
Institutional Clustering Alerts
- ZENITHBANK: 20.17% of institutional trade value share today, a clear signal of sustained institutional positioning and likely "smart money" anchoring support.
- FIRSTHOLDCO: 9.51% of institutional value, momentum-driven, supports sector leadership in banking. However, watch for diminishing marginal inflows as trading volumes plateau.
- CUSTODIAN: Massive institutional distribution evidenced by outsized volume and sharp price drop. Short-term floor may not be in yet.
High Dividend Stocks in Bullish/Bearish Triggers
- PRESCO (Bullish cross above 15DMA, yield 0.44%, beta 0.31) – attracts conservative investors looking for stability blended with trend-following.
- UPDCREIT (Yield 10.87%, bearish cross-below 15DMA) – a "yield trap" risk: high yield but technically weak, use trailing stops if invested for income.
Next Steps & Trader Suggestions
- Momentum traders: Focus on stocks closing above their 15DMA (NEWGOLD, INTENEGINS, PRESCO), but take profit in names with ultra-high RSI (ALEX, MECURE).
- Contrarians: Watch for reversal cues in recent high-volume losers (CUSTODIAN, ABCTRANS); mean-reversion bounce may emerge once volume normalizes.
- Long-term/defensive investors: Monitor high dividend, low beta stocks with improving technicals—add on retracements, avoid "yield traps" until technicals stabilize.
- Banks: Institutional interest in ZENITHBANK, FIRSTHOLDCO offers anchor points, while retail crowding in UBA and GTCO may exacerbate swings.
Previous Week Recap
Last week saw continued YTD strength with the ASI consolidating gains around multi-decade highs. Momentum started shifting to ETFs and select consumer and insurance names, while banking and diversified industries experienced sector rotation and profit-taking. Technical charts reflected several overbought conditions, foreshadowing this week's rebalancing and volatility spikes. The end-of-year reconstitution and "window dressing” are influencing institutional and retail positioning alike.
Trade Activity & Market Participation Deep-Dive
- Institutional vs Retail: Institutions accounted for 38.30% of trades but a dominant 63.12% of market volume and a massive 84.81% of trade value, underlining their influence in price formation (especially in banking and ETF names). Retail made up 61.70% of trades yet only 15.19% of value, indicating smaller ticket size and speculative short-term strategies.
-
Top 5 Institutional Trades:
- FIRSTHOLDCO (banking, 9.51% share): Sector momentum; supported by both technicals and flows.
- ZENITHBANK (banking, 6.92%): Institutional "safe haven", presence high despite flat action.
- ARADEL (oil, 19.2% volume): Specialty block trade, liquidity event likely.
- ACCESSCORP (finance): Balanced, traded by both segments, slightly weakening.
- WAPCO (building materials): Institutional flows, but less price action.
-
Top 5 Retail Trades:
- MTNN: Retail-focused, almost zero price movement, signs of crowding.
- GTCO: Large number of trades, sideways price action.
- ACCESSCORP: Significant, but trailing, mirroring institutional exits.
- ZENITHBANK: Balanced trading, retail less active than institutions suggesting price support.
- UBA: High retail volume, coinciding with bearish 15DMA cross.
-
Correlations & Discoverable Patterns:
- CUSTODIAN's institutional-driven sell-off on heavy volume aligns with its appearance across daily and YTD losers, a warning for late dip-buyers.
- Overlap in ZENITHBANK and FIRSTHOLDCO between both trade types but with value skewed institutional suggests these will be key "sentiment barometers” into year-end.
- For retail, names with higher relative trade count but flat price movement likely signal "wait and see” attitudes (e.g. MTNN), while sharp volume spikes with downside (e.g., CUSTODIAN, ABCTRANS) betray riskier bets or stop-loss runs.
Technical Crossovers Snapshot
| Stock | 15DMA | 50DMA | Sparkline* | Trend |
|---|---|---|---|---|
| NEWGOLD | 56,712 | 55,825 | ↗↗↗ | Bullish cross |
| SIAMLETF40 | 917.6 | 645.9 | ↗↗↗ | Bullish cross |
| CUSTODIAN | 38.09 | 39.93 | ↘↘↘ | Bearish break below |
| TANTALIZER | 2.37 | 2.34 | ⇔ | Flat/Choppy |
Summary Key Takeaways
- Momentum is rotating into high-beta, speculative names and ETFs, but overbought signals are flashing: disciplined profit-taking advised.
- Institutional clustering in banks remains a safe haven; retail optimism is apparent but more fragmented.
- Defensive dividend stocks with positive technicals are emerging as low-risk, yield-plus-momentum opportunities.
- Avoid equities with high dividend but confirmed bearish breakdowns—they risk further capital loss despite attractive yields.
|
Top ASI Gainers Over Last 5 Trading Days
|
Top ASI Losers Over Last 5 Trading Days
|
For more detailed analysis, on InfoWARE Market Data Terminal <NSEPERF> <GO>
On InfoWARE Finance Mobile App (Android, iPhone & iPad, Windows Phone and Windows 8/10), "Top Gainers & Losers"
NEWGOLD EXCHANGE TRADED FUND (ETF) (NEWGOLD) topped the advancers list closing at N59,999.98 with a gain of 13.21% followed by THE SIAML PENSION ETF 40 (SIAMLETF40) which closed at N1,262.80 with a gain of 10.00%.
On the flip side ASSOCIATED BUS COMPANY PLC (ABCTRANS) and CUSTODIAN AND ALLIED PLC (CUSTODIAN) topped the decliners log with a loss of -10.00% at a close of N3.15, and -10.00% to close the day at N35.10 respectively.
| Symbol | LClose | %Chg |
|---|---|---|
| NEWGOLD | 59,999.98 | 13.21 |
| SIAMLETF40 | 1,262.80 | 10.00 |
| ALEX | 13.55 | 9.72 |
| INTENEGINS | 2.49 | 9.69 |
| MECURE | 60.30 | 9.64 |
| Symbol | LClose | %Chg |
|---|---|---|
| ABCTRANS | 3.15 | -10.00 |
| CUSTODIAN | 35.10 | -10.00 |
| STANBICETF30 | 900.00 | -10.00 |
| PRESTIGE | 1.50 | -7.41 |
| GUINEAINS | 1.13 | -7.38 |
For more detailed analysis,
- On InfoWARE Market Data Terminal <TOPG> <GO>
- On InfoWARE Finance Mobile App ( Android, iPhone & iPad and Windows 10) , "Top Gainers & Losers"
Currency Market
In the currency market, the Naira fell 0.31%(-4.54) against the Dollar to settle at 1 to 1Investment Insights - Top 5 Gainers YTD
These stocks are the best performers whose price has risen faster than the market as a whole with the best returns year to date. Momentum investors believe that stocks that have outperformed the market will often continue to do so because the factors that caused them to outperform will not suddenly disappear. In addition, other investors seeking to benefit from the stock’s outperformance will often purchase the stock, further bidding its price higher and pushing the stock higher still

For more detailed analysis,
- On InfoWARE Market Data Terminal <T5YTD2> <GO>
- On InfoWARE Finance Mobile App ( Android , iPhone & iPad and Windows 10) , "Research"
NSE: Bull Signal - Price crossed above 15 Day MA
This signal implies these stocks are under buying pressure and the price might continue to rise and therefore positions should be monitored closely. Further suggested analysis include looking at the overall market (ASI) to see if the uptrend is market wide, sector wide or specific to the stock. Portfolio managers tend to use this as a signal to do more research to add to their positions or lock in some profits. Typically further analysis should be done using commands like PC and RV on the InfoWARE Market Data Terminal. Another command is ALERTS to set price triggers for possible exit or entry as necessary
For more detailed analysis,
- On InfoWARE Market Data Terminal <NSEPERF> <GO>
- On InfoWARE Finance Mobile App ( Android , iPhone & iPad and Windows 10) , "Top Gainers & Losers"
| Symbol | Price | %Chg | 15DMA | PE | EPS | DivY | MktCap | Vol | Trades | Value | LstTradeTime |
|---|---|---|---|---|---|---|---|---|---|---|---|
| NEWGOLD | 59,999.98 | 11.67 | 56,712.59 | 0.00 | 0.00 | 0.00 | 0.00 | 1.00 | 1.00 | 60.00K | 22-Dec-2025 14:30:24.190 |
| INTENEGINS | 2.49 | 8.84 | 2.40 | 0.52 | 2.85 | 3.40 | 3.20B | 275.10K | 30.00 | 659.95K | 22-Dec-2025 14:30:09.997 |
| ROYALEX | 1.94 | 8.76 | 1.87 | 0.00 | 0.00 | 7.81 | 9.98B | 7.77M | 107.00 | 15.06M | 22-Dec-2025 14:30:10.660 |
| FGS202884 | 100.00 | 7.37 | 93.12 | 0.00 | 0.00 | 1.50K | 1.00 | 1.50M | 22-Dec-2025 14:30:13.310 | ||
| VSPBONDETF | 215.00 | 2.33 | 212.37 | 0.00 | 0.00 | 3.40K | 16.00 | 602.62K | 22-Dec-2025 14:30:24.247 | ||
| PRESCO | 1,450.00 | 1.38 | 1,448.67 | 169.69 | 2.65 | 0.44 | 1,450.00B | 279.65K | 495.00 | 405.17M | 22-Dec-2025 14:30:10.567 |
| EUNISELL | 80.00 | 0.00 | 79.97 | 0.00 | 0.00 | 0.31 | 18.94B | 109.73K | 85.00 | 8.51M | 22-Dec-2025 14:30:09.700 |
NSE: BEAR Signal - Price crossed below 15 Day MA
This signal implies these stocks are under selling pressure and the price might continue to slide and therefore positions should be monitored closely. Further suggested analysis include looking at the overall market (ASI) to see if the downtrend is market wide, sector wide or specific to the stock. If the overal market trend is upwards, then since these stocks are heading in the opposite direction, then further analysis should be done using commands like PC and RV on the InfoWARE Market Data Terminal. Another command is ALERTS to set price triggers for possible exit is necessar
For more detailed analysis,
- On InfoWARE Market Data Terminal <BEARM> <GO>
- On InfoWARE Finance Mobile App ( Android , iPhone & iPad and Windows 10)
| Symbol | Price | %Chg | 15DMA | PE | EPS | DivY | MktCap | Vol | Trades | Value | LstTradeTime |
|---|---|---|---|---|---|---|---|---|---|---|---|
| UPDCREIT | 6.90 | -0.72 | 6.91 | 9.09 | 0.57 | 10.87 | 18.41B | 3.13M | 265.00 | 21.65M | 22-Dec-2025 14:30:17.040 |
| NGXMERIVAL | 12,795.53 | -0.81 | 12,805.88 | 12.13 | 38.38 | 0.00 | 0.00 | 78.86M | 7,721.00 | 3.88B | 22-Dec-2025 14:30:13.783 |
| UBA | 39.00 | -2.56 | 39.92 | 8.29 | 4.05 | 5.96 | 1,333.78B | 10.19M | 1,211.00 | 403.78M | 22-Dec-2025 14:30:24.320 |
| NEM | 25.30 | -3.95 | 25.91 | 24.99 | 0.37 | 6.52 | 126.92B | 5.83M | 195.00 | 139.59M | 22-Dec-2025 14:30:10.313 |
| ELLAHLAKES | 13.05 | -6.90 | 13.41 | 0.00 | 0.00 | 0.00 | 26.10B | 14.22M | 930.00 | 189.51M | 22-Dec-2025 14:30:24.040 |
| GUINEAINS | 1.13 | -7.96 | 1.17 | 66.79 | 0.01 | 1.96 | 6.94B | 1.57M | 65.00 | 1.84M | 22-Dec-2025 14:30:09.853 |
| ABCTRANS | 3.15 | -11.11 | 3.23 | 6.68 | 0.17 | 2.19 | 7.54B | 1.35M | 163.00 | 4.59M | 22-Dec-2025 14:30:08.260 |
| CUSTODIAN | 35.10 | -11.11 | 38.09 | 3.80 | 3.29 | 1.20 | 206.45B | 22.10M | 161.00 | 857.83M | 22-Dec-2025 14:30:09.460 |
Market Trend - ASI (NGX All-Share-Index) With 50 & 200 Day MAvgs Chart
Technical traders typically use the 50 & 200 day moving averages to aid in choosing
where to enter or exit a position, which then causes these levels to act as strong
support or resistance. As a general guideline, if the price is above a moving average,
the trend is up. If the price is below a moving average, the trend is down.
It is important to note that critics of technical analysis say that moving averages act
as support and resistance because so many traders use these indicators to inform their
trading decisions. Also moving averages tend to work quite well in strong trending conditions
but poorly in choppy or ranging conditions.
Trading Strategies: Crossovers
Crossovers are one of the main moving average strategies. The first type is a price crossover,
which is when the price crosses above or below a moving average to signal a potential change
in trend. Another strategy is to apply two moving averages to a chart: one longer and one
shorter. When the shorter-term MA crosses above the longer-term MA, it is a buy signal, as
it indicates that the trend is shifting up. This is known as a golden cross. Meanwhile, when
the shorter-term MA crosses below the longer-term MA, it is a sell signal, as it indicates that
the trend is shifting down. This is known as a dead/death cross

For more detailed analysis,
- On InfoWARE Market Data Terminal <CI> <GO>
- On InfoWARE Finance Mobile App ( Android , iPhone & iPad and Windows 10) , "Research"
Unusual Volume: Volume traded is more than double the 90 day moving average (All exchanges; ASI & ASem). For more detailed analysis,
- On InfoWARE Market Data Terminal <UV> <GO>
- On InfoWARE Finance Mobile App ( Android , iPhone & iPad and Windows 10)
| Symbol | Name | Volume | 90DAvgVol | %VolChg | Price | LClose | %Chg | Trades | Value |
|---|---|---|---|---|---|---|---|---|---|
| TANTALIZER | TANTALIZERS PLC | 50.18M | 13.08M | 283.61 | 2.58 | 2.69 | -4.09 | 494 | 127.47M |
| CUSTODIAN | CUSTODIAN AND ALLIED PLC | 22.10M | 3.35M | 558.74 | 35.10 | 39.00 | -10.00 | 161 | 857.83M |
| NSLTECH | SECURE ELECTRONIC TECHNOLOGY PLC | 14.82M | 5.68M | 161.12 | 0.78 | 0.78 | 0.00 | 87 | 11.55M |
| CHAMPION | CHAMPION BREW. PLC. | 14.03M | 3.67M | 282.34 | 16.75 | 16.95 | -1.18 | 239 | 233.69M |
| MBENEFIT | MUTUAL BENEFITS ASSURANCE PLC. | 13.54M | 6.28M | 115.79 | 3.10 | 3.18 | -2.52 | 220 | 43.35M |
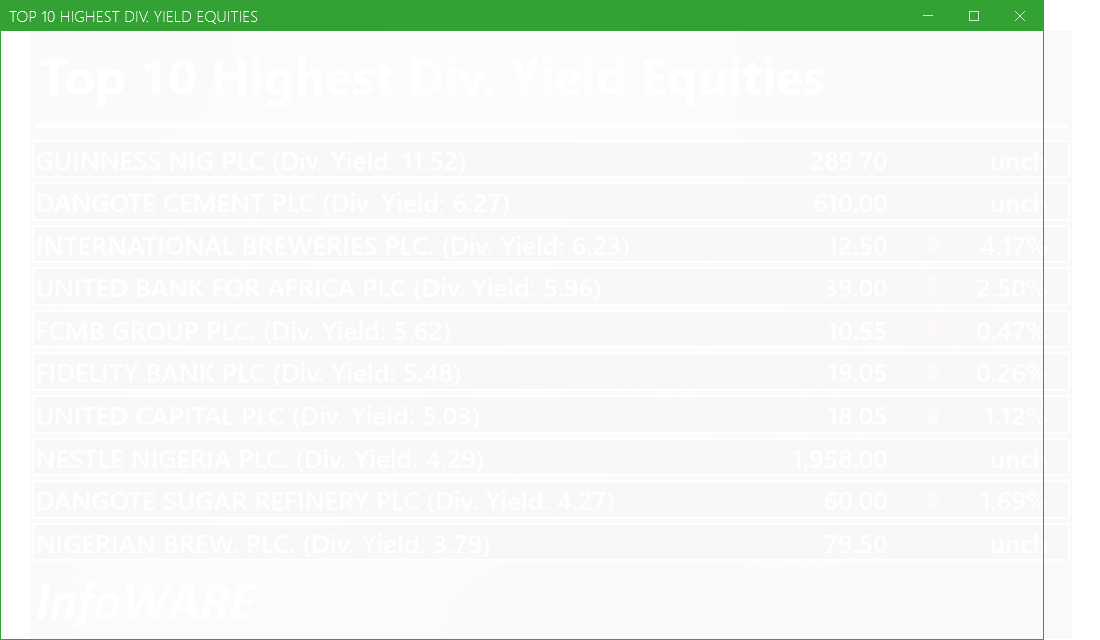
Investment Insights - High Div. Stocks
Dividend stocks distribute a portion of the company earnings to investors on a regular basis and they can a great choice for investors looking for regular income. As an investment or trading strategy, high dividend yield equities provide annual cash payments as against mostly capital gains in the price of a stock. The list in the table below represent the highest dividend paying stocks from the list of the most liquid stocks in the NSE top 30.
For more detailed analysis,
- On InfoWARE Market Data Terminal <HYIELD> <GO>
- On InfoWARE Finance Mobile App ( Android , iPhone & iPad and Windows 10) , "Research"
Investment Insights - Stocks outperforming the ASI but with approximately the same risk
These list of stocks represent equities that are less risky than the ASI but doing better than the ASI (All Shares Index) using the YTD (Year to Date) returns as the measure. The risk is measured by Beta. Beta is an assessment of a stock's tendency to undergo price changes, (its volatility), as well as its potential returns compared to the ASI. It is expressed as a ratio, where a score of 1 represents performance comparable to the ASI, and returns above or below the market may receive scores greater or lower than 1.
For a full list of both positively and negatively corelated stocks visit InfoWARE Market Data Terminal
- On InfoWARE Market Data Terminal <BANL> <GO>
- On InfoWARE Finance Mobile App ( Android , iPhone & iPad and Windows 10)
| Symbol | DivYield | PE | EPS | Beta | %ChgYTD | ASIYTDReturn | BetaDiff |
|---|---|---|---|---|---|---|---|
| HONYFLOUR | 1.40 | 16.28 | 0.31 | 0.99 | 156.50 | 47.76 | 0.01 |
| CAVERTON | 5.52 | 1.15 | 1.57 | 0.98 | 107.84 | 47.76 | 0.02 |
| ROYALEX | 7.81 | 0.00 | 0.00 | 0.96 | 76.36 | 47.76 | 0.04 |
| UNIVINSURE | 0.00 | 0.00 | 0.00 | 0.83 | 61.11 | 47.76 | 0.17 |
| FTNCOCOA | 1.60 | 0.00 | 0.00 | 0.79 | 149.47 | 47.76 | 0.21 |
| NB | 3.79 | 16.95 | 1.60 | 0.79 | 148.44 | 47.76 | 0.21 |
| MAYBAKER | 3.75 | 58.94 | 0.14 | 0.78 | 89.36 | 47.76 | 0.22 |
| UNILEVER | 2.81 | 67.09 | 0.40 | 0.75 | 100.00 | 47.76 | 0.25 |
| VETGOODS | 0.00 | 0.71 | 101.16 | 47.76 | 0.29 | ||
| VETGRIF30 | 0.00 | 0.71 | 58.15 | 47.76 | 0.29 |
African Markets
| Name | LClose | Change | %Chg |
|---|---|---|---|
| BRVM Stock Exchange | 343.83 | 1.17 | 0.34 |
| Botswana Stock Exchange | 10,961.80 | 43.67 | 0.40 |
| Egyptian Exchange | 40,926.86 | -576.90 | -1.39 |
| Ghana Stock Exchange | 8,755.59 | 9.62 | 0.11 |
| Johannesburg Stock Exchange | 114,849.90 | 332.10 | 0.29 |
| Lusaka Stock Exchange | 25,422.37 | -176.63 | -0.69 |
| Casablanca Stock Exchange | 18,938.30 | 122.30 | 0.65 |
| Malawi Stock Exchange | 607,938.06 | 0.00 | 0.00 |
| Nigeria Stock Exchange | 152,057.38 | 1,699.05 | 1.13 |
| Nairobi Securities Exchange | 184.55 | 0.72 | 0.39 |
| Namibian Stock Exchange | 2,094.37 | 0.63 | 0.03 |
| Rwanda Stock Exchange | 181.75 | 0.00 | 0.00 |
| Tunis Stock Exchange | 13,248.80 | 29.08 | 0.22 |
| Uganda Securities Exchange | 1,568.11 | 9.66 | 0.62 |
Nigeria Market Indexes
| Symbol | LClose | %Chg | WTD% | MTD% | QTD% | YTD% | MktCap | Trades |
|---|---|---|---|---|---|---|---|---|
| ASI | 152,459.07 | 0.26 | 0.00 | 6.46 | 6.63 | 47.76 | 30,544 | |
| NGX30 | 5,560.97 | 0.27 | 0.00 | 6.18 | 6.57 | 45.77 | 17,317 | |
| NGXAFRBVI | 3,168.63 | -0.60 | 0.00 | 1.77 | -10.73 | 27.73 | 6,091 | |
| NGXAFRHDYI | 21,054.63 | -0.02 | 0.00 | 1.32 | -5.42 | 23.65 | 7,264 | |
| NGXASEM | 1,392.88 | 0.00 | 0.00 | 0.00 | -9.44 | -12.05 | 4 | |
| NGXBNK | 1,462.91 | -0.04 | 0.00 | 5.75 | -3.55 | 34.53 | 6,378 | |
| NGXCG | 4,157.26 | -0.05 | 0.00 | 8.30 | 2.63 | 46.94 | 16,098 | |
| NGXCNSMRGDS | 3,745.72 | 0.50 | 0.00 | 10.61 | 10.73 | 115.97 | 4,535 | |
| NGXCOMMDTY | 1,178.57 | 0.14 | 0.00 | -0.25 | 5.06 | 17.85 | ||
| NGXGROWTH | 25,891.85 | 8.29 | 0.00 | 75.13 | 71.79 | 233.53 | 290 | |
| NGXINDUSTR | 5,615.53 | 0.91 | 0.00 | 9.47 | 10.81 | 57.23 | 3,265 | |
| NGXINS | 1,164.61 | -0.54 | 0.00 | 7.46 | -2.63 | 48.13 | 1,978 | |
| NGXLOTUSISLM | 13,442.18 | 0.22 | 0.00 | 5.34 | 13.23 | 92.92 | 7,232 | |
| NGXMAINBOARD | 7,266.76 | 0.39 | 0.00 | 4.03 | 3.15 | 45.22 | 21,732 | |
| NGXMERIGRW | 10,012.19 | 0.19 | 0.00 | 0.49 | 1.10 | 53.48 | 4,339 | |
| NGXMERIVAL | 12,795.53 | -0.80 | 0.00 | 3.90 | -4.28 | 22.68 | 7,721 | |
| NGXOILGAS | 2,675.99 | 0.00 | 0.00 | -0.76 | 5.94 | -1.30 | 533 | |
| NGXPENBRD | 2,863.92 | 0.17 | 0.00 | 6.29 | 8.03 | 56.36 | 25,269 | |
| NGXPENSION | 6,998.11 | 0.01 | 0.00 | 5.69 | 3.86 | 54.35 | 19,330 | |
| NGXPREMIUM | 15,612.30 | -0.03 | 0.00 | 10.84 | 14.03 | 60.41 | 8,522 | |
| NGXSOVBND | 680.95 | 0.00 | 0.00 | 1.11 | 3.60 | 13.20 | 0 |
For more detailed analysis,
- On InfoWARE Market Data Terminal <MKTINS> <GO>
- On InfoWARE Finance Mobile App ( Android, iPhone & iPad and Windows 10) , "Market Indexes"
Find the topic interesting? Will like to comment? Contact Us at solutions@infowarelimited.com
Top News

Chart Of The Day - ASI Chart Vs ASI Advance Decline Line (YTD) (22-Dec-2025 15:07:31.005)
InfoWARE AI Analyst Daily Market Report: 22-Dec-2025

[XNSA]>> DAILY FUND PRICE SUBMISSION - FCMB ASSET MANAGEMENT LIMITED
[XNSA]>> CORDROS MILESTONE FUNDS' BID & OFFER PRICES
[VSPBONDETF]>> DAILY INDICATIVE PRICES
[XNSA]>> INTRODUCTION OF COMMERCIAL PAPER LISTING AND TRADING ON NGX
[SIAMLETF40]>> DAILY INDICATIVE PRICES
[XNSA]>> EXTENSION FOR TRADING IN RIGHTS ISSUE
[XNSA]>> CHAMPION BREWERIES PLC: ACTIVATION OF CODE FOR TRADING IN RIGHTS
Chart Of The Day - ASI Chart Vs ASI Advance Decline Line (YTD) (19-Dec-2025 15:11:10.629)
InfoWARE AI Analyst Daily Market Report: 19-Dec-2025
[XNSA]>> OFF MARKET TRADE
[XNSA]>> OFF MARKET TRADE
[XNSA]>> OFF MARKET TRADE
[SIAMLETF40]>> DAILY INDICATIVE PRICES
[XNSA]>> INTRODUCTION OF COMMERCIAL PAPER LISTING AND TRADING ON NGX
[XNSA]>> EXTENSION FOR TRADING IN RIGHTS ISSUE
[XNSA]>> CHAMPION BREWERIES PLC: ACTIVATION OF CODE FOR TRADING IN RIGHTS
Chart Of The Day - ASI Chart Vs ASI Advance Decline Line (YTD) (18-Dec-2025 15:14:25.375)
InfoWARE Analyst Daily Market Report (18-Dec-2025 15:14:20.446)
[XNSA]>> CORDROS MILESTONE FUNDS' BID & OFFER PRICES
[VSPBONDETF]>> DAILY INDICATIVE PRICES
[LOTUSHAL15]>> DAILY INDICATIVE PRICES
[XNSA]>> INTRODUCTION OF COMMERCIAL PAPER LISTING AND TRADING ON NGX
[XNSA]>> APPOINTMENT OF A DIRECTOR
[XNSA]>> EXTENSION FOR TRADING IN RIGHTS ISSUE
[XNSA]>> CHAMPION BREWERIES PLC: ACTIVATION OF CODE FOR TRADING IN RIGHTS
Chart Of The Day - ASI Chart Vs ASI Advance Decline Line (YTD) (17-Dec-2025 15:08:18.368)
InfoWARE Analyst Daily Market Report (17-Dec-2025 15:08:13.696)
[XNSA]>> CORDROS MILESTONE FUNDS' BID & OFFER PRICES
Get IDIA - the stock trading app for the modern investor
Solutions by Business
Product Suites
Company
Contacts
- 8th Floor,
- South Atlantic Petroleum Towers,
- 1 Adeola Odeku Street,
- Victoria Island,
- Lagos, Nigeria.
- Email: solutions@infowarelimited.com
Follow Us
 |
 |
 |
 |