


InfoWARE AI Analyst Weekly Market Report: 14-Mar-2025 | InfoWARE Finance
Get IDIA - the stock trading app for the modern investor


InfoWARE AI Analyst Weekly Market Report: 14-Mar-2025
(Source: InfoWARE Terminal, Date: 14-Mar-2025)
Dear Investor,
This week, the Nigerian Stock Exchange (NGX) experienced a slight decline, with the All Share Index (ASI) closing at 105,995.32, down -0.59% from the previous week. Despite this downturn, the market showed some resilience with a Year-To-Date (YTD) return of 2.73%. Notably, market turnover surged by 25.20%, indicating increased trading activity, although the number of trade deals decreased by -7.88%. The market breadth ratio stood at 0.87x, reflecting a challenging environment with more decliners than advancers. Overall, the sentiment remains cautious as investors navigate through mixed signals in the market.
Significant Trends in Market Breadth:
- Market breadth ratio of 0.87x indicates more decliners (52) than advancers (45).
- 23.20% of stocks advanced, while 26.80% declined, with 50.00% remaining unchanged.
- Volume traded increased for 141 companies, while 141 saw a decrease.
Highlights of the Top Gainers and Losers:
Top Gainers (Week-To-Date):
- VETIVA S & P NIGERIA SOVEREIGN BOND ETF (VSPBONDETF): +65.69%
- CORNERSTONE INSURANCE COMPANY PLC (CORNERST): +19.86%
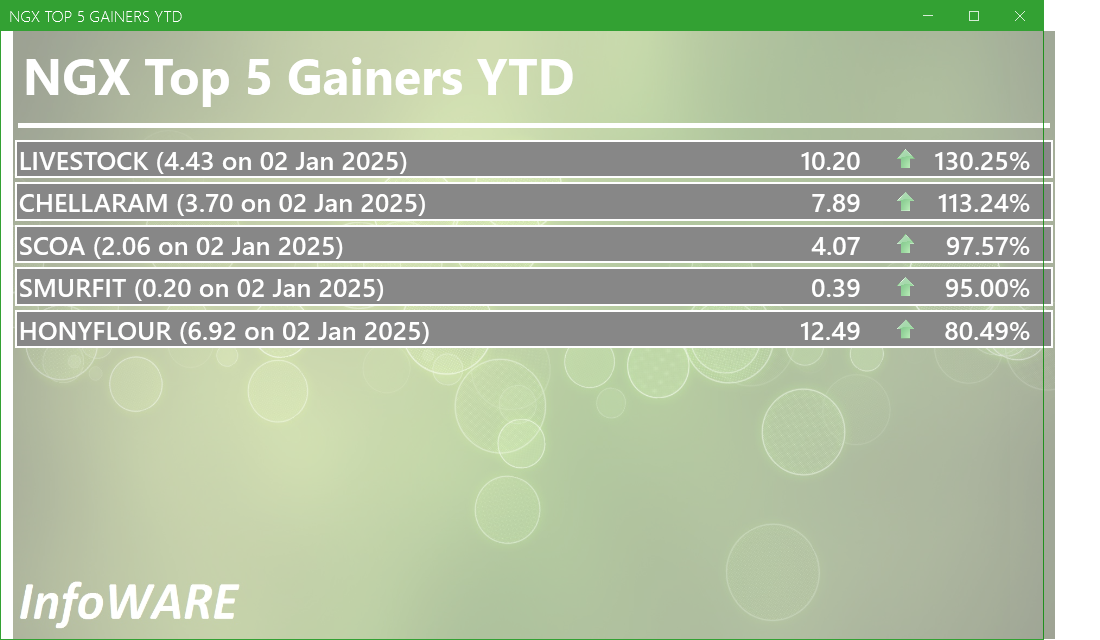
- LIVESTOCK FEEDS PLC (LIVESTOCK): +13.84%
- FTN COCOA PROCESSORS PLC (FTNCOCOA): +9.47%
- NIGERIAN ENAMELWARE PLC (ENAMELWA): +9.05%
Top Losers (Week-To-Date):
- STANBIC IBTC ETF 30 (STANBICETF30): -18.95%
- NEIMETH INTERNATIONAL PHARMACEUTICALS PLC (NEIMETH): -17.00%
- DANGOTE SUGAR REFINERY PLC (DANGSUGAR): -12.38%
- CONOIL PLC (CONOIL): -10.00%
- MECURE INDUSTRIES PLC (MECURE): -10.00%
Insights and Predictions:
- The significant decrease in turnover, despite increased trading volume, suggests a potential shift in investor sentiment, possibly indicating profit-taking or caution ahead of upcoming economic data.
- With 23.20% of stocks advancing and 26.80% declining, the market is showing signs of volatility, which could lead to further fluctuations in the coming weeks.
- Stocks like VSPBONDETF and CORNERST are showing bullish momentum, with RSI values indicating strong buying interest.
- Conversely, stocks like STANBICETF30 and NEIMETH are in bearish territory, with RSI values suggesting oversold conditions.
Index Performance Analysis:
The NGX Insurance Index (NGXINS) was the top performer this week, gaining 1.78%, although it remains down -10.22% YTD. In contrast, the NGX Growth Index (NGXGROWTH) suffered the most, declining -5.71% this week and -4.89% YTD. The overall performance of the indexes indicates a mixed sentiment across sectors.
Comparison of Indexes:
- NGXINS showed resilience with a weekly gain, while NGXGROWTH faced significant losses.
- NGX Consumer Goods Index (NGXCNSMRGDS) also faced a slight decline of -0.20% this week, indicating challenges in the consumer sector.
Dividend Yield Insights:
Stocks with high dividend yields such as NEIMETH and CONOIL are currently in bearish momentum, which may present a buying opportunity for long-term investors looking for income.
Suggestions for Traders:
- Consider taking positions in stocks showing bullish momentum, particularly those with strong RSI and MACD indicators.
- Be cautious with stocks in bearish momentum, especially those with declining volumes and negative MACD signals.
- Monitor the market closely for any shifts in sentiment, particularly in response to economic news or earnings reports.
Year-To-Date (YTD) Gainers and Losers:
| Top YTD Gainers | Top YTD Losers |
|---|---|
| 1. VSPBONDETF | 1. STANBICETF30 |
| 2. CORNERST | 2. NEIMETH |
| 3. LIVESTOCK | 3. DANGSUGAR |
Week-To-Date (WTD) Gainers and Losers:
| Top WTD Gainers | Top WTD Losers |
|---|---|
| 1. VSPBONDETF | 1. STANBICETF30 |
| 2. CORNERST | 2. NEIMETH |
| 3. LIVESTOCK | 3. DANGSUGAR |
Market Activity Summary:
Retail investors accounted for 89.90% of trade count but only 15.27% of total volume, indicating a preference for smaller trades. In contrast, institutional investors dominated the volume with 84.73% of total volume traded.
Top 5 Most Traded Stocks:
Institutional Investors:
- 1. ARADEL
- 2. ZENITHBANK
- 3. ACCESSCORP
- 4. UBA
- 5. FIDELITYBK
Retail Investors:
- 1. ACCESSCORP
- 2. OANDO
- 3. ZENITHBANK
- 4. ARADEL
- 5. TANTALIZER
|
Top ASI Gainers Over Last 5 Trading Days
|
Top ASI Losers Over Last 5 Trading Days
|
For more detailed analysis, on InfoWARE Market Data Terminal <NSEPERF> <GO>
On InfoWARE Finance Mobile App (Android, iPhone & iPad, Windows Phone and Windows 8/10), "Top Gainers & Losers"
VETIVA S & P NIGERIA SOVEREIGN BOND ETF (VSPBONDETF) topped the advancers list closing at N310.00 with a gain of 65.69% followed by ROYAL EXCHANGE PLC. (ROYALEX) which closed at N0.88 with a gain of 10.00%.
On the flip side NEWGOLD EXCHANGE TRADED FUND (ETF) (NEWGOLD) and LOTUS HALAL EQUITY ETF (LOTUSHAL15) topped the decliners log with a loss of -17.71% at a close of N39,500.01, and -9.97% to close the day at N32.40 respectively.
| Symbol | LClose | %Chg |
|---|---|---|
| VSPBONDETF | 310.00 | 65.69 |
| ROYALEX | 0.88 | 10.00 |
| LINKASSURE | 1.26 | 9.57 |
| GUINEAINS | 0.69 | 9.52 |
| ENAMELWA | 25.30 | 9.05 |
| Symbol | LClose | %Chg |
|---|---|---|
| NEWGOLD | 39,500.01 | -17.71 |
| LOTUSHAL15 | 32.40 | -9.97 |
| TANTALIZER | 2.93 | -9.85 |
| JAIZBANK | 3.25 | -9.72 |
| NEIMETH | 2.49 | -9.45 |
For more detailed analysis,
- On InfoWARE Market Data Terminal <TOPG> <GO>
- On InfoWARE Finance Mobile App ( Android, iPhone & iPad and Windows 10) , "Top Gainers & Losers"
Currency Market
In the currency market, the Naira fell 0.13%(-2.05) against the Dollar to settle at 1 to 1Investment Insights - Top 5 Gainers YTD
These stocks are the best performers whose price has risen faster than the market as a whole with the best returns year to date. Momentum investors believe that stocks that have outperformed the market will often continue to do so because the factors that caused them to outperform will not suddenly disappear. In addition, other investors seeking to benefit from the stock’s outperformance will often purchase the stock, further bidding its price higher and pushing the stock higher still
For more detailed analysis,
- On InfoWARE Market Data Terminal <T5YTD2> <GO>
- On InfoWARE Finance Mobile App ( Android , iPhone & iPad and Windows 10) , "Research"
NSE: Bull Signal - Price crossed above 15 Day MA
This signal implies these stocks are under buying pressure and the price might continue to rise and therefore positions should be monitored closely. Further suggested analysis include looking at the overall market (ASI) to see if the uptrend is market wide, sector wide or specific to the stock. Portfolio managers tend to use this as a signal to do more research to add to their positions or lock in some profits. Typically further analysis should be done using commands like PC and RV on the InfoWARE Market Data Terminal. Another command is ALERTS to set price triggers for possible exit or entry as necessary
For more detailed analysis,
- On InfoWARE Market Data Terminal <NSEPERF> <GO>
- On InfoWARE Finance Mobile App ( Android , iPhone & iPad and Windows 10) , "Top Gainers & Losers"
| Symbol | Price | %Chg | 15DMA | PE | EPS | DivY | MktCap | Vol | Trades | Value | LstTradeTime |
|---|---|---|---|---|---|---|---|---|---|---|---|
| VSPBONDETF | 310.00 | 39.65 | 216.04 | 0.00 | 0.00 | 1.00 | 1.00 | 310.00 | 14-Mar-2025 14:31:13.600 | ||
| FGSUK2033S6 | 100.00 | 11.00 | 94.80 | 0.00 | 0.00 | 1.00 | 1.00 | 1.00K | 14-Mar-2025 14:30:38.210 | ||
| ROYALEX | 0.88 | 9.09 | 0.81 | 0.00 | 0.00 | 7.81 | 4.53B | 2.45M | 64.00 | 2.15M | 14-Mar-2025 14:31:12.347 |
| GUINEAINS | 0.69 | 8.70 | 0.68 | 66.79 | 0.01 | 1.96 | 4.24B | 3.17M | 51.00 | 2.18M | 14-Mar-2025 14:30:25.957 |
| UPDCREIT | 6.50 | 7.69 | 6.14 | 9.09 | 0.57 | 10.87 | 17.34B | 871.43K | 41.00 | 5.54M | 14-Mar-2025 14:30:45.540 |
| CHAMPION | 4.00 | 3.75 | 3.97 | 412.83 | 0.01 | 0.41 | 31.32B | 350.37M | 34.00 | 1.40B | 14-Mar-2025 14:30:23.117 |
| UPDC | 2.80 | 1.07 | 2.78 | 0.00 | 0.00 | 34.25 | 51.97B | 3.07M | 127.00 | 8.65M | 14-Mar-2025 14:30:29.170 |
| GTCO | 61.00 | 0.82 | 60.50 | 7.49 | 7.10 | 1.88 | 1,795.30B | 16.88M | 246.00 | 1.03B | 14-Mar-2025 14:30:25.923 |
| CHAMS | 2.15 | 0.47 | 2.13 | 27.02 | 0.07 | 1.56 | 10.10B | 8.36M | 101.00 | 17.51M | 14-Mar-2025 14:30:23.187 |
| STERLINGNG | 5.40 | 0.37 | 5.39 | 15.75 | 0.30 | 3.19 | 155.47B | 6.86M | 123.00 | 36.86M | 14-Mar-2025 14:30:28.403 |
NSE: BEAR Signal - Price crossed below 15 Day MA
This signal implies these stocks are under selling pressure and the price might continue to slide and therefore positions should be monitored closely. Further suggested analysis include looking at the overall market (ASI) to see if the downtrend is market wide, sector wide or specific to the stock. If the overal market trend is upwards, then since these stocks are heading in the opposite direction, then further analysis should be done using commands like PC and RV on the InfoWARE Market Data Terminal. Another command is ALERTS to set price triggers for possible exit is necessar
For more detailed analysis,
- On InfoWARE Market Data Terminal <BEARM> <GO>
- On InfoWARE Finance Mobile App ( Android , iPhone & iPad and Windows 10)
| Symbol | Price | %Chg | 15DMA | PE | EPS | DivY | MktCap | Vol | Trades | Value | LstTradeTime |
|---|---|---|---|---|---|---|---|---|---|---|---|
| NGXGROUP | 30.85 | 0.00 | 31.92 | 0.00 | 0.00 | 2.73 | 60.59B | 176.63K | 56.00 | 5.25M | 14-Mar-2025 14:30:27.370 |
| ZENITHBANK | 47.80 | -0.42 | 47.85 | 3.33 | 13.30 | 2.25 | 1,500.75B | 18.56M | 607.00 | 888.68M | 14-Mar-2025 14:31:13.920 |
| NGXCNSMRGDS | 1,808.79 | -1.09 | 1,820.82 | 30.19 | 55.24 | 0.00 | 0.00 | 359.48M | 988.00 | 1.75B | 14-Mar-2025 14:30:40.387 |
| HONYFLOUR | 12.49 | -3.12 | 12.52 | 16.28 | 0.31 | 1.40 | 99.05B | 1.48M | 155.00 | 18.72M | 14-Mar-2025 14:30:26.050 |
| MANSARD | 9.00 | -3.89 | 9.05 | 31.16 | 0.24 | 4.59 | 81.00B | 4.45M | 117.00 | 40.09M | 14-Mar-2025 14:30:26.467 |
| UNILEVER | 37.70 | -6.10 | 39.52 | 67.09 | 0.40 | 2.81 | 216.59B | 305.49K | 45.00 | 11.51M | 14-Mar-2025 14:30:29.060 |
| FGSUK2031S4 | 78.09 | -8.85 | 80.25 | 0.00 | 0.00 | 1.96K | 1.00 | 1.53M | 14-Mar-2025 14:30:38.183 | ||
| JAIZBANK | 3.25 | -10.77 | 3.45 | 83.05 | 0.03 | 1.67 | 112.26B | 15.94M | 230.00 | 56.50M | 14-Mar-2025 14:31:12.257 |
| NEWGOLD | 39,500.01 | -21.52 | 40,906.22 | 0.00 | 0.00 | 0.00 | 0.00 | 22.00 | 5.00 | 886.00K | 14-Mar-2025 14:31:13.340 |
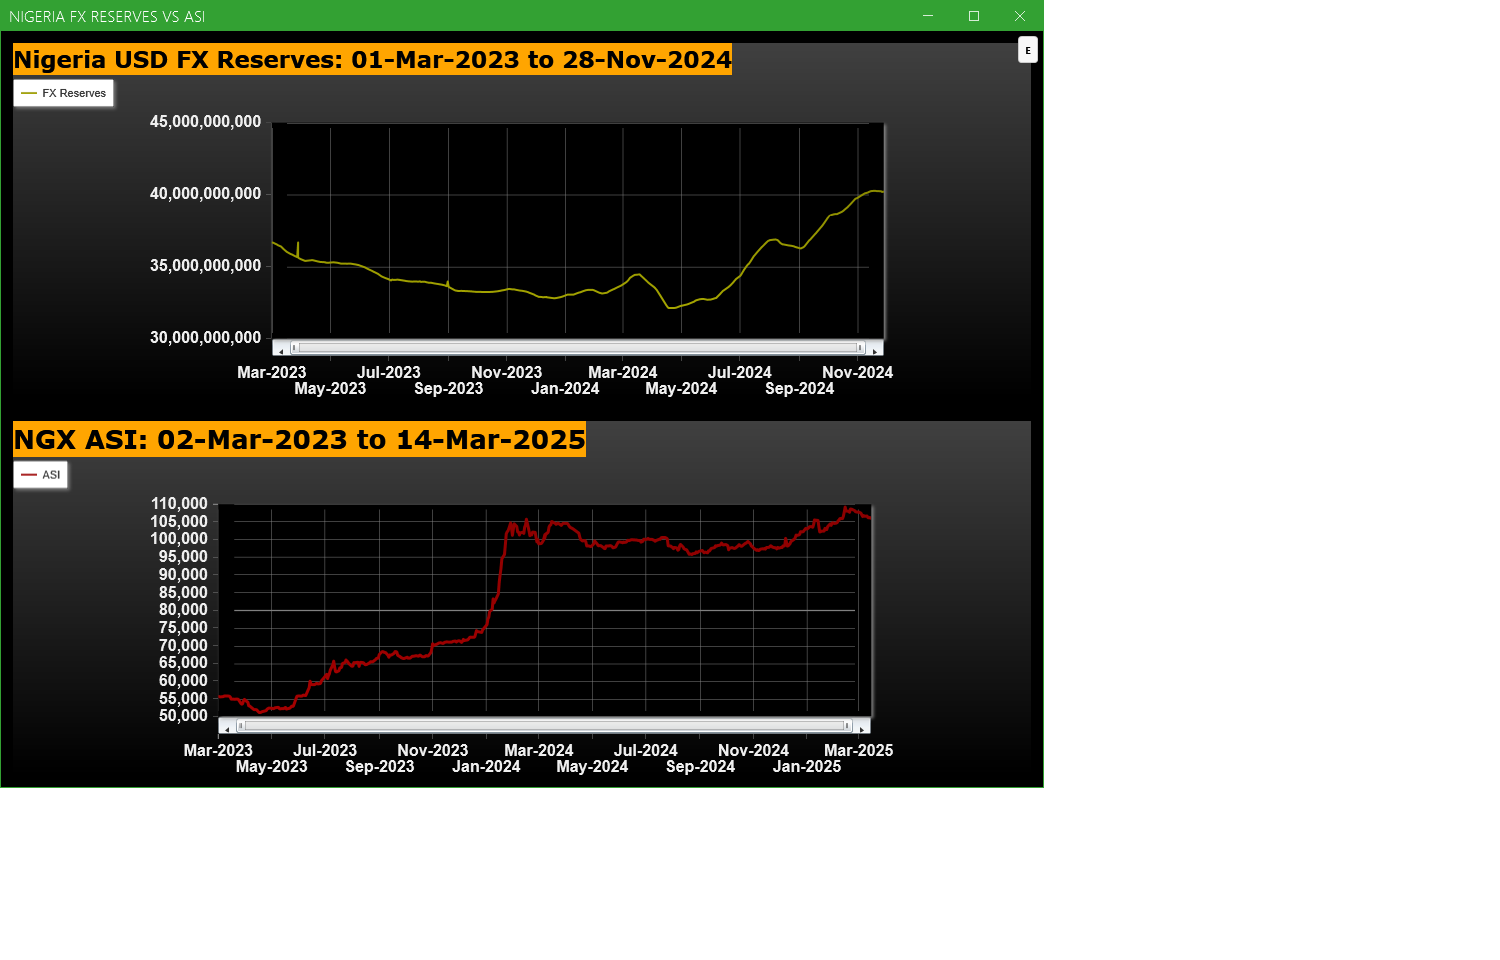
Economic Indicators - Nigeria FX Reserves Vs ASI Chart
Nigeria FX Reserves are assets held on reserve by CBN in foreign currencies. These reserves are used to back liabilities and influence monetary policy. Given the nature of the Nigeria economy, FX Reserves can appear to have an outsize influence on the economy and hence on the capital market. The chart below allows comparison of FX Reserves against the ASI to make investment decisions
For more detailed analysis,
- On InfoWARE Market Data Terminal <CI> <GO>
- On InfoWARE Finance Mobile App ( Android , iPhone & iPad and Windows 10) , "Research"
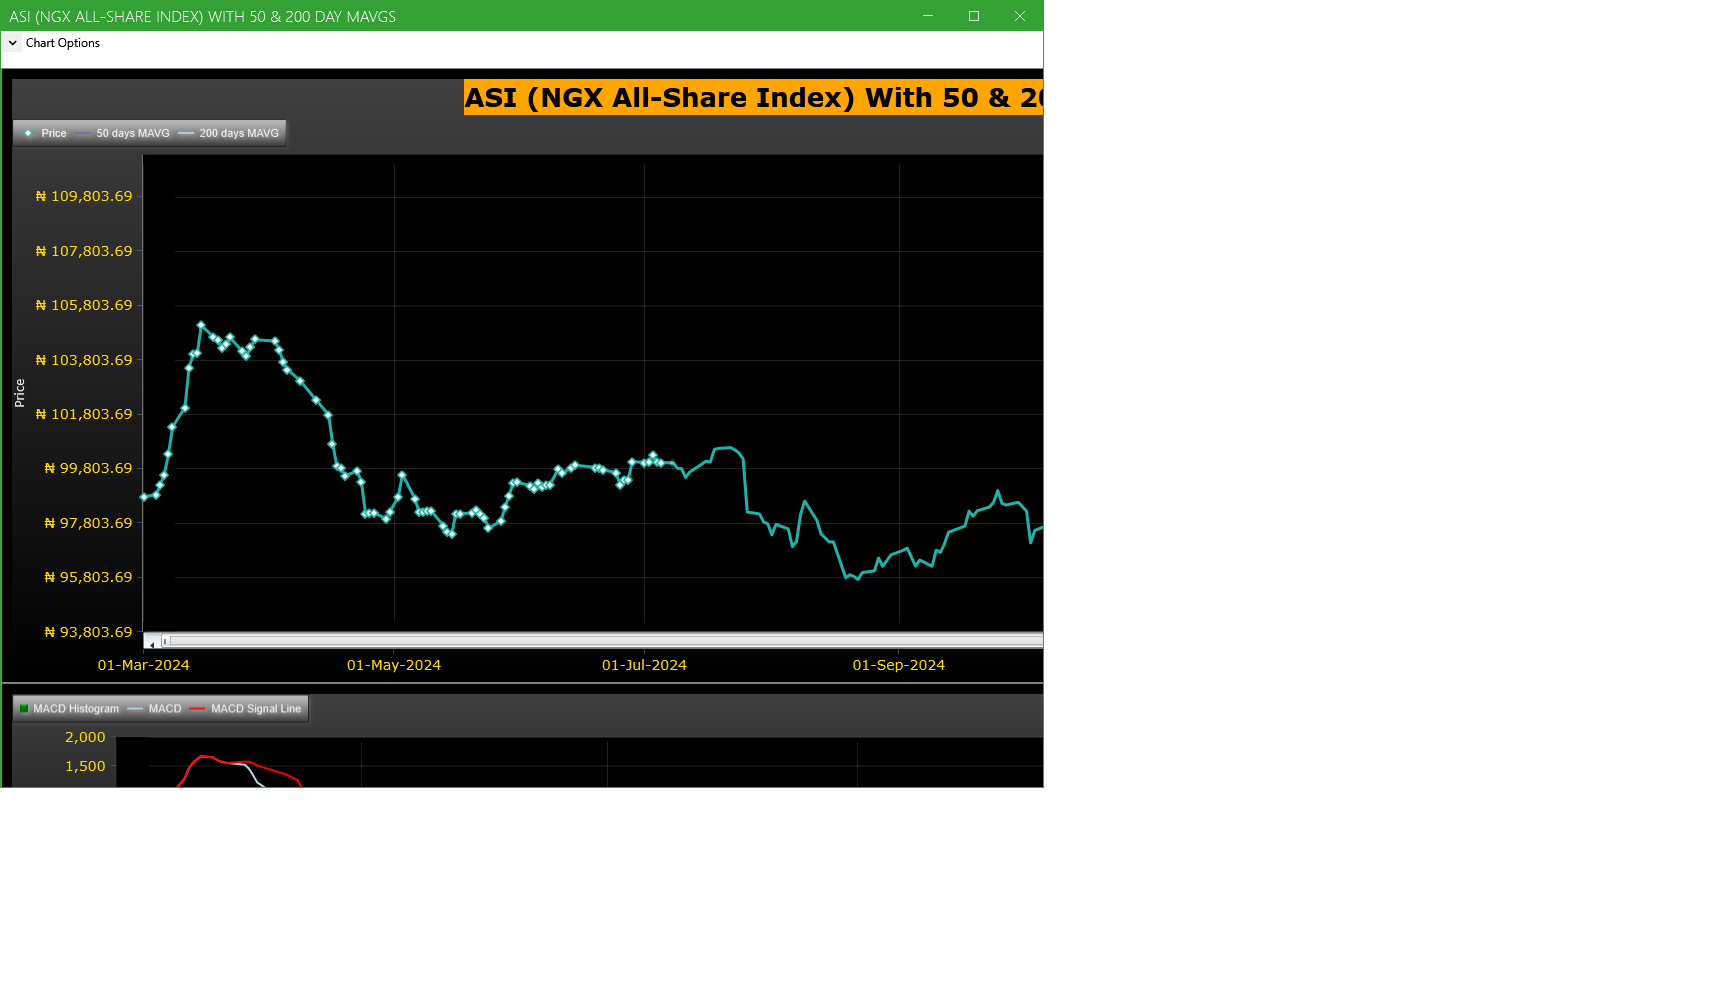
Market Trend - ASI (NGX All-Share-Index) With 50 & 200 Day MAvgs Chart
Technical traders typically use the 50 & 200 day moving averages to aid in choosing
where to enter or exit a position, which then causes these levels to act as strong
support or resistance. As a general guideline, if the price is above a moving average,
the trend is up. If the price is below a moving average, the trend is down.
It is important to note that critics of technical analysis say that moving averages act
as support and resistance because so many traders use these indicators to inform their
trading decisions. Also moving averages tend to work quite well in strong trending conditions
but poorly in choppy or ranging conditions.
Trading Strategies: Crossovers
Crossovers are one of the main moving average strategies. The first type is a price crossover,
which is when the price crosses above or below a moving average to signal a potential change
in trend. Another strategy is to apply two moving averages to a chart: one longer and one
shorter. When the shorter-term MA crosses above the longer-term MA, it is a buy signal, as
it indicates that the trend is shifting up. This is known as a golden cross. Meanwhile, when
the shorter-term MA crosses below the longer-term MA, it is a sell signal, as it indicates that
the trend is shifting down. This is known as a dead/death cross
For more detailed analysis,
- On InfoWARE Market Data Terminal <CI> <GO>
- On InfoWARE Finance Mobile App ( Android , iPhone & iPad and Windows 10) , "Research"
Unusual Volume: Volume traded is more than double the 90 day moving average (All exchanges; ASI & ASem). For more detailed analysis,
- On InfoWARE Market Data Terminal <UV> <GO>
- On InfoWARE Finance Mobile App ( Android , iPhone & iPad and Windows 10)
| Symbol | Name | Volume | 90DAvgVol | %VolChg | Price | LClose | %Chg | Trades | Value |
|---|---|---|---|---|---|---|---|---|---|
| CHAMPION | CHAMPION BREW. PLC. | 350.37M | 743.60K | 47,018.54 | 4.00 | 3.85 | 3.90 | 34 | 1.40B |
| TANTALIZER | TANTALIZERS PLC | 53.07M | 10.73M | 394.45 | 2.93 | 3.25 | -9.85 | 323 | 157.14M |
| CUSTODIAN | CUSTODIAN AND ALLIED PLC | 51.11M | 1.40M | 3,560.13 | 19.60 | 20.15 | -2.73 | 61 | 1.00B |
| LASACO | LASACO ASSURANCE PLC. | 36.50M | 3.82M | 855.60 | 2.68 | 2.85 | -5.96 | 79 | 97.71M |
| MTNN | MTN NIGERIA PLC | 5.17M | 1.85M | 178.70 | 245.00 | 245.00 | 0.00 | 316 | 1.27B |
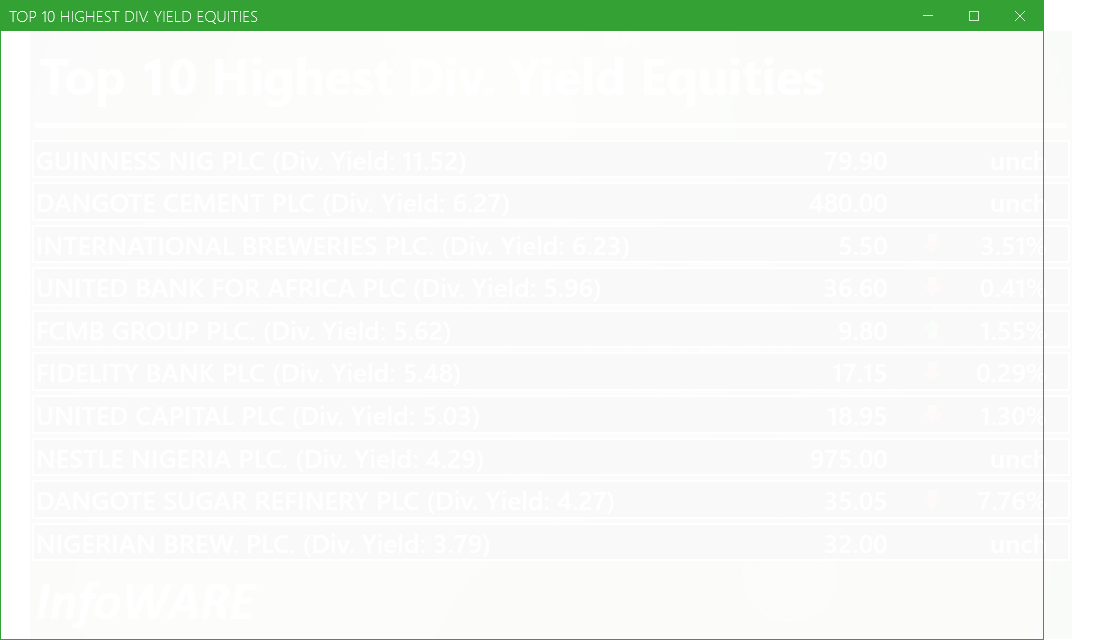
Investment Insights - High Div. Stocks
Dividend stocks distribute a portion of the company earnings to investors on a regular basis and they can a great choice for investors looking for regular income. As an investment or trading strategy, high dividend yield equities provide annual cash payments as against mostly capital gains in the price of a stock. The list in the table below represent the highest dividend paying stocks from the list of the most liquid stocks in the NSE top 30.
For more detailed analysis,
- On InfoWARE Market Data Terminal <HYIELD> <GO>
- On InfoWARE Finance Mobile App ( Android , iPhone & iPad and Windows 10) , "Research"
Investment Insights - Stocks outperforming the ASI but with approximately the same risk
These list of stocks represent equities that are less risky than the ASI but doing better than the ASI (All Shares Index) using the YTD (Year to Date) returns as the measure. The risk is measured by Beta. Beta is an assessment of a stock's tendency to undergo price changes, (its volatility), as well as its potential returns compared to the ASI. It is expressed as a ratio, where a score of 1 represents performance comparable to the ASI, and returns above or below the market may receive scores greater or lower than 1.
For a full list of both positively and negatively corelated stocks visit InfoWARE Market Data Terminal
- On InfoWARE Market Data Terminal <BANL> <GO>
- On InfoWARE Finance Mobile App ( Android , iPhone & iPad and Windows 10)
| Symbol | DivYield | PE | EPS | Beta | %ChgYTD | ASIYTDReturn | BetaDiff |
|---|---|---|---|---|---|---|---|
| HONYFLOUR | 1.40 | 16.28 | 0.31 | 0.99 | 80.49 | 2.73 | 0.01 |
| CAVERTON | 5.52 | 1.15 | 1.57 | 0.98 | 17.65 | 2.73 | 0.02 |
| UNILEVER | 2.81 | 67.09 | 0.40 | 0.75 | 4.72 | 2.73 | 0.25 |
| HMCALL | 0.00 | 0.00 | 0.00 | -0.74 | 20.53 | 2.73 | 0.26 |
| VETGOODS | 0.00 | 0.71 | 15.41 | 2.73 | 0.29 | ||
| VETGRIF30 | 0.00 | 0.71 | 4.64 | 2.73 | 0.29 | ||
| ABBEYBDS | 1.43 | 0.00 | 0.00 | 0.70 | 20.00 | 2.73 | 0.30 |
| NEM | 6.52 | 24.99 | 0.37 | 0.69 | 15.83 | 2.73 | 0.31 |
| TANTALIZER | 1.50 | 0.00 | 0.00 | 0.69 | 30.22 | 2.73 | 0.31 |
| NAHCO | 6.66 | 92.98 | 0.41 | 0.65 | 31.25 | 2.73 | 0.35 |
African Markets
| Name | LClose | Change | %Chg |
|---|---|---|---|
| BRVM Stock Exchange | 290.91 | -0.93 | -0.32 |
| Botswana Stock Exchange | 10,091.18 | -21.24 | -0.21 |
| Egyptian Exchange | 31,290.62 | 242.18 | 0.78 |
| Ghana Stock Exchange | 6,045.42 | 1.81 | 0.03 |
| Johannesburg Stock Exchange | 87,067.75 | 217.13 | 0.25 |
| Lusaka Stock Exchange | 15,429.87 | 3.09 | 0.02 |
| Casablanca Stock Exchange | 16,490.00 | 195.53 | 1.20 |
| Malawi Stock Exchange | 292,671.73 | -58.55 | -0.02 |
| Nigeria Stock Exchange | 106,220.94 | 127.31 | 0.12 |
| Nairobi Securities Exchange | 130.14 | -1.42 | -1.08 |
| Namibian Stock Exchange | 1,738.29 | 18.74 | 1.09 |
| Rwanda Stock Exchange | 148.89 | 0.00 | 0.00 |
| Tunis Stock Exchange | 10,819.91 | 15.13 | 0.14 |
| Uganda Securities Exchange | 1,331.01 | 1.06 | 0.08 |
Nigeria Market Indexes
| Symbol | LClose | %Chg | WTD% | MTD% | QTD% | YTD% | MktCap | Trades |
|---|---|---|---|---|---|---|---|---|
| ASI | 105,995.32 | -0.21 | -0.59 | -1.36 | 2.73 | 2.73 | 9,692 | |
| NGX30 | 3,928.38 | -0.18 | -0.63 | -1.53 | 2.98 | 2.98 | 4,690 | |
| NGXAFRBVI | 2,576.06 | -0.23 | -0.87 | -1.11 | 3.84 | 3.84 | 1,885 | |
| NGXAFRHDYI | 16,631.38 | -0.27 | -2.99 | -2.25 | -2.33 | -2.33 | 1,846 | |
| NGXASEM | 1,587.89 | 0.00 | 0.04 | 0.08 | 0.26 | 0.26 | 5 | |
| NGXBNK | 1,127.18 | -0.19 | -0.65 | -2.13 | 3.66 | 3.66 | 2,405 | |
| NGXCG | 2,949.98 | -0.27 | -1.24 | -1.71 | 4.27 | 4.27 | 4,964 | |
| NGXCNSMRGDS | 1,808.79 | -1.08 | -0.20 | -0.66 | 4.29 | 4.29 | 988 | |
| NGXGROWTH | 7,382.94 | 0.00 | -5.71 | -6.29 | -4.89 | -4.89 | 46 | |
| NGXINDUSTR | 3,611.99 | -0.03 | -0.04 | -0.20 | 1.13 | 1.13 | 593 | |
| NGXINS | 705.86 | 0.50 | 1.78 | -0.89 | -10.22 | -10.22 | 755 | |
| NGXLOTUSISLM | 7,576.37 | -0.37 | -0.90 | -1.72 | 8.73 | 8.73 | 1,258 | |
| NGXMAINBOARD | 5,081.65 | -0.26 | -0.15 | -0.98 | 1.55 | 1.55 | 7,352 | |
| NGXMERIGRW | 6,876.82 | -0.12 | -2.37 | -4.15 | 5.42 | 5.42 | 1,296 | |
| NGXMERIVAL | 10,456.27 | -0.84 | -1.98 | -2.82 | 0.25 | 0.25 | 2,846 | |
| NGXOILGAS | 2,527.29 | -0.18 | -0.71 | -1.76 | -6.78 | -6.78 | 264 | |
| NGXPENBRD | 1,891.50 | -0.16 | -0.69 | -1.44 | 3.27 | 3.27 | 7,217 | |
| NGXPENSION | 4,719.68 | -0.11 | -0.72 | -1.57 | 4.09 | 4.09 | 5,391 | |
| NGXPREMIUM | 10,213.42 | -0.13 | -1.37 | -2.04 | 4.94 | 4.94 | 2,294 | |
| NGXSOVBND | 620.41 | 0.00 | -0.32 | -0.35 | 3.14 | 3.14 | 0 |
For more detailed analysis,
- On InfoWARE Market Data Terminal <MKTINS> <GO>
- On InfoWARE Finance Mobile App ( Android, iPhone & iPad and Windows 10) , "Market Indexes"
Find the topic interesting? Will like to comment? Contact Us at solutions@infowarelimited.com
Top News

InfoWARE AI Analyst Daily Market Report: 14-Mar-2025
Chart Of The Day - ASI Chart Vs ASI Advance Decline Line (YTD) (14-Mar-2025 15:13:22.986)
InfoWARE AI Analyst Weekly Market Report: 14-Mar-2025

[XNSA]>> NORRENBERGER MUTUAL FUNDS WEEKLY UPDATE TO NGX
[XNSA]>> APPOINTMENT OF DIRECTORS
Breaking News! Unusual Volume Alert (14-Mar-2025 13:05:59.863)
Breaking News! Bulls Momentum Alert (14-Mar-2025 13:05:55.286)
Breaking News! Bears Momentum Alert (14-Mar-2025 13:05:55.097)
[XNSA]>> DEMISE OF DIRECTORS
[XNSA]>> RESIGNATION OF DIRECTORS
[XNSA]>> DAILY INDICATIVE PRICES
[MERGROWTH]>> DAILY INDICATIVE PRICES
[XNSA]>> CORDROS MILESTONE FUNDS' BID & OFFER PRICES
[XNSA]>> EMERGING AFRICA DAILY MUTUAL FUND PRICES
[XNSA]>> THE NGX FIXED INCOME INDICATIVE PRICE LIST FOR MAR 14, 2025
[XNSA]>> REGISTRATION FOR BATCH ONE- 2025 DEALING CLERKSHIP CERTIFICATION PROGR
[XNSA]>> LISTING OF 2024, Q4 SCRIP UNIT OF 222,826 UNITS OF NIDF
[SIAMLETF30]>> DAILY INDICATIVE PRICES
[XNSA]>> DAILY FUND PRICE SUBMISSION - FCMB ASSET MANAGEMENT LIMITED
[TRANSCORP]>>Notice of Meeting -<TRANSNATIONAL CORPORATION PLC>
[XNSA]>> DEMISE OF DIRECTORS
[XNSA]>> RESIGNATION OF DIRECTORS
[PZ]>>Corporate Disclosures-<P Z CUSSONS NIGERIA PLC.>
[XNSA]>> NOTIFICATION OF PRICE ADJUSTMENT
[SEPLAT]>>Corporate Disclosures-<SEPLAT ENERGY PLC>
Chart Of The Day - ASI Chart Vs ASI Advance Decline Line (YTD) (13-Mar-2025 15:07:46.571)
InfoWARE AI Analyst Daily Market Report: 13-Mar-2025
[NEM]>> Earning Forcast - <Q2-2025> ?-<NEM INSURANCE PLC.>
[NGXGROUP]>>Notice of Meeting -<NIGERIAN EXCHANGE GROUP PLC>
[MERGROWTH]>> DAILY INDICATIVE PRICES
Get IDIA - the stock trading app for the modern investor
Solutions by Business
Product Suites
Company
Contacts
- 8th Floor,
- South Atlantic Petroleum Towers,
- 1 Adeola Odeku Street,
- Victoria Island,
- Lagos, Nigeria.
- Email: solutions@infowarelimited.com
Follow Us
 |
 |
 |
 |