


InfoWARE AI Analyst Daily Market Report: 17-Mar-2025 | InfoWARE Finance
Get IDIA - the stock trading app for the modern investor


InfoWARE AI Analyst Daily Market Report: 17-Mar-2025
(Source: InfoWARE Terminal, Date: 17-Mar-2025)
Dear Investor,
Welcome to today's market summary for the Nigerian Stock Exchange (NGX) on March 17, 2025. The NGX ASI (All Share Index) experienced a slight decline of -0.15%, closing at 105,955.13. Year-to-date, the index has returned 2.54%. Today's trading volume was significantly lower at 461.43M compared to the previous day's 743.19M, indicating a -29.57% decrease in market turnover, which totaled 6.43B Naira. Market breadth was negative with 22 advancers and 38 decliners, reflecting a challenging trading environment.
- Market Breadth: The market breadth ratio stood at 0.58x, indicating more decliners than advancers.
- Top Gainers:
- STANBIC IBTC ETF 30 (STANBICETF30): Closed at 353.05, up 10.00%.
- ACADEMY PRESS PLC (ACADEMY): Closed at 2.88, up 9.92%.
- LOTUS HALAL EQUITY ETF (LOTUSHAL15): Closed at 35.49, up 9.54%.
- Top Losers:
- VETIVA S & P NIGERIA SOVEREIGN BOND ETF (VSPBONDETF): Closed at 190.00, down -38.71%.
- E-TRANZACT INTERNATIONAL PLC (ETRANZACT): Closed at 5.85, down -10.00%.
- SUNU ASSURANCES NIGERIA PLC (SUNUASSUR): Closed at 4.63, down -9.92%.
Insights and Predictions
- The decrease in market turnover by -29.57% suggests a potential lack of investor confidence, which could lead to further declines if not addressed.
- With 22 advancing stocks against 38 declining stocks, the trend indicates bearish momentum in the market.
- Notable movements in stocks with unusual volumes include JAIZ BANK PLC, which traded 197.42M shares, significantly above its 90-day average of 16.06M.
- In the Year-To-Date (YTD) analysis, stocks like NEIMETH INTERNATIONAL PHARMACEUTICALS PLC and E-TRANZACT are showing bearish momentum with RSIs below 30, indicating oversold conditions.
Contrarian Signals
Despite a YTD loss of -9.8%, CHAMPION BREW. PLC. has an RSI of 54.4 and a bullish MACD, suggesting potential for a rebound.
Sector Heatmaps
| Sector | Performance |
|---|---|
| Banking | -0.5% |
| Insurance | +1.2% |
| Telecommunications | -1.0% |
Dividend-Beta Matrix
| Stock | Dividend Yield | Beta |
|---|---|---|
| AFRIPRUD | 1.27% | 0.64 |
Institutional Clustering Alerts
ZENITHBANK has a significant institutional trade value share of 20.17%, indicating strong institutional interest.
High Dividend Yield Stocks
Stocks like AFRIPRUD with a yield of 1.27% and a Beta of 0.64 present defensive opportunities amidst market volatility.
Suggestions for Traders
- Monitor stocks with bullish momentum closely, especially those crossing above their 15-day moving averages.
- Be cautious with stocks showing bearish momentum, particularly those with declining RSIs and MACD crossovers.
Market Activity Summary
Retail investors accounted for 90.95% of trade count but only 15.85% of trade value, indicating a potential lack of conviction in retail trading. In contrast, institutional investors, while only 9.05% of trade count, represented 84.15% of trade value, suggesting a more strategic approach to trading.
|
Top ASI Gainers Over Last 5 Trading Days
|
Top ASI Losers Over Last 5 Trading Days
|
For more detailed analysis, on InfoWARE Market Data Terminal <NSEPERF> <GO>
On InfoWARE Finance Mobile App (Android, iPhone & iPad, Windows Phone and Windows 8/10), "Top Gainers & Losers"
STANBIC IBTC ETF 30 (STANBICETF30) topped the advancers list closing at N353.05 with a gain of 10.00% followed by ACADEMY PRESS PLC. (ACADEMY) which closed at N2.88 with a gain of 9.92%.
On the flip side VETIVA S & P NIGERIA SOVEREIGN BOND ETF (VSPBONDETF) and E-TRANZACT INTERNATIONAL PLC (ETRANZACT) topped the decliners log with a loss of -38.71% at a close of N190.00, and -10.00% to close the day at N5.85 respectively.
| Symbol | LClose | %Chg |
|---|---|---|
| STANBICETF30 | 353.05 | 10.00 |
| ACADEMY | 2.88 | 9.92 |
| LOTUSHAL15 | 35.49 | 9.54 |
| NEIMETH | 2.70 | 8.43 |
| TANTALIZER | 3.13 | 6.83 |
| Symbol | LClose | %Chg |
|---|---|---|
| VSPBONDETF | 190.00 | -38.71 |
| ETRANZACT | 5.85 | -10.00 |
| SUNUASSUR | 4.63 | -9.92 |
| PRESTIGE | 1.00 | -8.26 |
| SOVRENINS | 0.95 | -7.77 |
For more detailed analysis,
- On InfoWARE Market Data Terminal <TOPG> <GO>
- On InfoWARE Finance Mobile App ( Android, iPhone & iPad and Windows 10) , "Top Gainers & Losers"
Currency Market
In the currency market, the Naira fell 1.17%(-17.92) sharply against the Dollar to settle at 1 to 1Investment Insights - Top 5 Gainers YTD
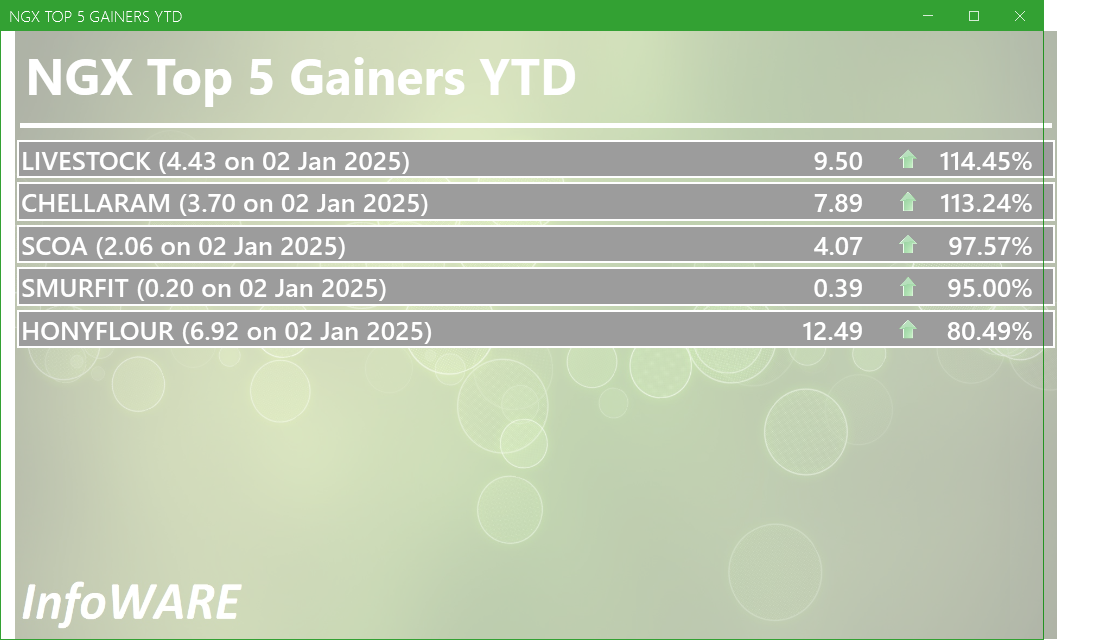
These stocks are the best performers whose price has risen faster than the market as a whole with the best returns year to date. Momentum investors believe that stocks that have outperformed the market will often continue to do so because the factors that caused them to outperform will not suddenly disappear. In addition, other investors seeking to benefit from the stock’s outperformance will often purchase the stock, further bidding its price higher and pushing the stock higher still
For more detailed analysis,
- On InfoWARE Market Data Terminal <T5YTD2> <GO>
- On InfoWARE Finance Mobile App ( Android , iPhone & iPad and Windows 10) , "Research"
NSE: Bull Signal - Price crossed above 15 Day MA
This signal implies these stocks are under buying pressure and the price might continue to rise and therefore positions should be monitored closely. Further suggested analysis include looking at the overall market (ASI) to see if the uptrend is market wide, sector wide or specific to the stock. Portfolio managers tend to use this as a signal to do more research to add to their positions or lock in some profits. Typically further analysis should be done using commands like PC and RV on the InfoWARE Market Data Terminal. Another command is ALERTS to set price triggers for possible exit or entry as necessary
For more detailed analysis,
- On InfoWARE Market Data Terminal <NSEPERF> <GO>
- On InfoWARE Finance Mobile App ( Android , iPhone & iPad and Windows 10) , "Top Gainers & Losers"
NSE: BEAR Signal - Price crossed below 15 Day MA
This signal implies these stocks are under selling pressure and the price might continue to slide and therefore positions should be monitored closely. Further suggested analysis include looking at the overall market (ASI) to see if the downtrend is market wide, sector wide or specific to the stock. If the overal market trend is upwards, then since these stocks are heading in the opposite direction, then further analysis should be done using commands like PC and RV on the InfoWARE Market Data Terminal. Another command is ALERTS to set price triggers for possible exit is necessar
For more detailed analysis,
- On InfoWARE Market Data Terminal <BEARM> <GO>
- On InfoWARE Finance Mobile App ( Android , iPhone & iPad and Windows 10)
| Symbol | Price | %Chg | 15DMA | PE | EPS | DivY | MktCap | Vol | Trades | Value | LstTradeTime |
|---|---|---|---|---|---|---|---|---|---|---|---|
| TAJSUKS1 | 99.99 | 0.00 | 99.99 | 0.00 | 0.00 | 0.00 | 0.00 | 0.00 | 17-Mar-2025 14:33:00.553 | ||
| STERLINGNG | 5.31 | -1.69 | 5.35 | 15.75 | 0.30 | 3.19 | 152.88B | 3.71M | 132.00 | 19.84M | 17-Mar-2025 14:32:27.827 |
| CHAMS | 2.11 | -1.90 | 2.12 | 27.02 | 0.07 | 1.56 | 9.91B | 5.60M | 75.00 | 11.90M | 17-Mar-2025 14:31:26.817 |
| MERGROWTH | 389.00 | -2.83 | 399.32 | 0.00 | 0.00 | 60.00 | 3.00 | 23.34K | 17-Mar-2025 14:33:47.243 | ||
| INTBREW | 5.20 | -5.77 | 5.32 | 0.00 | 0.00 | 6.23 | 139.68B | 1.82M | 42.00 | 9.35M | 17-Mar-2025 14:31:53.017 |
| GUINEAINS | 0.65 | -6.15 | 0.67 | 66.79 | 0.01 | 1.96 | 3.99B | 4.16M | 63.00 | 2.88M | 17-Mar-2025 14:31:50.730 |
| NSLTECH | 0.62 | -6.45 | 0.63 | 0.00 | 0.00 | 15.87 | 3.49B | 4.40M | 53.00 | 2.75M | 17-Mar-2025 14:33:46.377 |
| UPDCREIT | 6.05 | -7.44 | 6.12 | 9.09 | 0.57 | 10.87 | 16.14B | 439.55K | 47.00 | 2.68M | 17-Mar-2025 14:33:05.440 |
| FGS202665 | 70.00 | -42.86 | 93.67 | 0.00 | 0.00 | 1.00K | 3.00 | 701.37K | 17-Mar-2025 14:32:56.890 | ||
| VSPBONDETF | 190.00 | -63.16 | 212.71 | 0.00 | 0.00 | 25.00 | 7.00 | 6.52K | 17-Mar-2025 14:33:47.523 |
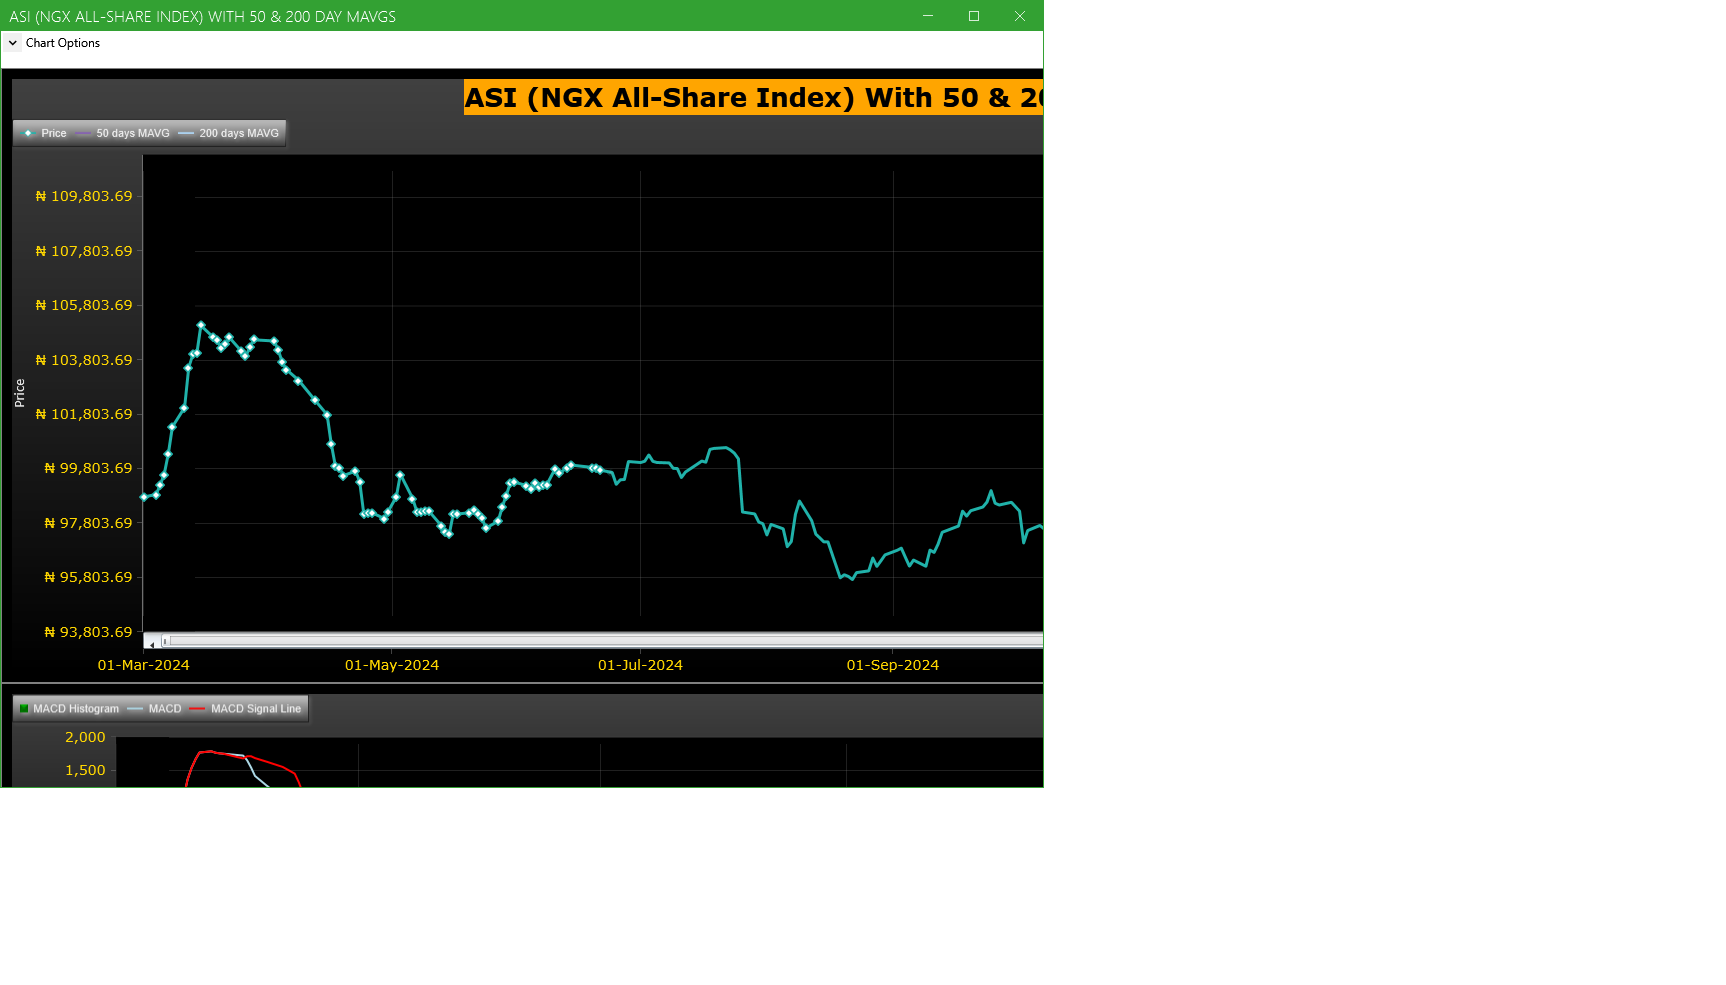
Market Trend - ASI (NGX All-Share-Index) With 50 & 200 Day MAvgs Chart
Technical traders typically use the 50 & 200 day moving averages to aid in choosing
where to enter or exit a position, which then causes these levels to act as strong
support or resistance. As a general guideline, if the price is above a moving average,
the trend is up. If the price is below a moving average, the trend is down.
It is important to note that critics of technical analysis say that moving averages act
as support and resistance because so many traders use these indicators to inform their
trading decisions. Also moving averages tend to work quite well in strong trending conditions
but poorly in choppy or ranging conditions.
Trading Strategies: Crossovers
Crossovers are one of the main moving average strategies. The first type is a price crossover,
which is when the price crosses above or below a moving average to signal a potential change
in trend. Another strategy is to apply two moving averages to a chart: one longer and one
shorter. When the shorter-term MA crosses above the longer-term MA, it is a buy signal, as
it indicates that the trend is shifting up. This is known as a golden cross. Meanwhile, when
the shorter-term MA crosses below the longer-term MA, it is a sell signal, as it indicates that
the trend is shifting down. This is known as a dead/death cross
For more detailed analysis,
- On InfoWARE Market Data Terminal <CI> <GO>
- On InfoWARE Finance Mobile App ( Android , iPhone & iPad and Windows 10) , "Research"
Unusual Volume: Volume traded is more than double the 90 day moving average (All exchanges; ASI & ASem). For more detailed analysis,
- On InfoWARE Market Data Terminal <UV> <GO>
- On InfoWARE Finance Mobile App ( Android , iPhone & iPad and Windows 10)
| Symbol | Name | Volume | 90DAvgVol | %VolChg | Price | LClose | %Chg | Trades | Value |
|---|---|---|---|---|---|---|---|---|---|
| JAIZBANK | JAIZ BANK PLC | 197.42M | 16.06M | 1,129.17 | 3.28 | 3.25 | 0.92 | 298 | 606.15M |
| PRESTIGE | PRESTIGE ASSURANCE CO. PLC. | 18.54M | 7.90M | 134.67 | 1.00 | 1.09 | -8.26 | 228 | 18.99M |
| CONHALLPLC | CONSOLIDATED HALLMARK INSURANCE PLC | 12.66M | 4.18M | 202.61 | 3.40 | 3.65 | -6.85 | 93 | 42.33M |
| NAHCO | NIGERIAN AVIATION HANDLING COMPANY PLC | 10.09M | 1.74M | 478.70 | 63.00 | 63.00 | 0.00 | 199 | 626.52M |
| MTNN | MTN NIGERIA PLC | 5.36M | 1.93M | 177.58 | 245.00 | 245.00 | 0.00 | 648 | 1.30B |
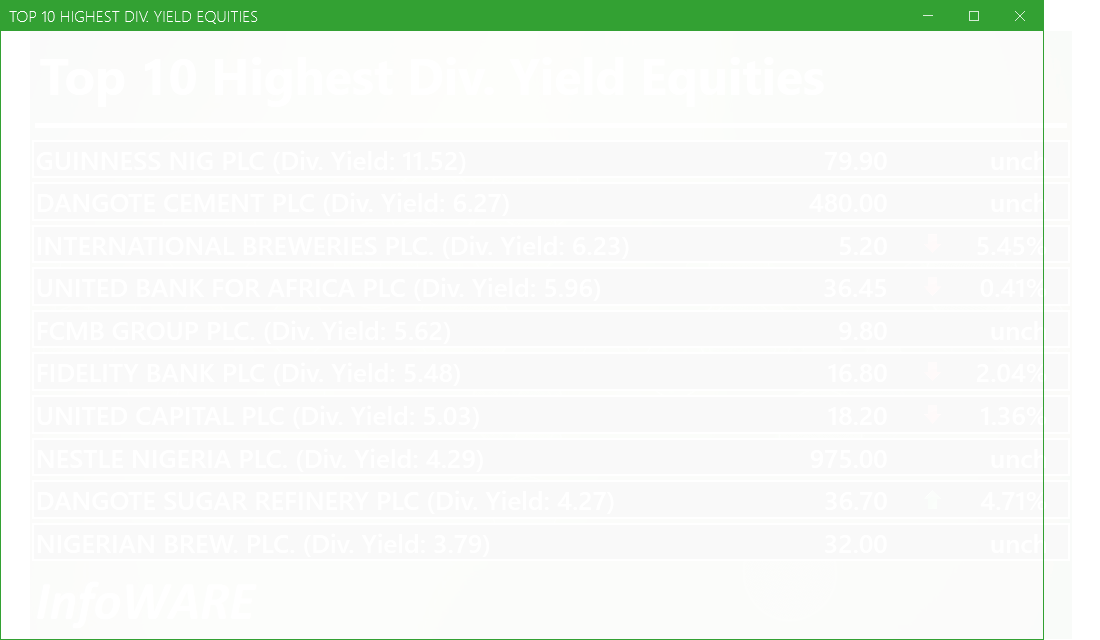
Investment Insights - High Div. Stocks
Dividend stocks distribute a portion of the company earnings to investors on a regular basis and they can a great choice for investors looking for regular income. As an investment or trading strategy, high dividend yield equities provide annual cash payments as against mostly capital gains in the price of a stock. The list in the table below represent the highest dividend paying stocks from the list of the most liquid stocks in the NSE top 30.
For more detailed analysis,
- On InfoWARE Market Data Terminal <HYIELD> <GO>
- On InfoWARE Finance Mobile App ( Android , iPhone & iPad and Windows 10) , "Research"
Investment Insights - Stocks outperforming the ASI but with approximately the same risk
These list of stocks represent equities that are less risky than the ASI but doing better than the ASI (All Shares Index) using the YTD (Year to Date) returns as the measure. The risk is measured by Beta. Beta is an assessment of a stock's tendency to undergo price changes, (its volatility), as well as its potential returns compared to the ASI. It is expressed as a ratio, where a score of 1 represents performance comparable to the ASI, and returns above or below the market may receive scores greater or lower than 1.
For a full list of both positively and negatively corelated stocks visit InfoWARE Market Data Terminal
- On InfoWARE Market Data Terminal <BANL> <GO>
- On InfoWARE Finance Mobile App ( Android , iPhone & iPad and Windows 10)
| Symbol | DivYield | PE | EPS | Beta | %ChgYTD | ASIYTDReturn | BetaDiff |
|---|---|---|---|---|---|---|---|
| HONYFLOUR | 1.40 | 16.28 | 0.31 | 0.99 | 80.49 | 2.54 | 0.01 |
| CAVERTON | 5.52 | 1.15 | 1.57 | 0.98 | 11.76 | 2.54 | 0.02 |
| UNILEVER | 2.81 | 67.09 | 0.40 | 0.75 | 4.72 | 2.54 | 0.25 |
| HMCALL | 0.00 | 0.00 | 0.00 | -0.74 | 20.53 | 2.54 | 0.26 |
| VETGOODS | 0.00 | 0.71 | 15.70 | 2.54 | 0.29 | ||
| VETGRIF30 | 0.00 | 0.71 | 8.61 | 2.54 | 0.29 | ||
| ABBEYBDS | 1.43 | 0.00 | 0.00 | 0.70 | 20.00 | 2.54 | 0.30 |
| NEM | 6.52 | 24.99 | 0.37 | 0.69 | 15.83 | 2.54 | 0.31 |
| TANTALIZER | 1.50 | 0.00 | 0.00 | 0.69 | 39.11 | 2.54 | 0.31 |
| NAHCO | 6.66 | 92.98 | 0.41 | 0.65 | 31.25 | 2.54 | 0.35 |
African Markets
| Name | LClose | Change | %Chg |
|---|---|---|---|
| BRVM Stock Exchange | 291.92 | 1.02 | 0.35 |
| Botswana Stock Exchange | 10,091.65 | 0.00 | 0.00 |
| Egyptian Exchange | 31,290.62 | 242.18 | 0.78 |
| Ghana Stock Exchange | 6,109.28 | 64.08 | 1.06 |
| Johannesburg Stock Exchange | 87,916.44 | 844.60 | 0.97 |
| Lusaka Stock Exchange | 15,427.76 | -1.54 | -0.01 |
| Casablanca Stock Exchange | 16,613.70 | 123.68 | 0.75 |
| Malawi Stock Exchange | 292,632.10 | -29.27 | -0.01 |
| Nigeria Stock Exchange | 105,955.13 | -265.55 | -0.25 |
| Nairobi Securities Exchange | 129.54 | -0.60 | -0.46 |
| Namibian Stock Exchange | 1,770.46 | 32.16 | 1.85 |
| Rwanda Stock Exchange | 149.13 | 0.24 | 0.16 |
| Tunis Stock Exchange | 10,795.68 | -23.80 | -0.22 |
| Uganda Securities Exchange | 1,328.11 | -2.93 | -0.22 |
Nigeria Market Indexes
| Symbol | LClose | %Chg | WTD% | MTD% | QTD% | YTD% | MktCap | Trades |
|---|---|---|---|---|---|---|---|---|
| ASI | 105,799.17 | -0.15 | 0.00 | -1.54 | 2.54 | 2.54 | 12,582 | |
| NGX30 | 3,922.34 | -0.12 | 0.00 | -1.68 | 2.82 | 2.82 | 6,138 | |
| NGXAFRBVI | 2,569.21 | -0.27 | 0.00 | -1.37 | 3.56 | 3.56 | 2,550 | |
| NGXAFRHDYI | 16,539.55 | -0.55 | 0.00 | -2.79 | -2.87 | -2.87 | 2,707 | |
| NGXASEM | 1,587.89 | 0.00 | 0.00 | 0.08 | 0.26 | 0.26 | 6 | |
| NGXBNK | 1,124.87 | -0.20 | 0.00 | -2.33 | 3.44 | 3.44 | 3,240 | |
| NGXCG | 2,940.55 | -0.32 | 0.00 | -2.03 | 3.93 | 3.93 | 6,760 | |
| NGXCNSMRGDS | 1,801.91 | -0.38 | 0.00 | -1.04 | 3.89 | 3.89 | 1,292 | |
| NGXGROWTH | 7,382.94 | 0.00 | 0.00 | -6.29 | -4.89 | -4.89 | 51 | |
| NGXINDUSTR | 3,612.05 | 0.00 | 0.00 | -0.20 | 1.13 | 1.13 | 628 | |
| NGXINS | 693.23 | -1.79 | 0.00 | -2.66 | -11.82 | -11.82 | 1,272 | |
| NGXLOTUSISLM | 7,578.88 | 0.03 | 0.00 | -1.69 | 8.77 | 8.77 | 1,859 | |
| NGXMAINBOARD | 5,069.48 | -0.18 | 0.00 | -1.22 | 1.31 | 1.31 | 9,383 | |
| NGXMERIGRW | 6,858.93 | -0.26 | 0.00 | -4.40 | 5.15 | 5.15 | 1,658 | |
| NGXMERIVAL | 10,452.17 | -0.04 | 0.00 | -2.85 | 0.21 | 0.21 | 3,724 | |
| NGXOILGAS | 2,522.50 | -0.19 | 0.00 | -1.94 | -6.96 | -6.96 | 383 | |
| NGXPENBRD | 1,890.85 | -0.03 | 0.00 | -1.48 | 3.23 | 3.23 | 9,694 | |
| NGXPENSION | 4,711.58 | -0.17 | 0.00 | -1.73 | 3.92 | 3.92 | 6,966 | |
| NGXPREMIUM | 10,204.71 | -0.09 | 0.00 | -2.12 | 4.85 | 4.85 | 3,148 | |
| NGXSOVBND | 620.41 | 0.00 | 0.00 | -0.35 | 3.14 | 3.14 | 0 |
For more detailed analysis,
- On InfoWARE Market Data Terminal <MKTINS> <GO>
- On InfoWARE Finance Mobile App ( Android, iPhone & iPad and Windows 10) , "Market Indexes"
Find the topic interesting? Will like to comment? Contact Us at solutions@infowarelimited.com
Top News

Chart Of The Day - ASI Chart Vs ASI Advance Decline Line (YTD) (17-Mar-2025 15:09:17.907)
InfoWARE AI Analyst Daily Market Report: 17-Mar-2025

[XNSA]>> CORDROS MILESTONE FUNDS' BID & OFFER PRICES
[MERVALUE]>> DAILY INDICATIVE PRICES
[XNSA]>> EMERGING AFRICA DAILY MUTUAL FUND PRICES
[JAIZBANK]>> Earning Forcast - <Q2-2025> ?-<JAIZ BANK PLC>
[VETINDETF]>> DAILY INDICATIVE PRICES
[XNSA]>> NGX FIXED INCOME INDICATIVE PRICE LIST FOR MAR 17, 2025
[XNSA]>> LISTING OF NGX30U5 AND NGXPENSIONU5 FUTURES CONTRACTS
[XNSA]>> LISTING OF 16,666,666,667 ORDINARY SHARES OF STERLING FINANCIAL HOLDING
[XNSA]>> REGISTRATION FOR BATCH ONE- 2025 DEALING CLERKSHIP CERTIFICATION PROGR
[XNSA]>> NOTIFICATION OF PRICE ADJUSTMENT
[XNSA]>> DAILY FUND PRICE SUBMISSION - FCMB ASSET MANAGEMENT LIMITED
InfoWARE AI Analyst Daily Market Report: 14-Mar-2025
Chart Of The Day - ASI Chart Vs ASI Advance Decline Line (YTD) (14-Mar-2025 15:13:22.986)
InfoWARE AI Analyst Weekly Market Report: 14-Mar-2025
[XNSA]>> NORRENBERGER MUTUAL FUNDS WEEKLY UPDATE TO NGX
[XNSA]>> APPOINTMENT OF DIRECTORS
Breaking News! Unusual Volume Alert (14-Mar-2025 13:05:59.863)
Breaking News! Bulls Momentum Alert (14-Mar-2025 13:05:55.286)
Breaking News! Bears Momentum Alert (14-Mar-2025 13:05:55.097)
[XNSA]>> DEMISE OF DIRECTORS
[XNSA]>> RESIGNATION OF DIRECTORS
[XNSA]>> DAILY INDICATIVE PRICES
[MERGROWTH]>> DAILY INDICATIVE PRICES
[XNSA]>> CORDROS MILESTONE FUNDS' BID & OFFER PRICES
[XNSA]>> EMERGING AFRICA DAILY MUTUAL FUND PRICES
[XNSA]>> THE NGX FIXED INCOME INDICATIVE PRICE LIST FOR MAR 14, 2025
[XNSA]>> REGISTRATION FOR BATCH ONE- 2025 DEALING CLERKSHIP CERTIFICATION PROGR
[XNSA]>> LISTING OF 2024, Q4 SCRIP UNIT OF 222,826 UNITS OF NIDF
Get IDIA - the stock trading app for the modern investor
Solutions by Business
Product Suites
Company
Contacts
- 8th Floor,
- South Atlantic Petroleum Towers,
- 1 Adeola Odeku Street,
- Victoria Island,
- Lagos, Nigeria.
- Email: solutions@infowarelimited.com
Follow Us
 |
 |
 |
 |