


InfoWARE AI Analyst Daily Market Report: 21-Aug-2025 | InfoWARE Finance
Get IDIA - the stock trading app for the modern investor


InfoWARE AI Analyst Daily Market Report: 21-Aug-2025
(Source: InfoWARE Terminal, Date: 21-Aug-2025)
Dear Investor,
NGX Daily Market Summary & Insights – Thursday, August 21, 2025
The Nigerian equity market pulled back today, with the NGX All Share Index (ASI) closing at 141,566.31 (-0.87%). Despite this dip, the market still boasts a robust +36.01% YTD return. Turnover fell sharply by -24.37% to ₦9.28B, and trading volume slid to 448.91M units, well below the previous day. Market breadth was distinctly negative at 0.40x (20 advancers vs. 50 decliners), suggesting profit-taking and waning momentum. Similar caution appeared in the currency market as the Naira dipped 0.05% to 1,535/USD.
📊 Noteworthy Market Trends & Breadth
- Market Breadth: Gloomy with decliners outpacing advancers (50 vs. 20). Only 58 companies traded up in volume, 84 saw lower volumes.
- Turnover: The steep drop in turnover and volume hints at growing investor caution; lower appetite for risk and possible pre-weekend repositioning.
- Retail vs Institutional: Institutional investors dominated trade value (83.64%), while retail investors contributed 60.78% of trade counts.
🚀 Top Gainers & Losers
| Stock | Price | Change (%) | RSI | MACD | MAvg 15 vs 50 |
|---|---|---|---|---|---|
| VSPBONDETF | 270.95 | +26.02% | 42.44 | -39.78 | 261.54 < 326.60 (Bullish Crossover) |
| NSLTECH | 1.05 | +9.38% | 50.24 | 0.046 | 0.99 < 0.86 (Bullish Crossover) |
| OMATEK | 1.44 | +5.88% | 52.69 | 0.067 | 1.36 < 1.16 (Bullish Crossover) |
| CHAMS | 2.73 | +5.00% | 45.47 | -0.0089 | 2.78 < 2.65 (Bullish Crossover) |
| CUSTODIAN | 39.90 | +4.86% | 54.70 | 2.54 | 39.98 > 31.62 (Bullish) |
| Stock | Price | Change (%) | RSI | MACD | MAvg 15 vs 50 |
|---|---|---|---|---|---|
| THOMASWY | 3.33 | -10.0% | 62.53 | 0.224 | 3.53 > 2.91 (Bearish) |
| UPL | 6.30 | -10.0% | 61.23 | 0.33 | 6.21 > 5.98 (Bearish) |
| INTENEGINS | 3.24 | -10.0% | 64.93 | 0.41 | 3.17 > 2.37 (Bearish) |
| STANBICETF30 | 391.5 | -10.0% | 38.02 | 4.50 | 481.05 > 447.88 (Bearish) |
| VERITASKAP | 1.80 | -10.0% | 56.34 | 0.29 | 2.08 > 1.39 (Bearish) |
- ETF and bond products (VSPBONDETF, STANBICETF30) took both top gainers and losers slots, implying increased speculative activity or sector rotation.
- VSPBONDETF soared +26.02%; this is also a YTD gainer, displaying rare multi-timeframe momentum.
- STANBICETF30 fell -10%, pulling both daily and YTD performance negative, underscoring divergence between equity and ETF segments.
- Many losers are clustered in insurance and small/mid-cap, a sign of sector/lower liquidity stress.
- None of the gainers are in classic overbought (RSI > 70) territory, suggesting more room to run—but with caution.
🔎 Key Insights & Patterns
- Turnover Decline: The -24% fall in turnover and low volume typically presages consolidation or a pause; participation thinning means new trends could quickly accelerate or reverse.
- Breadth Weakness: Advancers/decliners ratio (0.4x) warns of widespread selling; further declines may occur unless breadth improves.
- Unusual Volumes:
- STANBIC traded 4x its avg volume, but still closed slightly -0.53% lower, indicating institutional profit-taking or rotation.
- DEAPCAP and MULTIVERSE volumes also spiked, hinting at accumulation under the radar or large order matching. Watch for follow-through in coming sessions.
- NCR posted 2.9x normal volume with no price move—potential accumulation.
- Bullish Momentum:
- VSPBONDETF, NSLTECH, and ACADEMY closed above their 15DMA, confirming technical strength.
- These moves align with strong YTD/5-day returns, reinforcing momentum plays.
- Bearish Momentum:
- Insurance sector names, e.g. SOVRENINS, REGALINS, VERITASKAP crossed below 15DMA, compounding YTD and near-term weakness (see YTD losers).
- BUACEMENT & JBERGER breakdown signals possible rotation out of industrials/construction.
- YTD Gainers:
- NIGERIAN ENAMELWARE up a staggering +102.1% YTD – but with RSI near 99, it is now severely overbought; watch for mean reversion.
- ACADEMY, MULTIVERSE, and NCR reinforce the case for thematic/momentum investing.
- YTD Losers Clustering:
- Unrelenting pressure in insurance microcaps (ROYAL EXCHANGE, WAPIC, PRESTIGE, SOVRENINS, etc.), a theme echoed in bearish momentum and sector heatmap below.
- Several YTD losers—VERITASKAP, STANBICETF30—also appeared among today's top daily losers and bearish 15DMA crossers (multi-timeframe downtrend = caution!).
⚡ Contrarian Signals
-
Certain stocks display conflicting technicals—one of the classic early-warning/contrarian signals:
- CHAMS: RSI 45 (neutral), modest positive MACD, price rose +5%, 15DMA bullish crossover—momentum building but not yet overbought. Could break higher or falter soon.
- STANBICETF30: RSI 38 (approaching oversold), but MACD still strongly positive (+4.50). Price fell -10%—whipsaw potential, suggesting possible technical bounce if buyers emerge.
- VSPBONDETF: Huge daily gain and bullish 15DMA/50DMA cross, but deeply negative MACD—potential exhaustion or "last gasp” of a rally.
🔥 Sector Heatmap & Institutional Clustering
| Sector | Key Stocks (YTD) | Performance | Dominant Activity | Technical Pattern |
|---|---|---|---|---|
| Insurance | WAPIC, SOVRENINS, VERITASKAP | -18% to -26% YTD | Retail | Bearish 15DMA cross, low RSI |
| ETF | VSPBONDETF, STANBICETF30, VETGRIF30 | Mixed | Institutional/ETF traders | Momentum & Volatility |
| Other Financials | CUSTODIAN, FIDELITYBK | Mildly positive | Institutional | Sideways; some bullish flashes |
| Banking | GTCO, ZENITHBANK, ACCESSCORP, UBA | Steady | Institutional | High trade value; flat price action |
| Industrials | BUACEMENT, JBERGER | Short-term Weakness | -- | Bearish break below 15DMA |
- Alert: ZENITHBANK: 20.17% institutional trade value share—Big players moving the stock, supporting near-term price stability. Monitor for block-trade-driven volatility.
- FIDELITYBK: Heaviest institutional volume today (over 94.24M units in 109 trades).
- Retail attention scattered, but heavy in GTCO, ACCESSCORP, ZENITHBANK, UBA.
💸 Dividend–Beta Matrix: Defensive Screen
| Stock | Dividend Yield | Beta | Momentum Signal |
|---|---|---|---|
| AFRIPRUD | 1.27% | 0.64 | Bearish (below 15DMA) |
| CAVERTON | 5.52% | 0.98 | Bearish (below 15DMA) |
| REGALINS | 6.52% | 0.47 | Bearish (below 15DMA, YTD loser) |
- Most high-dividend stocks are currently in technical downtrends—dividend alone is not defensive in current climate.
- Combine high-yield exposure with evidence of bullish reversal (RSI turning up, price above 15DMA) for safest entries.
📈 Recommendations & Opportunities
-
For Traders:
- Momentum: Watch VSPBONDETF, NSLTECH for potential follow-through; trailing stops advised due to volatility and MACD risk.
- Contrarian Swing: STANBICETF30 and high-volume names like STANBIC could offer technical bounces if selling exhausts; look for stabilization signs (e.g. green close, RSI bounce from below 40).
- Defensive Yield: REGALINS offers high yield, but wait for price stabilization or bullish momentum before entry.
- Avoid most micro-cap insurance stocks with falling RSI/momentum—downtrends are persistent.
- Rotate into high-conviction institutional favorites (ZENITHBANK, FIDELITYBK) on dips.
-
Cautions:
- Overall narrow breadth and falling turnover warn not to chase extended rallies. Only buy on strong pullbacks or trend confirmation.
- ETF/tradable bond volatility may mask underlying market softness.
💹 YTD Top 5 Gainers
| Stock | Price | %ChgYTD | RSI | MACD |
|---|---|---|---|---|
| ENAMELWA | 39.00 | +102.07% | 98.79 | 3.45 |
| ACADEMY | 9.00 | +185.71% | 56.03 | 0.25 |
| MULTIVERSE | 11.10 | +36.65% | 70.41 | 0.20 |
| NCR | 9.55 | +73.64% | 98.06 | 0.62 |
| DAARCOMM | 1.30 | +77.94% | 77.41 | 0.10 |
💹 YTD Top 5 Losers
| Stock | Price | %ChgYTD | RSI | MACD |
|---|---|---|---|---|
| ROYALEX | 2.27 | -86.36% | 55.07 | 0.36 |
| WAPIC | 3.26 | -19.83% | 52.46 | 0.37 |
| PRESTIGE | 1.78 | -21.05% | 54.28 | 0.23 |
| SOVRENINS | 2.67 | -95.94% | 56.30 | 0.42 |
| VERITASKAP | 2.00 | -20.81% | 56.34 | 0.29 |
📊 Market Activity Summary - Retail vs Institutional Insight
| Investor Type | Trade Count | Total Volume | Trade Value (₦) | % Volume | % Trade Value |
|---|---|---|---|---|---|
| Institutional | 1,920 | 342.20M | 11.09B | 58.28% | 83.64% |
| Retail | 25,232 | 244.95M | 2.17B | 41.72% | 16.36% |
- Top Institutional Traded: FIDELITYBK (94.24M shares), ACCESSCORP (26.40M), GTCO and ZENITHBANK both with over 7.7M each, followed by MTNN. This cluster dominates value and volume—strong institutional clustering = price stability or eventual breakout.
- Top Retail Traded: GTCO, ACCESSCORP, ZENITHBANK, UBA, MTNN—reflecting retail focus on liquid, large-cap banking names.
- Correlations: Most heavily traded banking stocks by institutions are also major retail favorites. For tactical entries, follow institutional flows, but retail momentum often foreshadows short-term moves.
🔮 Hidden Insights & Key Takeaways:
- Institutional Participation Remains High: Big blocks in FIDELITYBK and ZENITHBANK reveal continued institutional confidence in financials.
- Yield ≠ Safety: Many high-yield stocks are still trending down. Do not rely solely on dividend screens—confirm with technical turnarounds.
- Breadth & Participation Weakening: Declining volume and turnover plus narrow breadth signal temporary market fatigue.
- MULTIVERSE, NCR accumulate quietly: Despite unusual volume, price muted; possible stealth accumulation for future breakout.
- YTD Winners Overstretched: Names like ENAMELWA and NCR are heavily overbought—avoid fresh entries, consider partial profit-taking.
- Bullish 15DMA Crosses + Good Liquidity = Best Near-term Bets.
- Sector rotation in play: ETFs/bonds, select large banks, and stealth small-cap momentum stories seeing the most action.
- Bearish traps: Persistent microcap insurance weakness—do not bottom-fish until signs of reversal.
💡 Strategic Guidance
- Momentum Seekers: Monitor gainers with bullish crossovers and surging volumes (VSPBONDETF, NSLTECH).
- Cautious Investors: Wait for market breadth to turn and for defensive stocks to stabilize above 15DMA—do not chase rebounds.
- Portfolio Rotators: Watch for blocks or value surges in big banks before reallocating to high-yielding but safe financials.
- Sector Watch: Insurance sector under severe pressure—limit new exposure.
- Short-term Tech-driven Trades: Beware false signals in low turnover—confirm with both RSI and moving averages.
Disclaimer: The above summary is for information only, not investment advice. Always do your own research or consult a qualified adviser before making decisions.
|
Top ASI Gainers Over Last 5 Trading Days
|
Top ASI Losers Over Last 5 Trading Days
|
For more detailed analysis, on InfoWARE Market Data Terminal <NSEPERF> <GO>
On InfoWARE Finance Mobile App (Android, iPhone & iPad, Windows Phone and Windows 8/10), "Top Gainers & Losers"
VETIVA S & P NIGERIA SOVEREIGN BOND ETF (VSPBONDETF) topped the advancers list closing at N270.95 with a gain of 26.02% followed by SFS REAL ESTATE INVESTMENT TRUST (SFSREIT) which closed at N274.15 with a gain of 9.99%.
On the flip side INTERNATIONAL ENERGY INSURANCE COMPANY PLC (INTENEGINS) and STANBIC IBTC ETF 30 (STANBICETF30) topped the decliners log with a loss of -10.00% at a close of N3.24, and -10.00% to close the day at N391.50 respectively.
| Symbol | LClose | %Chg |
|---|---|---|
| VSPBONDETF | 270.95 | 26.02 |
| SFSREIT | 274.15 | 9.99 |
| JAIZBANK | 4.39 | 9.75 |
| NSLTECH | 1.05 | 9.38 |
| OMATEK | 1.44 | 5.88 |
| Symbol | LClose | %Chg |
|---|---|---|
| INTENEGINS | 3.24 | -10.00 |
| STANBICETF30 | 391.50 | -10.00 |
| THOMASWY | 3.33 | -10.00 |
| UPL | 6.30 | -10.00 |
| VERITASKAP | 1.80 | -10.00 |
For more detailed analysis,
- On InfoWARE Market Data Terminal <TOPG> <GO>
- On InfoWARE Finance Mobile App ( Android, iPhone & iPad and Windows 10) , "Top Gainers & Losers"
Currency Market
In the currency market, the Naira fell 0.05%(-0.79) against the Dollar to settle at 1 to 1NSE: Bull Signal - Price crossed above 15 Day MA
This signal implies these stocks are under buying pressure and the price might continue to rise and therefore positions should be monitored closely. Further suggested analysis include looking at the overall market (ASI) to see if the uptrend is market wide, sector wide or specific to the stock. Portfolio managers tend to use this as a signal to do more research to add to their positions or lock in some profits. Typically further analysis should be done using commands like PC and RV on the InfoWARE Market Data Terminal. Another command is ALERTS to set price triggers for possible exit or entry as necessary
For more detailed analysis,
- On InfoWARE Market Data Terminal <NSEPERF> <GO>
- On InfoWARE Finance Mobile App ( Android , iPhone & iPad and Windows 10) , "Top Gainers & Losers"
| Symbol | Price | %Chg | 15DMA | PE | EPS | DivY | MktCap | Vol | Trades | Value | LstTradeTime |
|---|---|---|---|---|---|---|---|---|---|---|---|
| FGS202770 | 130.00 | 23.08 | 102.00 | 0.00 | 0.00 | 1.00 | 1.00 | 1.30K | 21-Aug-2025 14:31:29.213 | ||
| VSPBONDETF | 270.95 | 20.65 | 261.54 | 0.00 | 0.00 | 1.02K | 5.00 | 280.69K | 21-Aug-2025 14:31:38.640 | ||
| NSLTECH | 1.05 | 8.57 | 0.99 | 0.00 | 0.00 | 15.87 | 5.91B | 6.31M | 198.00 | 6.52M | 21-Aug-2025 14:31:38.320 |
| FGSUK2033S6 | 99.80 | 4.81 | 98.07 | 0.00 | 0.00 | 6.00K | 5.00 | 5.99M | 21-Aug-2025 14:31:41.863 | ||
| VETBANK | 16.05 | 4.36 | 15.63 | 0.00 | 0.00 | 700.00 | 1.00 | 11.24K | 21-Aug-2025 14:31:38.607 | ||
| ACADEMY | 9.00 | 0.00 | 8.96 | 0.00 | 0.00 | 3.51 | 6.80B | 161.65K | 51.00 | 1.39M | 21-Aug-2025 14:30:49.437 |
NSE: BEAR Signal - Price crossed below 15 Day MA
This signal implies these stocks are under selling pressure and the price might continue to slide and therefore positions should be monitored closely. Further suggested analysis include looking at the overall market (ASI) to see if the downtrend is market wide, sector wide or specific to the stock. If the overal market trend is upwards, then since these stocks are heading in the opposite direction, then further analysis should be done using commands like PC and RV on the InfoWARE Market Data Terminal. Another command is ALERTS to set price triggers for possible exit is necessar
For more detailed analysis,
- On InfoWARE Market Data Terminal <BEARM> <GO>
- On InfoWARE Finance Mobile App ( Android , iPhone & iPad and Windows 10)
| Symbol | Price | %Chg | 15DMA | PE | EPS | DivY | MktCap | Vol | Trades | Value | LstTradeTime |
|---|---|---|---|---|---|---|---|---|---|---|---|
| STERLINGNG | 7.60 | -2.63 | 7.74 | 15.75 | 0.30 | 3.19 | 218.81B | 6.57M | 301.00 | 49.99M | 21-Aug-2025 14:30:51.670 |
| AFRIPRUD | 15.25 | -4.26 | 15.72 | 19.57 | 0.61 | 1.27 | 30.50B | 2.35M | 176.00 | 36.37M | 21-Aug-2025 14:30:49.527 |
| CAVERTON | 7.00 | -4.29 | 7.03 | 1.15 | 1.57 | 5.52 | 23.45B | 2.08M | 114.00 | 14.68M | 21-Aug-2025 14:30:49.897 |
| NGXINS | 1,211.26 | -4.92 | 1,260.14 | 10.41 | 2.09 | 0.00 | 0.00 | 153.37M | 2,974.00 | 419.53M | 21-Aug-2025 14:31:29.943 |
| VETGRIF30 | 50.00 | -5.00 | 51.76 | 0.00 | 0.00 | 17.15K | 5.00 | 866.35K | 21-Aug-2025 14:31:38.623 | ||
| LEGENDINT | 5.70 | -5.26 | 5.87 | 0.00 | 0.00 | 1.72M | 59.00 | 9.61M | 21-Aug-2025 14:31:38.313 | ||
| UNIVINSURE | 1.11 | -8.11 | 1.12 | 0.00 | 0.00 | 0.00 | 17.76B | 32.93M | 424.00 | 36.96M | 21-Aug-2025 14:31:38.350 |
| FTNCOCOA | 6.00 | -10.50 | 6.30 | 0.00 | 0.00 | 1.60 | 23.40B | 4.34M | 238.00 | 26.54M | 21-Aug-2025 14:31:38.290 |
| REGALINS | 1.22 | -10.66 | 1.28 | 4.35 | 0.11 | 6.52 | 8.14B | 5.67M | 143.00 | 7.05M | 21-Aug-2025 14:30:51.423 |
| SOVRENINS | 2.41 | -10.79 | 2.69 | 27.95 | 0.03 | 3.75 | 27.39B | 18.27M | 142.00 | 44.13M | 21-Aug-2025 14:30:51.503 |
| JBERGER | 132.90 | -11.06 | 137.09 | 16.73 | 10.31 | 1.74 | 212.64B | 304.16K | 90.00 | 40.43M | 21-Aug-2025 14:30:50.540 |
| BUACEMENT | 151.80 | -11.07 | 166.71 | 0.00 | 0.00 | 2.11 | 5,140.61B | 422.21K | 247.00 | 64.10M | 21-Aug-2025 14:30:49.830 |
| THOMASWY | 3.33 | -11.11 | 3.53 | 0.00 | 0.00 | 1.05 | 732.60M | 503.48K | 17.00 | 1.68M | 21-Aug-2025 14:30:51.723 |
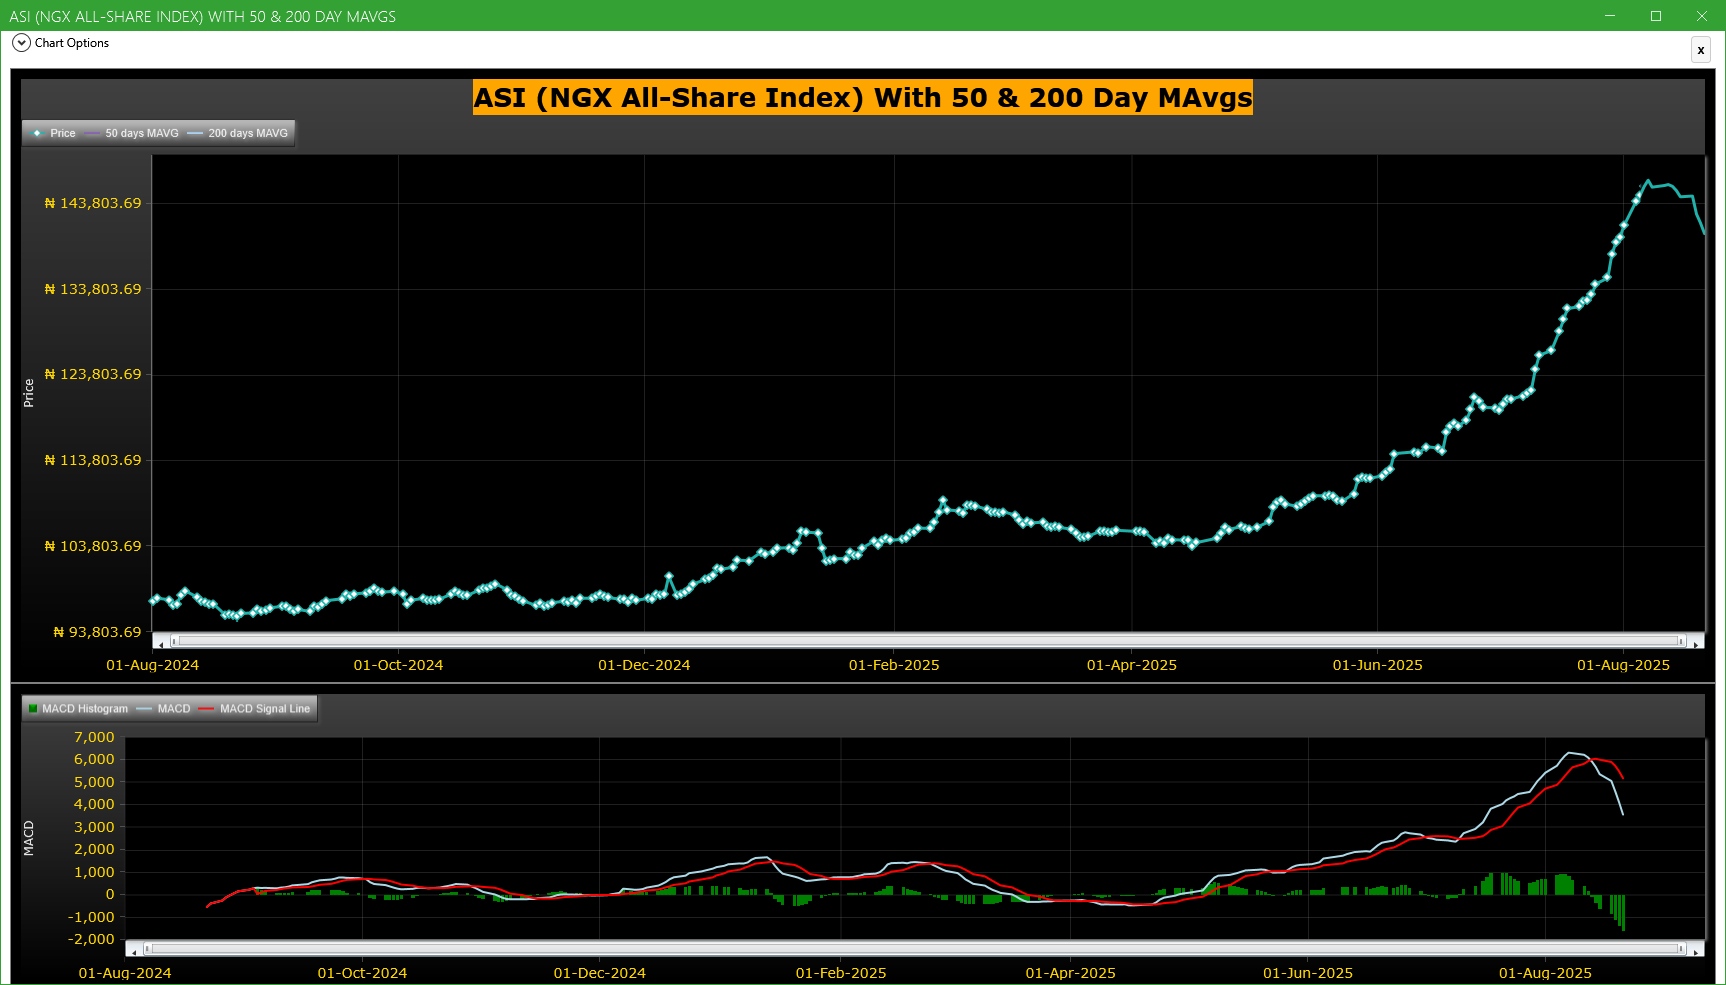
Market Trend - ASI (NGX All-Share-Index) With 50 & 200 Day MAvgs Chart
Technical traders typically use the 50 & 200 day moving averages to aid in choosing
where to enter or exit a position, which then causes these levels to act as strong
support or resistance. As a general guideline, if the price is above a moving average,
the trend is up. If the price is below a moving average, the trend is down.
It is important to note that critics of technical analysis say that moving averages act
as support and resistance because so many traders use these indicators to inform their
trading decisions. Also moving averages tend to work quite well in strong trending conditions
but poorly in choppy or ranging conditions.
Trading Strategies: Crossovers
Crossovers are one of the main moving average strategies. The first type is a price crossover,
which is when the price crosses above or below a moving average to signal a potential change
in trend. Another strategy is to apply two moving averages to a chart: one longer and one
shorter. When the shorter-term MA crosses above the longer-term MA, it is a buy signal, as
it indicates that the trend is shifting up. This is known as a golden cross. Meanwhile, when
the shorter-term MA crosses below the longer-term MA, it is a sell signal, as it indicates that
the trend is shifting down. This is known as a dead/death cross
For more detailed analysis,
- On InfoWARE Market Data Terminal <CI> <GO>
- On InfoWARE Finance Mobile App ( Android , iPhone & iPad and Windows 10) , "Research"
Unusual Volume: Volume traded is more than double the 90 day moving average (All exchanges; ASI & ASem). For more detailed analysis,
- On InfoWARE Market Data Terminal <UV> <GO>
- On InfoWARE Finance Mobile App ( Android , iPhone & iPad and Windows 10)
| Symbol | Name | Volume | 90DAvgVol | %VolChg | Price | LClose | %Chg | Trades | Value |
|---|---|---|---|---|---|---|---|---|---|
| STANBIC | STANBIC IBTC HOLDINGS PLC | 11.34M | 2.62M | 333.22 | 94.50 | 95.00 | -0.53 | 238 | 1.07B |
| DEAPCAP | DEAP CAPITAL MANAGEMENT & TRUST PLC | 11.33M | 4.33M | 161.44 | 1.80 | 1.75 | 2.86 | 146 | 18.94M |
| MULTIVERSE | MULTIVERSE PLC | 846.96K | 383.85K | 120.65 | 11.00 | 11.10 | -0.90 | 84 | 9.36M |
| TRANSEXPR | TRANS-NATIONWIDE EXPRESS PLC. | 158.32K | 22.34K | 608.77 | 2.15 | 2.15 | 0.00 | 7 | 328.97K |
| NCR | NCR (NIGERIA) PLC. | 141.00K | 48.76K | 189.17 | 9.55 | 9.55 | 0.00 | 17 | 1.48M |
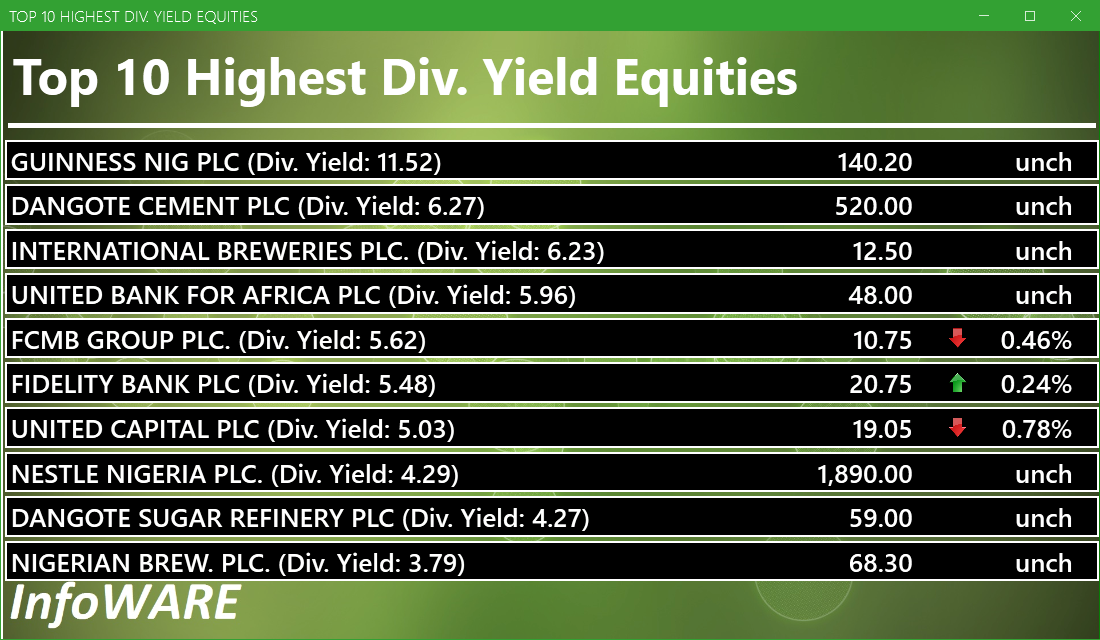
Investment Insights - High Div. Stocks
Dividend stocks distribute a portion of the company earnings to investors on a regular basis and they can a great choice for investors looking for regular income. As an investment or trading strategy, high dividend yield equities provide annual cash payments as against mostly capital gains in the price of a stock. The list in the table below represent the highest dividend paying stocks from the list of the most liquid stocks in the NSE top 30.
For more detailed analysis,
- On InfoWARE Market Data Terminal <HYIELD> <GO>
- On InfoWARE Finance Mobile App ( Android , iPhone & iPad and Windows 10) , "Research"
African Markets
| Name | LClose | Change | %Chg |
|---|---|---|---|
| BRVM Stock Exchange | 317.30 | -0.41 | -0.13 |
| Botswana Stock Exchange | 10,559.33 | 6.33 | 0.06 |
| Egyptian Exchange | 35,731.83 | -368.22 | -1.02 |
| Lusaka Stock Exchange | 22,742.55 | 56.71 | 0.25 |
| Malawi Stock Exchange | 465,363.88 | 1,854.04 | 0.40 |
| Nigeria Stock Exchange | 141,566.30 | -1,041.03 | -0.73 |
| Nairobi Securities Exchange | 167.75 | 1.56 | 0.94 |
| Rwanda Stock Exchange | 178.88 | -0.11 | -0.06 |
| Uganda Securities Exchange | 1,410.04 | 5.20 | 0.37 |
Nigeria Market Indexes
| Symbol | LClose | %Chg | WTD% | MTD% | QTD% | YTD% | MktCap | Trades |
|---|---|---|---|---|---|---|---|---|
| ASI | 140,332.44 | -0.87 | -3.03 | -0.66 | 17.20 | 36.01 | 22,396 | |
| NGX30 | 5,121.03 | -0.85 | -2.92 | -1.24 | 8.41 | 34.24 | 11,173 | |
| NGXAFRBVI | 3,561.42 | 0.66 | -3.56 | -6.62 | 0.51 | 43.56 | 4,280 | |
| NGXAFRHDYI | 22,380.92 | -1.56 | -4.55 | -3.63 | 7.01 | 31.44 | 5,257 | |
| NGXASEM | 1,538.10 | 0.00 | 0.00 | 6.34 | -3.57 | -2.88 | 4 | |
| NGXBNK | 1,534.60 | 0.47 | -2.80 | -5.21 | 1.58 | 41.12 | 5,661 | |
| NGXCG | 4,075.79 | 0.02 | -2.73 | -5.25 | 18.53 | 44.06 | 10,091 | |
| NGXCNSMRGDS | 3,184.70 | -0.04 | -1.39 | 6.99 | -8.19 | 83.62 | 2,721 | |
| NGXCOMMDTY | 1,070.07 | 0.00 | 0.00 | -2.36 | 2.18 | 7.00 | 1,360 | |
| NGXGROWTH | 11,419.86 | 2.34 | 2.59 | 3.18 | 20.09 | 47.11 | 287 | |
| NGXINDUSTR | 4,996.39 | -4.04 | -8.24 | -1.17 | 41.83 | 39.89 | 1,441 | |
| NGXINS | 1,211.26 | -4.69 | -14.97 | 36.56 | 63.99 | 54.07 | 2,974 | |
| NGXLOTUSISLM | 11,559.96 | -0.56 | -2.73 | -0.57 | 20.74 | 65.90 | 3,447 | |
| NGXMAINBOARD | 6,778.87 | -1.00 | -2.38 | 2.11 | 14.92 | 35.47 | 16,728 | |
| NGXMERIGRW | 9,948.84 | 0.40 | -2.31 | -3.50 | 3.07 | 52.51 | 2,878 | |
| NGXMERIVAL | 13,802.48 | -0.07 | -2.05 | -4.98 | 15.52 | 32.33 | 4,196 | |
| NGXOILGAS | 2,384.21 | -0.06 | -0.63 | -2.15 | -0.33 | -12.06 | 1,291 | |
| NGXPENBRD | 2,594.87 | -0.90 | -3.08 | -0.43 | 12.85 | 41.67 | 16,971 | |
| NGXPENSION | 6,666.43 | -0.23 | -2.50 | -3.59 | 4.91 | 47.03 | 11,767 | |
| NGXPREMIUM | 13,971.21 | -0.71 | -4.22 | -5.38 | 21.81 | 43.55 | 4,890 | |
| NGXSOVBND | 659.52 | 0.00 | -1.78 | -1.98 | 0.92 | 9.64 | 0 |
For more detailed analysis,
- On InfoWARE Market Data Terminal <MKTINS> <GO>
- On InfoWARE Finance Mobile App ( Android, iPhone & iPad and Windows 10) , "Market Indexes"
Find the topic interesting? Will like to comment? Contact Us at solutions@infowarelimited.com
Top News

Chart Of The Day - ASI Chart Vs ASI Advance Decline Line (YTD) (21-Aug-2025 15:11:30.581)
InfoWARE AI Analyst Daily Market Report: 21-Aug-2025

[XNSA]>> APPOINTMENT OF A DIRECTOR
[XNSA]>> DAILY FUND PRICE SUBMISSION - FCMB ASSET MANAGEMENT LIMITED
[XNSA]>> NGX FIXED INCOME INDICATIVE PRICE LIST FOR AUGUST 21, 2025
[VETBANK]>> DAILY INDICATIVE PRICES
[XNSA]>> CORDROS MILESTONE FUNDS' BID & OFFER PRICES
[XNSA]>> REGISTRATION FOR BATCH TWO- 2025 DEALING CLERKSHIP CERTIFICATION PROGRA
[XNSA]>> NGX NON-INTEREST FINANCE BOARD LAUNCH COMMUNIQUE
[XNSA]>> UPDATED- SAVE THE DATE: 29TH ANNUAL STOCKBROKERS CONFERENCE
[SIAMLETF40]>> DAILY INDICATIVE PRICES
Chart Of The Day - ASI Chart Vs ASI Advance Decline Line (YTD) (20-Aug-2025 15:07:17.943)
InfoWARE AI Analyst Daily Market Report: 20-Aug-2025
[PZ]>>Notice of Meeting -<P Z CUSSONS NIGERIA PLC.>
[CHAMPION]>>Corporate Disclosures-<CHAMPION BREW. PLC.>
[VETINDETF]>> DAILY INDICATIVE PRICES
[MERGROWTH]>> DAILY INDICATIVE PRICES
[XNSA]>> CORDROS MILESTONE FUNDS' BID & OFFER PRICES
[XNSA]>> REGISTRATION FOR BATCH TWO- 2025 DEALING CLERKSHIP CERTIFICATION PROGRA
[XNSA]>> NGX NON-INTEREST FINANCE BOARD LAUNCH COMMUNIQUE
[XNSA]>> UPDATED- SAVE THE DATE: 29TH ANNUAL STOCKBROKERS CONFERENCE
[XNSA]>> RESIGNATION OF MANAGING DIRECTOR (SUPRA COMMERCIAL TRUST LIMITED)
[XNSA]>> RESIGNATION OF DIRECTORS (PREMIUM CAPITAL AND STOCKBROKERS LIMITED)
Chart Of The Day - ASI Chart Vs ASI Advance Decline Line (YTD) (19-Aug-2025 15:07:20.125)
InfoWARE AI Analyst Daily Market Report: 19-Aug-2025
[XNSA]>> CORDROS MILESTONE FUNDS' BID & OFFER PRICES
[XNSA]>> NGX FIXED INCOME INDICATIVE PRICE LIST FOR AUGUST 15, 2025
[MERGROWTH]>> DAILY INDICATIVE PRICES
[VSPBONDETF]>> DAILY INDICATIVE PRICES
[JAIZBANK]>>Corporate Disclosures-<JAIZ BANK PLC>
Get IDIA - the stock trading app for the modern investor
Solutions by Business
Product Suites
Company
Contacts
- 8th Floor,
- South Atlantic Petroleum Towers,
- 1 Adeola Odeku Street,
- Victoria Island,
- Lagos, Nigeria.
- Email: solutions@infowarelimited.com
Follow Us
 |
 |
 |
 |