


InfoWARE AI Analyst Daily Market Report: 19-Sep-2025 | InfoWARE Finance
Get IDIA - the stock trading app for the modern investor


InfoWARE AI Analyst Daily Market Report: 19-Sep-2025
(Source: InfoWARE Terminal, Date: 19-Sep-2025)
Dear Investor,
NGX Daily Market Summary & Analysis – Friday, September 19, 2025
The Nigerian stock market closed the week on a bearish note, with the NGX All Share Index (ASI) slipping -0.29% to settle at 142,263.07. Despite this dip, YTD returns remain an impressive 37.47%. Today's trading session stood out for its surging market turnover—value spiked by 247.28% to ₦12.26B, and volumes more than doubled to 404.01M shares (up from 154.13M). However, market breadth was decidedly negative at 0.36x, as decliners overwhelmed advancers 44 to 16. The specter of profit-taking and caution was evident, with banking sector heavyweights like UBA and ZENITHBANK attracting outsized volume and significant institutional participation. Naira's mild 0.01% depreciation against the dollar underlines persistent FX volatility.
Key Trends & Market Breadth
- Market Breadth: Staunchly bearish, as only 16 advancers battled against 44 decliners—one of the weakest breadth readings YTD. This broad-based selloff signals profit-taking and a possible short-term sentiment shift.
-
Breadth Signals:
- Volume rose in 74 stocks, fell in 65—suggesting selective rotation rather than outright panic dumping.
- Highest retail/institutional trade divergence so far this quarter (see activity breakdown).
Top 5 Gainers & Losers
| Symbol | Name | % Change | RSI | MACD | 15MA vs 50MA |
|---|---|---|---|---|---|
| DEAPCAP | DEAP CAPITAL MANAGEMENT & TRUST PLC | +9.94% | 52 | 0.06 | Bullish crossover |
| SOVRENINS | SOVEREIGN TRUST INSURANCE PLC | +7.67% | 53 | 0.16 | Bullish crossover |
| NB | NIGERIAN BREW. PLC. | +6.37% | 53 | 0.44 | Bullish crossover |
| NEWGOLD | NEWGOLD EXCHANGE TRADED FUND | +5.63% | 49 | 55.03 | Bullish crossover |
| LIVINGTRUST | LIVINGTRUST MORTGAGE BANK PLC | -10.00% | 57 | 0.02 | Bearish crossover |
| VERITASKAP | VERITAS KAPITAL ASSURANCE PLC | -9.91% | 55 | 0.11 | Bearish crossover |
| NSLTECH | SECURE ELECTRONIC TECHNOLOGY PLC | -8.54% | 48 | -0.03 | Bearish crossover |
| NGXGROUP | NIGERIAN EXCHANGE GROUP | -8.32% | 51 | -0.21 | Bearish crossover |
| UCAP | UNITED CAPITAL PLC | -7.56% | 54 | 0.20 | Bearish crossover |
- Gainers: DEAPCAP, SOVRENINS, NB, and NEWGOLD led with strong double-digit and high single-digit gains, all confirming bullish technical crossovers (price above 15DMA, positive MACD). Notably, SOVRENINS is also present in the 5-day and YTD top gainers.
- Losers: LIVINGTRUST, VERITASKAP, NSLTECH, NGXGROUP, and UCAP suffered steep losses. Both NSLTECH and NGXGROUP appear in both YTD and daily loser tables—indicating persistent weakness.
Insights & Predictions
- Turnover Surge: A massive jump of 247% in market turnover points to heightened institutional activity and rebalancing. This often precedes trend reversals or strong sector rotations.
- Advancer/Decliner Trend: The widespread dip—despite higher turnover—suggests that institutions may have actively taken profits or reallocated capital to safer plays.
-
Unusual Volume:
- UBA traded 239.85% of its average 90-day volume, with a price drop of -5.96%, hinting at possible wholesale exits or rotation out of the name—this may signal either capitulation or emerging value.
- AUSTINLAZ volume was 354% above norm, yet suffered a -2% drop, indicating retail-driven volatility rather than strong fundamental conviction.
-
Momentum Trends:
- Bullish Momentum: DEAPCAP, SOVRENINS, NB, and NEWGOLD—price above 15DMA, with reinforcing MACD and moderate RSI (not overbought). Particularly, SOVRENINS and NB could see further inflows as these trends develop.
- Bearish Momentum: Multiple leading names (ACCESSCORP, UBA, UCAP, NGXGROUP) have broken below 15DMA, with neutral-to-weak RSI. NGXGROUP appears on all daily, YTD, and technical breakdown lists—caution warranted here.
- Banks Under Pressure: Most top institutional trades (UBA, ZENITHBANK, ACCESSCORP, GTCO) logged negative price action, despite drawing majority trade value and volume. Heightened volatility and volume here suggest caution for swing traders.
- YTD Leaders: GUINNESS (+161.8%), ACADEMY (+204.8%), CHELLARAM (+294.6%), and SOVRENINS (+137.7%)—all consistently strong, with GUINNESS and SOVRENINS maintaining high RSIs and positive technicals; momentum investors may still find value here.
- YTD Laggards: GREENWETF, OMATEK, CHAMS, CILEASING, NSLTECH, SUNUASSUR, and NGXGROUP—all of which continue their downward slides, some with fresh technical breakdowns and neutral-to-weak RSI readings.
Contrarian Signals
- CHAMPION: RSI at 54.4 (neutral), but price -9.8% YTD and now below 15DMA, with mildly bullish MACD. Contradictory technicals—monitor for mean-reversion bounce or further breakdown.
- VERITASKAP: Appearing as both a top loser -9.9% (today), yet maintaining an RSI near 55 and a positive MACD—possible oversold bounce candidate if institutional selling abates.
Sector Heatmap & Technicals
| Sector | Top Performer | %Chg | Underperformer | %Chg | Institutional Activity |
|---|---|---|---|---|---|
| Banking | ETI | +1.37% | UBA | -5.96% | ZENITHBANK (Share: 20.17%) |
| Insurance | SOVRENINS | +7.67% | VERITASKAP | -9.91% | N/A |
| ETF | NEWGOLD | +5.63% | STANBICETF30 | -7.67% | N/A |
| Beverages | NB | +6.37% | CHAMPION | -3.13% | N/A |
Dividend Yield vs. Beta Matrix
| Symbol | Name | Div. Yield | Beta | Momentum Status |
|---|---|---|---|---|
| SOVRENINS | SOVEREIGN TRUST INSURANCE PLC | 3.75% | 1.12 | Bullish (Price > 15DMA, MACD+) |
| AFRIPRUD | (Example) | 1.27% | 0.64 | Stable/Defensive |
| JAIZBANK | JAIZ BANK PLC | 1.67% | 1.14 | Bearish (Price < 15DMA) |
| CHAMPION | CHAMPION BREW. PLC. | 0.41% | 0.16 | Mixed, see Contrarian |
- High yielders like SOVRENINS display momentum-buoyed uptrends, making them attractive for both growth and income-focused portfolios.
- Low beta, high dividend stocks (AFRIPRUD) offer relative defense, especially if volatility rises.
- Banks like JAIZBANK, despite strong yields, currently show bearish momentum—caution advised for yield-chasers.
Institutional Clustering & Alerts
- ZENITHBANK captured over 20% institutional trade value—strong evidence of fund flows/crowded trades. Monitor for reversal risk if profit-taking accelerates.
- UBA and ACCESSCORP also dominated institutional turnover, both coinciding with sharp price declines on high volume—potential signs of rotation out of tier-1 banks.
Market Activity/Trades Analysis
- Institutionals drove 66.15% of volume and 85.99% of value with only 38.07% of trades—clear signs of large block rebalancing versus more fragmented retail flow (61.9% of trades, but just 14% of value).
-
Top 5 Most Traded (Institutional):
- UBA - ~17.5% volume share (Price: -5.96%)
- ZENITHBANK - 5.9% volume (Price: -3.03%)
- ACCESSCORP - 5.8% (Price: -4.07%)
- GTCO - 1.8% (Minor impact, Price: -0.74%)
- MTNN - 0.24% (Flat pricing)
-
Top 5 Most Traded (Retail):
- UBA - 1.5%
- ZENITHBANK - 0.6%
- ACCESSCORP - 1.1%
- GTCO - 0.2%
- MTNN - 0.04%
- Insight: Both retail and institutionals crowded into top-tier banks, but institutional sell pressure led major declines in UBA, ACCESSCORP, and ZENITHBANK, amplifying intraday volatility—this pattern suggests a tactical retreat by the "smart money."
Suggestions & Tactical Opportunities
- Bullish names above 15DMA with momentum (e.g., DEAPCAP, SOVRENINS, NB, NEWGOLD) are potential short-term momentum plays but monitor for profit booking as technicals reach overbought levels.
- Banks: While currently under squeeze, stocks like UBA and ACCESSCORP may offer value as selling exhausts—but wait for RSI < 40 and a bullish MACD reversal.
- High dividend, low beta stocks: E.g., SOVRENINS (momentum + yield), AFRIPRUD offer defensive posture if overall volatility picks up.
- Avoid fresh entries into persistent YTD losers with technical breakdowns (e.g., GREENWETF, OMATEK, NGXGROUP) until reversal signals appear.
- Watch for sector rotation: The defensive strength in insurance and ETFs (NEWGOLD) suggest a cautious sentiment shift.
YTD Top 5 Gainers & Losers
| Top 5 YTD Gainers | Top 5 YTD Losers | ||||||||||
|---|---|---|---|---|---|---|---|---|---|---|---|
| Symbol | Name | Price | %ChgYTD | RSI | DivYield | Symbol | Name | Price | %ChgYTD | RSI | DivYield |
| ACADEMY | ACADEMY PRESS PLC. | 9.54 | +204.76% | 54 | 3.51% | GREENWETF | GREENWICH ASSET ETF | 230.45 | -56.74% | 44 | 0.00% |
| CHELLARAM | CHELLARAMS PLC. | 14.60 | +294.59% | 64 | 1.99% | OMATEK | OMATEK VENTURES PLC | 1.10 | -64.51% | 45 | 0.00% |
| GUINNESS | GUINNESS NIG PLC | 176.00 | +161.78% | 63 | 11.52% | CHAMS | CHAMS PLC | 3.28 | -47.62% | 55 | 1.56% |
| SOVRENINS | SOV. TRUST INSURANCE | 2.87 | +137.69% | 151 | 3.75% | CILEASING | C & I LEASING PLC. | 6.60 | -51.45% | 50 | 1.20% |
| MULTIVERSE | MULTIVERSE PLC | 13.95 | +73.29% | 61 | 0.85% | SUNUASSUR | SUNU ASSUR NIG. PLC. | 5.70 | -53.91% | 52 | 0.99% |
Hidden Insights & Nuanced Patterns:
- Sectoral divergence: Banks draw institutional flows but also heavy selling—possible reshuffle into Insurance and defensive ETFs (NEWGOLD).
- Momentum/yield overlap: SOVRENINS is top gainer with high yield and positive technicals – an unusually powerful confluence.
- Contrarian alert: CHAMPION, with neutral RSI and a mix of bullish and bearish signals, may be near a mean-reversion inflection.
- Overlapping weak stocks: NGXGROUP, NSLTECH, and SUNUASSUR show up in both daily and YTD loser lists, and technical breakdown tables – high-risk, avoid until confirmed reversals.
- Unusual volume spikes: UBA and AUSTINLAZ – heavy volume on down days, watch for either final capitulation or "smart money” entry point signals on stabilization.
Trader Notes:
- Momentum traders: Ride SOVRENINS and NB while technicals hold, but take profits into strength.
- Value/income investors: Monitor for entry into defensive high-yielders if market volatility rises further.
- Contrarians: Build watchlists for sharp-reversal candidates like CHAMPION and VERITASKAP (buy only on confirmed MACD and RSI improvements).
- Sector rotation: Defensive sectors (Insurance, ETFs) are attracting capital, while banks remain under pressure—wait for clearer reversal signals before bottom-fishing.
For deeper dives into stock technicals, market heatmaps, and unusual trading patterns, leverage advanced charting and analytics on the InfoWARE Market Data Terminal.
|
Top ASI Gainers Over Last 5 Trading Days
|
Top ASI Losers Over Last 5 Trading Days
|
For more detailed analysis, on InfoWARE Market Data Terminal <NSEPERF> <GO>
On InfoWARE Finance Mobile App (Android, iPhone & iPad, Windows Phone and Windows 8/10), "Top Gainers & Losers"
DEAP CAPITAL MANAGEMENT & TRUST PLC (DEAPCAP) topped the advancers list closing at N1.88 with a gain of 9.94% followed by STANBIC IBTC ETF 30 (STANBICETF30) which closed at N419.90 with a gain of 7.67%.
On the flip side LIVINGTRUST MORTGAGE BANK PLC (LIVINGTRUST) and VERITAS KAPITAL ASSURANCE PLC (VERITASKAP) topped the decliners log with a loss of -10.00% at a close of N4.77, and -9.91% to close the day at N2.00 respectively.
| Symbol | LClose | %Chg |
|---|---|---|
| DEAPCAP | 1.88 | 9.94 |
| STANBICETF30 | 419.90 | 7.67 |
| SOVRENINS | 3.09 | 7.67 |
| NB | 75.95 | 6.37 |
| NEWGOLD | 54,000.00 | 5.63 |
| Symbol | LClose | %Chg |
|---|---|---|
| LIVINGTRUST | 4.77 | -10.00 |
| VERITASKAP | 2.00 | -9.91 |
| NSLTECH | 0.75 | -8.54 |
| NGXGROUP | 55.10 | -8.32 |
| UCAP | 18.95 | -7.56 |
For more detailed analysis,
- On InfoWARE Market Data Terminal <TOPG> <GO>
- On InfoWARE Finance Mobile App ( Android, iPhone & iPad and Windows 10) , "Top Gainers & Losers"
Currency Market
In the currency market, the Naira fell 0.01%(-0.21) against the Dollar to settle at 1 to 1Investment Insights - Top 5 Gainers YTD
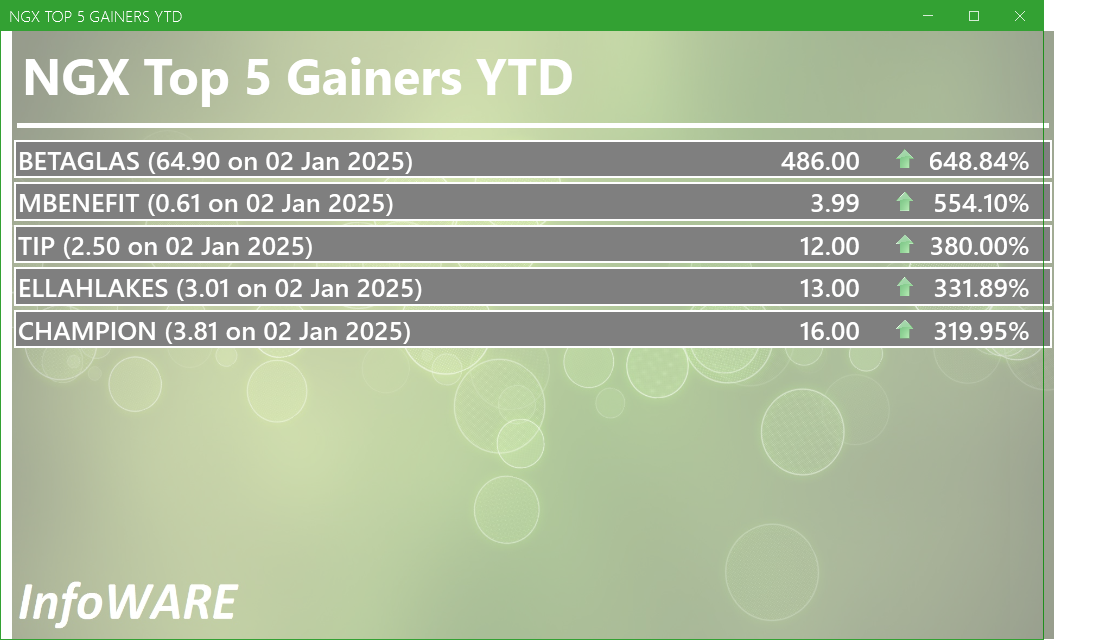
These stocks are the best performers whose price has risen faster than the market as a whole with the best returns year to date. Momentum investors believe that stocks that have outperformed the market will often continue to do so because the factors that caused them to outperform will not suddenly disappear. In addition, other investors seeking to benefit from the stock’s outperformance will often purchase the stock, further bidding its price higher and pushing the stock higher still
For more detailed analysis,
- On InfoWARE Market Data Terminal <T5YTD2> <GO>
- On InfoWARE Finance Mobile App ( Android , iPhone & iPad and Windows 10) , "Research"
NSE: Bull Signal - Price crossed above 15 Day MA
This signal implies these stocks are under buying pressure and the price might continue to rise and therefore positions should be monitored closely. Further suggested analysis include looking at the overall market (ASI) to see if the uptrend is market wide, sector wide or specific to the stock. Portfolio managers tend to use this as a signal to do more research to add to their positions or lock in some profits. Typically further analysis should be done using commands like PC and RV on the InfoWARE Market Data Terminal. Another command is ALERTS to set price triggers for possible exit or entry as necessary
For more detailed analysis,
- On InfoWARE Market Data Terminal <NSEPERF> <GO>
- On InfoWARE Finance Mobile App ( Android , iPhone & iPad and Windows 10) , "Top Gainers & Losers"
| Symbol | Price | %Chg | 15DMA | PE | EPS | DivY | MktCap | Vol | Trades | Value | LstTradeTime |
|---|---|---|---|---|---|---|---|---|---|---|---|
| FGS202772 | 130.00 | 10.62 | 117.12 | 0.00 | 0.00 | 500.00 | 1.00 | 650.00K | 19-Sep-2025 14:30:16.503 | ||
| DEAPCAP | 1.88 | 9.04 | 1.74 | 188.84 | 0.01 | 13.76 | 2.82B | 3.98M | 87.00 | 7.17M | 19-Sep-2025 14:30:11.750 |
| STANBICETF30 | 419.90 | 7.12 | 410.19 | 0.00 | 0.00 | 4.02K | 10.00 | 1.58M | 19-Sep-2025 14:30:29.140 | ||
| SOVRENINS | 3.09 | 7.12 | 2.92 | 27.95 | 0.03 | 3.75 | 35.12B | 15.30M | 96.00 | 46.03M | 19-Sep-2025 14:30:13.287 |
| NEWGOLD | 54,000.00 | 5.33 | 53,554.76 | 0.00 | 0.00 | 0.00 | 0.00 | 1.00 | 1.00 | 54.00K | 19-Sep-2025 14:30:29.113 |
| FGSUK2033S6 | 98.00 | 3.05 | 97.29 | 0.00 | 0.00 | 15.00K | 1.00 | 14.70M | 19-Sep-2025 14:30:32.220 | ||
| ETI | 36.50 | 1.37 | 36.08 | 5.00 | 5.10 | 2.00 | 669.76B | 3.16M | 123.00 | 113.73M | 19-Sep-2025 14:30:11.890 |
| PZ | 34.85 | 0.00 | 34.83 | 44.17 | 0.50 | 4.59 | 138.37B | 766.37K | 84.00 | 25.28M | 19-Sep-2025 14:30:13.120 |
NSE: BEAR Signal - Price crossed below 15 Day MA
This signal implies these stocks are under selling pressure and the price might continue to slide and therefore positions should be monitored closely. Further suggested analysis include looking at the overall market (ASI) to see if the downtrend is market wide, sector wide or specific to the stock. If the overal market trend is upwards, then since these stocks are heading in the opposite direction, then further analysis should be done using commands like PC and RV on the InfoWARE Market Data Terminal. Another command is ALERTS to set price triggers for possible exit is necessar
For more detailed analysis,
- On InfoWARE Market Data Terminal <BEARM> <GO>
- On InfoWARE Finance Mobile App ( Android , iPhone & iPad and Windows 10)
| Symbol | Price | %Chg | 15DMA | PE | EPS | DivY | MktCap | Vol | Trades | Value | LstTradeTime |
|---|---|---|---|---|---|---|---|---|---|---|---|
| HONYFLOUR | 22.10 | 0.00 | 22.13 | 16.28 | 0.31 | 1.40 | 175.26B | 756.07K | 222.00 | 16.65M | 19-Sep-2025 14:30:12.190 |
| NGXPREMIUM | 13,667.57 | -0.86 | 13,762.85 | 2,048.74 | 238.70 | 0.00 | 0.00 | 142.73M | 7,419.00 | 7.95B | 19-Sep-2025 14:30:17.330 |
| FCMB | 10.70 | -0.93 | 10.75 | 104.31 | 0.09 | 5.62 | 211.89B | 6.08M | 382.00 | 63.01M | 19-Sep-2025 14:30:11.963 |
| NGXMERIGRW | 9,914.76 | -1.00 | 9,963.42 | 34.89 | 293.99 | 0.00 | 0.00 | 21.97M | 3,208.00 | 1.04B | 19-Sep-2025 14:30:17.253 |
| NGXCG | 4,036.14 | -1.13 | 4,041.99 | 443.35 | 327.97 | 0.00 | 0.00 | 205.86M | 13,070.00 | 10.20B | 19-Sep-2025 14:30:17.143 |
| NGXBNK | 1,491.31 | -1.97 | 1,512.29 | 6.10 | 34.65 | 0.00 | 0.00 | 180.62M | 7,694.00 | 6.85B | 19-Sep-2025 14:30:17.130 |
| VETBANK | 14.95 | -2.01 | 15.00 | 0.00 | 0.00 | 2.00 | 1.00 | 29.90 | 19-Sep-2025 14:30:29.150 | ||
| AUSTINLAZ | 2.91 | -2.06 | 2.92 | 0.00 | 0.00 | 0.00 | 3.14B | 2.68M | 45.00 | 7.26M | 19-Sep-2025 14:30:09.123 |
| NGXAFRHDYI | 22,370.39 | -2.90 | 22,619.94 | 7.46 | 39.30 | 0.00 | 0.00 | 130.59M | 7,144.00 | 6.63B | 19-Sep-2025 14:30:17.097 |
| NGXMERIVAL | 13,228.40 | -2.91 | 13,467.76 | 12.13 | 38.38 | 0.00 | 0.00 | 167.67M | 7,902.00 | 7.75B | 19-Sep-2025 14:30:17.267 |
| NGXAFRBVI | 3,445.76 | -2.92 | 3,515.47 | 3.14 | 35.50 | 0.00 | 0.00 | 147.97M | 6,869.00 | 6.92B | 19-Sep-2025 14:30:17.083 |
| CHAMPION | 16.00 | -3.13 | 16.30 | 412.83 | 0.01 | 0.41 | 125.27B | 1.49M | 111.00 | 23.81M | 19-Sep-2025 14:30:09.303 |
| VITAFOAM | 79.00 | -3.80 | 79.90 | 8.66 | 2.56 | 7.03 | 98.82B | 423.35K | 85.00 | 33.27M | 19-Sep-2025 14:30:13.817 |
| JAIZBANK | 4.37 | -4.12 | 4.52 | 83.05 | 0.03 | 1.67 | 150.94B | 7.44M | 509.00 | 33.30M | 19-Sep-2025 14:30:31.943 |
| ACCESSCORP | 25.90 | -4.25 | 26.37 | 8.56 | 2.81 | 1.87 | 920.62B | 29.41M | 1,404.00 | 765.24M | 19-Sep-2025 14:30:30.903 |
| CAVERTON | 6.60 | -5.30 | 6.64 | 1.15 | 1.57 | 5.52 | 22.11B | 1.76M | 73.00 | 11.96M | 19-Sep-2025 14:30:09.283 |
| SUNUASSUR | 5.37 | -6.15 | 5.64 | 0.00 | 0.00 | 0.99 | 31.20B | 1.19M | 50.00 | 6.42M | 19-Sep-2025 14:30:13.377 |
| UCAP | 18.95 | -8.18 | 19.11 | 19.15 | 0.93 | 5.03 | 113.70B | 4.98M | 278.00 | 97.27M | 19-Sep-2025 14:30:28.867 |
| NGXGROUP | 55.10 | -9.07 | 59.18 | 0.00 | 0.00 | 2.73 | 108.22B | 2.38M | 95.00 | 141.37M | 19-Sep-2025 14:30:12.830 |
| VERITASKAP | 2.00 | -11.00 | 2.09 | 48.77 | 0.02 | 4.17 | 27.73B | 10.44M | 162.00 | 22.22M | 19-Sep-2025 14:30:13.780 |
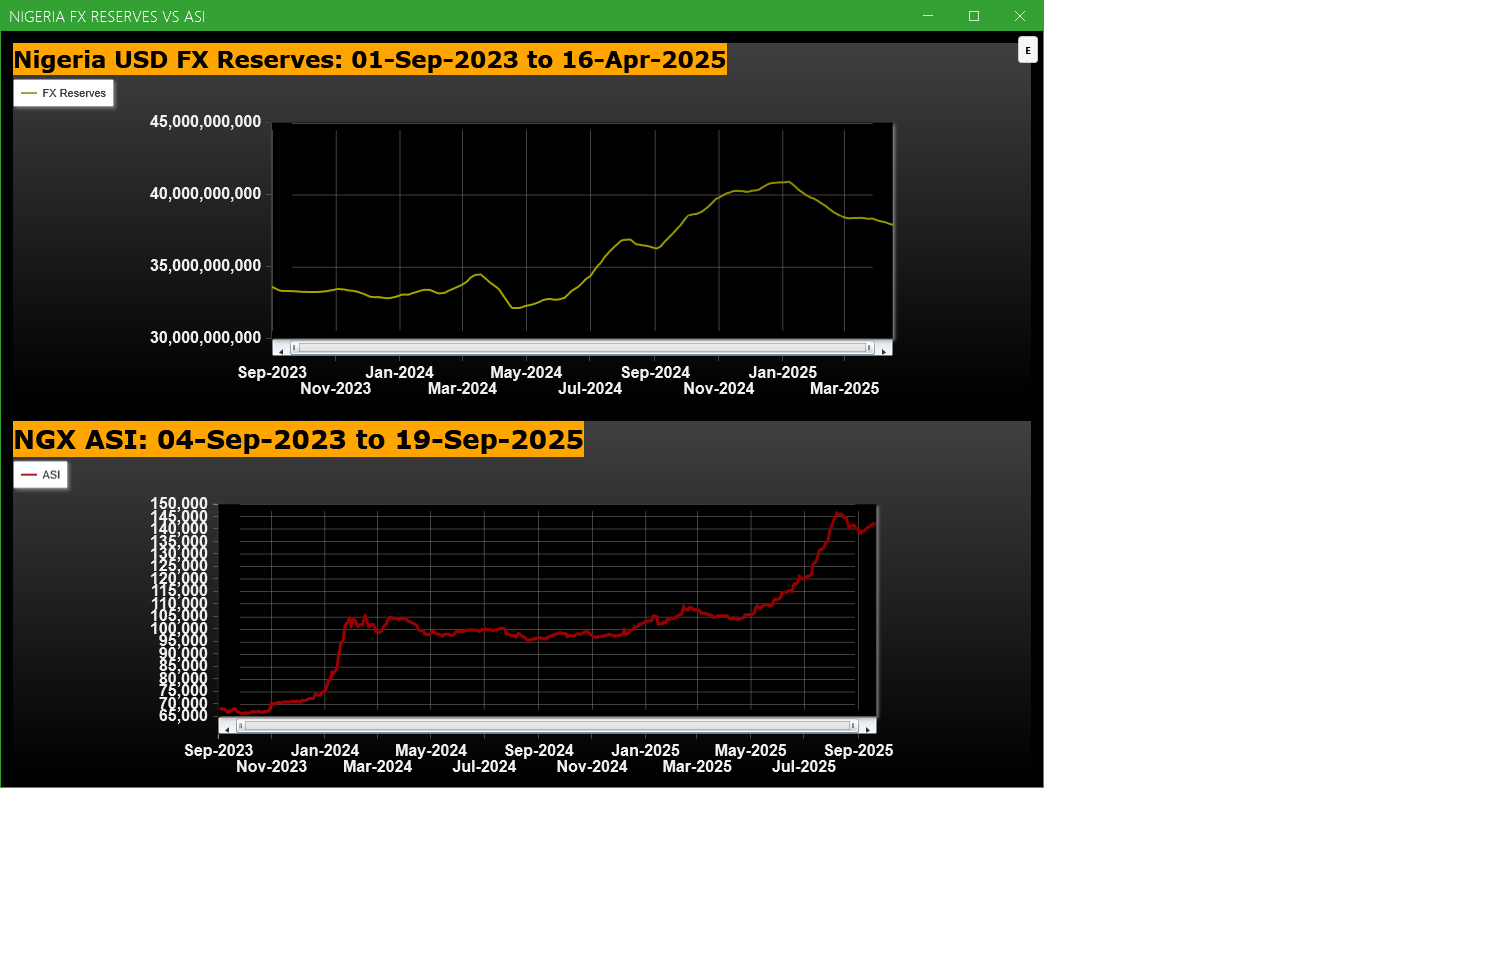
Economic Indicators - Nigeria FX Reserves Vs ASI Chart
Nigeria FX Reserves are assets held on reserve by CBN in foreign currencies. These reserves are used to back liabilities and influence monetary policy. Given the nature of the Nigeria economy, FX Reserves can appear to have an outsize influence on the economy and hence on the capital market. The chart below allows comparison of FX Reserves against the ASI to make investment decisions
For more detailed analysis,
- On InfoWARE Market Data Terminal <CI> <GO>
- On InfoWARE Finance Mobile App ( Android , iPhone & iPad and Windows 10) , "Research"
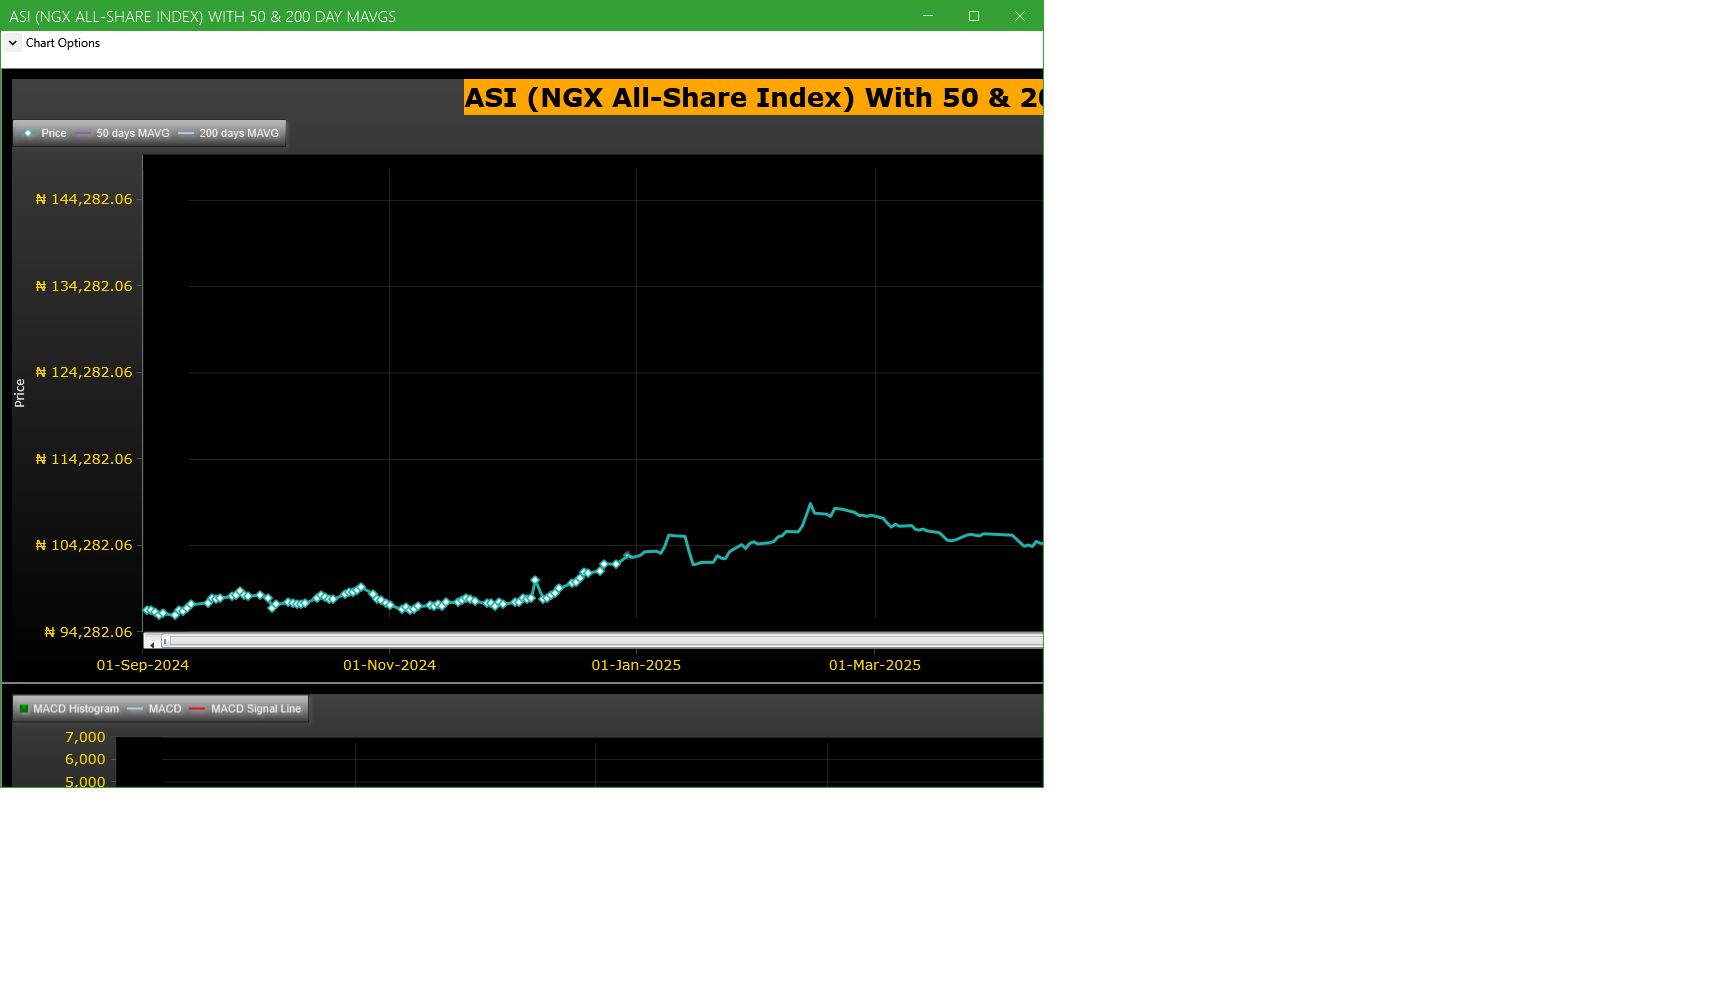
Market Trend - ASI (NGX All-Share-Index) With 50 & 200 Day MAvgs Chart
Technical traders typically use the 50 & 200 day moving averages to aid in choosing
where to enter or exit a position, which then causes these levels to act as strong
support or resistance. As a general guideline, if the price is above a moving average,
the trend is up. If the price is below a moving average, the trend is down.
It is important to note that critics of technical analysis say that moving averages act
as support and resistance because so many traders use these indicators to inform their
trading decisions. Also moving averages tend to work quite well in strong trending conditions
but poorly in choppy or ranging conditions.
Trading Strategies: Crossovers
Crossovers are one of the main moving average strategies. The first type is a price crossover,
which is when the price crosses above or below a moving average to signal a potential change
in trend. Another strategy is to apply two moving averages to a chart: one longer and one
shorter. When the shorter-term MA crosses above the longer-term MA, it is a buy signal, as
it indicates that the trend is shifting up. This is known as a golden cross. Meanwhile, when
the shorter-term MA crosses below the longer-term MA, it is a sell signal, as it indicates that
the trend is shifting down. This is known as a dead/death cross
For more detailed analysis,
- On InfoWARE Market Data Terminal <CI> <GO>
- On InfoWARE Finance Mobile App ( Android , iPhone & iPad and Windows 10) , "Research"
Unusual Volume: Volume traded is more than double the 90 day moving average (All exchanges; ASI & ASem). For more detailed analysis,
- On InfoWARE Market Data Terminal <UV> <GO>
- On InfoWARE Finance Mobile App ( Android , iPhone & iPad and Windows 10)
| Symbol | Name | Volume | 90DAvgVol | %VolChg | Price | LClose | %Chg | Trades | Value |
|---|---|---|---|---|---|---|---|---|---|
| UBA | UNITED BANK FOR AFRICA PLC | 82.05M | 24.14M | 239.85 | 44.20 | 47.00 | -5.96 | 2,479 | 3.55B |
| AUSTINLAZ | AUSTIN LAZ & COMPANY PLC | 2.68M | 590.83K | 354.18 | 2.91 | 2.97 | -2.02 | 45 | 7.26M |
| NIDF | CHAPEL HILL DENHAM NIG. INFRAS DEBT FUND | 527.68K | 227.94K | 131.50 | 113.00 | 113.00 | 0.00 | 103 | 59.63M |
| LIVINGTRUST | LIVINGTRUST MORTGAGE BANK PLC | 236.76K | 109.21K | 116.79 | 4.77 | 5.30 | -10.00 | 23 | 1.14M |
| CONOIL | CONOIL PLC | 186.97K | 90.17K | 107.35 | 211.10 | 211.10 | 0.00 | 99 | 39.05M |
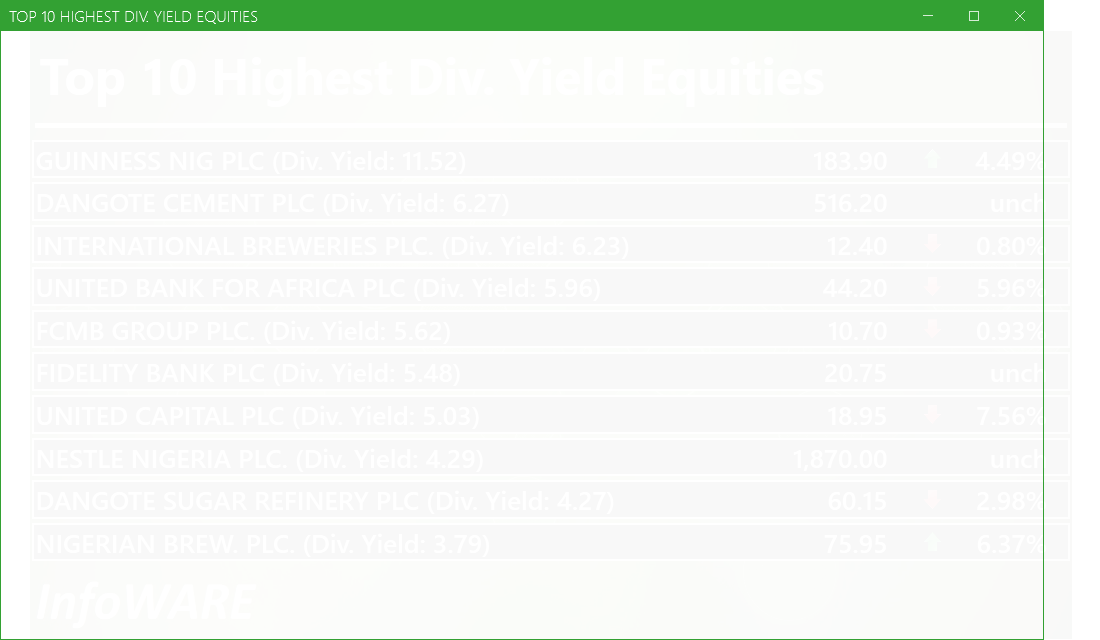
Investment Insights - High Div. Stocks
Dividend stocks distribute a portion of the company earnings to investors on a regular basis and they can a great choice for investors looking for regular income. As an investment or trading strategy, high dividend yield equities provide annual cash payments as against mostly capital gains in the price of a stock. The list in the table below represent the highest dividend paying stocks from the list of the most liquid stocks in the NSE top 30.
For more detailed analysis,
- On InfoWARE Market Data Terminal <HYIELD> <GO>
- On InfoWARE Finance Mobile App ( Android , iPhone & iPad and Windows 10) , "Research"
Investment Insights - Stocks outperforming the ASI but with approximately the same risk
These list of stocks represent equities that are less risky than the ASI but doing better than the ASI (All Shares Index) using the YTD (Year to Date) returns as the measure. The risk is measured by Beta. Beta is an assessment of a stock's tendency to undergo price changes, (its volatility), as well as its potential returns compared to the ASI. It is expressed as a ratio, where a score of 1 represents performance comparable to the ASI, and returns above or below the market may receive scores greater or lower than 1.
For a full list of both positively and negatively corelated stocks visit InfoWARE Market Data Terminal
- On InfoWARE Market Data Terminal <BANL> <GO>
- On InfoWARE Finance Mobile App ( Android , iPhone & iPad and Windows 10)
| Symbol | DivYield | PE | EPS | Beta | %ChgYTD | ASIYTDReturn | BetaDiff |
|---|---|---|---|---|---|---|---|
| HONYFLOUR | 1.40 | 16.28 | 0.31 | 0.99 | 219.36 | 37.47 | 0.01 |
| CAVERTON | 5.52 | 1.15 | 1.57 | 0.98 | 158.82 | 37.47 | 0.02 |
| ROYALEX | 7.81 | 0.00 | 0.00 | 0.96 | 85.45 | 37.47 | 0.04 |
| CORNERST | 5.28 | 8.62 | 0.35 | 0.93 | 56.57 | 37.47 | 0.07 |
| DEAPCAP | 13.76 | 188.84 | 0.01 | 0.89 | 56.67 | 37.47 | 0.11 |
| UNIVINSURE | 0.00 | 0.00 | 0.00 | 0.83 | 65.28 | 37.47 | 0.17 |
| FTNCOCOA | 1.60 | 0.00 | 0.00 | 0.79 | 219.15 | 37.47 | 0.21 |
| NB | 3.79 | 16.95 | 1.60 | 0.79 | 137.34 | 37.47 | 0.21 |
| MAYBAKER | 3.75 | 58.94 | 0.14 | 0.78 | 86.17 | 37.47 | 0.22 |
| UNILEVER | 2.81 | 67.09 | 0.40 | 0.75 | 102.78 | 37.47 | 0.25 |
African Markets
| Name | LClose | Change | %Chg |
|---|---|---|---|
| BRVM Stock Exchange | 323.76 | 1.35 | 0.42 |
| Botswana Stock Exchange | 10,610.53 | -1.06 | -0.01 |
| Egyptian Exchange | 35,403.00 | 560.96 | 1.61 |
| Ghana Stock Exchange | 7,672.81 | 75.97 | 1.00 |
| Johannesburg Stock Exchange | 105,422.81 | 52.69 | 0.05 |
| Lusaka Stock Exchange | 25,098.95 | 375.79 | 1.52 |
| Casablanca Stock Exchange | 19,799.08 | 213.48 | 1.09 |
| Malawi Stock Exchange | 573,525.01 | 11,631.20 | 2.07 |
| Nigeria Stock Exchange | 142,263.07 | 227.26 | 0.16 |
| Nairobi Securities Exchange | 175.02 | -2.58 | -1.45 |
| Namibian Stock Exchange | 1,908.43 | 6.66 | 0.35 |
| Rwanda Stock Exchange | 179.31 | 0.20 | 0.11 |
| Tunis Stock Exchange | 12,362.30 | 18.52 | 0.15 |
| Uganda Securities Exchange | 1,435.96 | -4.32 | -0.30 |
Nigeria Market Indexes
| Symbol | LClose | %Chg | WTD% | MTD% | QTD% | YTD% | MktCap | Trades |
|---|---|---|---|---|---|---|---|---|
| ASI | 141,845.32 | -0.29 | 0.13 | 1.52 | 18.46 | 37.47 | 22,946 | |
| NGX30 | 5,167.08 | -0.27 | 0.07 | 1.38 | 9.39 | 35.45 | 14,076 | |
| NGXAFRBVI | 3,445.76 | -2.84 | -4.00 | -1.14 | -2.76 | 38.90 | 6,869 | |
| NGXAFRHDYI | 22,370.39 | -2.82 | -2.64 | -0.72 | 6.96 | 31.38 | 7,144 | |
| NGXASEM | 1,538.10 | 0.00 | 0.00 | 0.00 | -3.57 | -2.88 | 6 | |
| NGXBNK | 1,491.31 | -1.93 | -2.61 | -1.33 | -1.29 | 37.14 | 7,694 | |
| NGXCG | 4,036.14 | -1.12 | -1.13 | 0.04 | 17.37 | 42.66 | 13,070 | |
| NGXCNSMRGDS | 3,358.16 | 0.61 | 1.87 | 5.28 | -3.19 | 93.63 | 3,011 | |
| NGXCOMMDTY | 1,112.02 | 0.00 | 1.41 | 4.11 | 6.18 | 11.20 | ||
| NGXGROWTH | 12,498.34 | -2.07 | -0.33 | 11.59 | 31.43 | 61.00 | 267 | |
| NGXINDUSTR | 4,928.90 | -0.01 | 0.05 | -0.07 | 39.91 | 38.00 | 1,538 | |
| NGXINS | 1,249.11 | -1.27 | -4.45 | -2.64 | 69.12 | 58.88 | 1,626 | |
| NGXLOTUSISLM | 11,792.02 | -0.08 | 0.82 | 3.27 | 23.16 | 69.24 | 3,674 | |
| NGXMAINBOARD | 6,969.49 | 0.01 | 0.74 | 2.69 | 18.15 | 39.28 | 15,260 | |
| NGXMERIGRW | 9,914.76 | -0.99 | -1.36 | -1.00 | 2.72 | 51.99 | 3,208 | |
| NGXMERIVAL | 13,228.40 | -2.82 | -3.65 | -1.06 | 10.72 | 26.83 | 7,902 | |
| NGXOILGAS | 2,486.71 | -0.13 | 2.88 | 4.90 | 3.95 | -8.28 | 317 | |
| NGXPENBRD | 2,634.27 | -0.27 | 0.07 | 1.70 | 14.57 | 43.82 | 19,332 | |
| NGXPENSION | 6,687.01 | -0.73 | -0.29 | 1.01 | 5.23 | 47.49 | 15,180 | |
| NGXPREMIUM | 13,667.57 | -0.85 | -1.02 | -0.69 | 19.16 | 40.43 | 7,419 | |
| NGXSOVBND | 657.27 | 0.00 | 0.38 | -0.24 | 0.58 | 9.26 | 0 |
For more detailed analysis,
- On InfoWARE Market Data Terminal <MKTINS> <GO>
- On InfoWARE Finance Mobile App ( Android, iPhone & iPad and Windows 10) , "Market Indexes"
Find the topic interesting? Will like to comment? Contact Us at solutions@infowarelimited.com
Top News

InfoWARE AI Analyst Weekly Market Report: 19-Sep-2025
Chart Of The Day - ASI Chart Vs ASI Advance Decline Line (YTD) (19-Sep-2025 15:07:45.543)
InfoWARE AI Analyst Daily Market Report: 19-Sep-2025

[XNSA]>> OFF MARKET TRADE
[XNSA]>> CORDROS MILESTONE FUNDS' BID & OFFER PRICES
[XNSA]>> DAILY INDICATIVE PRICES
[VSPBONDETF]>> DAILY INDICATIVE PRICES
[XNSA]>> INVITATION TO FACTS BEHIND THE FIGURES PRESENTATION
[XNSA]>> NGX FIXED INCOME INDICATIVE PRICE LIST FOR SEP 19, 2025
[XNSA]>> REGISTRATION FOR BATCH TWO- 2025 DEALING CLERKSHIP CERTIFICATION PROGRA
[LOTUSHAL15]>> DAILY INDICATIVE PRICES
[XNSA]>> DAILY FUND PRICE SUBMISSION - FCMB ASSET MANAGEMENT LIMITED
[XNSA]>> UPDATED- SAVE THE DATE: 29TH ANNUAL STOCKBROKERS CONFERENCE
[XNSA]>> AELP CAPACITY BUILDING & ASSDA FORUM
Chart Of The Day - ASI Chart Vs ASI Advance Decline Line (YTD) (18-Sep-2025 15:10:03.338)
InfoWARE AI Analyst Daily Market Report: 18-Sep-2025
[XNSA]>> CORDROS MILESTONE FUNDS' BID & OFFER PRICES
[XNSA]>> SUPRA COMMERCIAL TRUST LIMITED - APPOINTMENT OF A DIRECTOR
[MERVALUE]>> DAILY INDICATIVE PRICES
[VSPBONDETF]>> DAILY INDICATIVE PRICES
[XNSA]>> NGX FIXED INCOME INDICATIVE PRICE LIST FOR SEP 18, 2025
[XNSA]>> INVITATION TO FACTS BEHIND THE FIGURES PRESENTATION
[XNSA]>> REGISTRATION FOR BATCH TWO- 2025 DEALING CLERKSHIP CERTIFICATION PROGRA
[XNSA]>> DAILY FUND PRICE SUBMISSION - FCMB ASSET MANAGEMENT LIMITED
[XNSA]>> UPDATED- SAVE THE DATE: 29TH ANNUAL STOCKBROKERS CONFERENCE
[SIAMLETF40]>> DAILY INDICATIVE PRICES
[XNSA]>> NOTIFICATION OF PRICE ADJUSTMENT
[LOTUSHAL15]>> DAILY INDICATIVE PRICES
Chart Of The Day - ASI Chart Vs ASI Advance Decline Line (YTD) (17-Sep-2025 15:25:56.139)
InfoWARE Analyst Daily Market Report (17-Sep-2025 15:25:35.606)
Get IDIA - the stock trading app for the modern investor
Solutions by Business
Product Suites
Company
Contacts
- 8th Floor,
- South Atlantic Petroleum Towers,
- 1 Adeola Odeku Street,
- Victoria Island,
- Lagos, Nigeria.
- Email: solutions@infowarelimited.com
Follow Us
 |
 |
 |
 |