


InfoWARE AI Analyst Daily Market Report: 22-Oct-2025 | InfoWARE Finance
Get IDIA - the stock trading app for the modern investor


InfoWARE AI Analyst Daily Market Report: 22-Oct-2025
(Source: InfoWARE Terminal, Date: 22-Oct-2025)
Dear Investor,
NGX Market Summary – Wednesday, October 22, 2025
The Nigerian equity markets staged an energetic rebound today, with the NGX All Share Index (ASI) gaining +1.50% to close at 151,456.91. This spirited move propelled Year-To-Date (YTD) returns to a solid +49.00%, reinforcing the market's growth narrative for 2025. Market turnover surged by +19.1% to ₦21.34B, with volume ramping up to 556.1M from 486.2M. Breadth was bullish with 36 advancers versus 31 decliners, and advancers led decliners by a ratio of 1.16x. Notably, banking and consumer names saw heavy institutional flows, while several momentum plays drew unusual volume. Large-cap names and recent outperformers saw follow-through buying, but breadth hinted at selective risk appetite as some high-Beta stocks retreated.
1. Key Market Trends and Breadth
- Market Breadth: Advancers outpaced decliners (36 vs. 31; ratio: 1.16x), confirming broad underlying bullishness but with pockets of profit taking.
- Volume Surge: Trading volume jumped by +14% over yesterday, indicating increased participation, especially in banking majors and select momentum stocks.
- Institutional Dominance: Institutions accounted for 74.2% of total volume and over 91.7% of total value, highlighting deep-pocket participation in key large-cap stocks.
- Turnover Spike: Total turnover rose +19.1% from the previous session—typically a positive sign when paired with a positive index move, confirming institutional follow-through.
2. Top Gainers & Losers: Key Highlights
| Stock | Price | % Change | RSI | Sector | Notes |
|---|---|---|---|---|---|
| ASOSAVINGS | 0.55 | +10.00% | 51.9 | Mortgage | Unusual volume ↑ ; 15D/50D crossover sparking momentum |
| SKYAVN | 99.05 | +9.99% | 52.4 | Transport Services | Recent momentum, appears in both daily and 5D top gainers |
| NASCON | 110.00 | +6.80% | 61.2 | Food Products | Massive volume; 243% above 90D avg, momentum still healthy |
| DANGCEM | 639.00 | +6.50% | 67.1 | Building Materials | Approaching overbought, MACD bullish, sector leader |
| TRANSCOHOT | 174.90 | +6.26% | 52.5 | Hotels | Steady uptrend, low volatility, but beware of thin volume |
| Stock | Price | % Change | RSI | Sector | Notes |
|---|---|---|---|---|---|
| TIP | 13.00 | -5.73% | 53.9 | Specialty | Increasing volatility |
| LEGENDINT | 5.80 | -5.69% | 60.0 | IT | Negative momentum despite high RSI |
| ROYALEX | 2.20 | -4.76% | 54.3 | Financial | Also appears in YTD losers & bearish momentum |
| CHAMPION | 14.90 | -4.49% | 48.3 | Consumer Goods | Mixed signals; MACD nearly neutral |
| MANSARD | 16.00 | -4.19% | 54.0 | Insurance | Bears pushing below 15DMA |
Observations:
- Overlap Alert: ASOSAVINGS, NASCON, and SKYAVN feature both as daily and 5-day/MTD top gainers, indicating strong short-to-medium term momentum.
- VITAFOAM, a top 5 YTD gainer, continues strong volume; RSI at 72.3 suggests near overbought—watch for mean reversion.
- ROYALEX hits both daily and YTD loser tables and triggers bearish technicals: repeated red flag for investors.
3. Insights & Predictions
- Turnover Implications: The turnover spike (+19.1%) is healthy when paired with a rally, suggesting accumulation rather than mere speculative churn.
- Momentum Overlap: ASOSAVINGS, NASCON, SKYAVN: Aligned across YTD, short-term, unusual volume, and bullish technical tables; potential for continued upside but beware exhaustion, especially with RSI approaching 70 in some.
- Conflicted Technicals: ROYALEX is a YTD loser, showed as both bearish and a daily top loser, with price below 15DMA—momentum still negative. Avoid or short-term caution.
- Unusual Volumes: GTCO traded ~353% above average volume, NASCON at ~244%, AFRIPRUD at ~192%. These names warrant close tracking as they often herald trend continuation or short-term volatility spikes.
- Bullish 15DMA Crossovers: INTENEGINS, HONYFLOUR, GUINEAINS, STERLINGNG—generally technical buy signals; especially useful where RSI is below 70 (to minimize overbought risk).
- Bearish 15DMA Breakdowns: MANSARD, ROYALEX, OANDO, ETERNA, LASACO, VERITASKAP—all breaking below support, reinforcing short-term downside risks.
4. Contrarian Signals
-
CHAMPION BREW. PLC. (CHAMPION):
RSI is 48.3 (neutral), MACD mildly bullish, but price is down -4.5% today and YTD is negative. This conflict signals possible bottom-fishing opportunity if broader sector sentiment turns. -
LEGEND INTERNET PLC (LEGENDINT):
High RSI (60), still a top loser. This divergence suggests technical overextension to the downside or a potential reversal brewing. -
VITAFOAM:
RSI at 72.3 (overbought), price up only +0.37% today but up +293.95% YTD. Watch for exhaustion and possible short-term corrective move.
5. Sector Heatmap & Highlights
| Sector | Leaders | Laggards | Bullish Momentum | Bearish Momentum | Institutional Activity |
|---|---|---|---|---|---|
| Banking | GTCO, ZENITHBANK, STERLINGNG | N/A | STERLINGNG, GTCO | N/A | Very High (GTCO: Top Value, ZENITHBANK: 20.2% Trade Value) |
| Insurance | INTENEGINS, GUINEAINS | MANSARD, LASACO, VERITASKAP | INTENEGINS, GUINEAINS | MANSARD, LASACO, VERITASKAP, ROYALEX | Mixed; retail active on LINKASSURE |
| Consumer Goods | NASCON, VITAFOAM | CHAMPION | HONYFLOUR | CHAMPION | Low |
| IT/Telecom | Sterling | LEGENDINT, CWG | N/A | CWG | Limited |
| Building Materials | DANGCEM | N/A | DANGCEM | N/A | Moderate |
- Notable: Bank sector dominates both value and volume flows, led by GTCO, ZENITHBANK.
- Insurance sector sees technical inflection: INTENEGINS & GUINEAINS (bullish), MANSARD & ROYALEX (bearish and on loser lists).
6. Dividend–Beta Matrix: Defensive Ideas
| Stock | Sector | Dividend Yield | Beta | Notes |
|---|---|---|---|---|
| AFRIPRUD | Other Financial | 1.27% | 0.64 | Unusual volume. Defensive, offers cushion in market volatility. |
| NASCON | Food Products | 3.09% | 1.24 | Both high dividend and high Beta (momentum + defensive combo) |
| VITAFOAM | Household Durables | 7.03% | 0.47 | High yield, low Beta—prime defensive yield play but RSI overbought |
| REGALINS | Insurance | 6.52% | 0.47 | High yield, low Beta |
7. Institutional Clustering Alerts
- ZENITHBANK: Accounted for 20.2% of institutional trade value. Watch for major flows or sentiment shifts in this key banking bellwether.
- GTCO: Over ₦7.39B value traded; institutional activity at record levels, aligning with its unusual volume spike today.
- NASCON: Heavy institutional and unusual retail interest, especially with 243% volume spike.
8. Correlations/Notable Patterns (YTD & Momentum Tables)
- Multiple top daily gainers—ASOSAVINGS, NASCON, SKYAVN—feature in both short-term and YTD leader tables, strengthening the run-the-winners case.
- ROYALEX and MANSARD appear in both the loser and bearish momentum tables, compounding technical and fundamental risk for longs.
- NASCON: High YTD return, technical momentum, unusual volume, moderate Beta and dividend yield—potential for multifactor appreciation continues, but RSI (61) is climbing.
- VITAFOAM: Defensive on yield and Beta but technically overbought; consider trailing stops or reversal strategies.
9. Trader Suggestions & Tactical Ideas
- Chase momentum in names with overlap across daily, 5D, YTD, and volume leader tables: e.g., NASCON, ASOSAVINGS, SKYAVN—but keep RSI and overbought/oversold readings in focus.
- Look for entries in defensive high-yield, low Beta stocks like AFRIPRUD and REGALINS if broad market volatility increases.
- Avoid or short recent losers displaying both poor YTD and technical bearishness, e.g., ROYALEX, MANSARD.
- Monitor large institutional flows (ZENITHBANK, GTCO)—their next move sets the tone for banking sector sentiment.
- Contrarian Alert: CHAMPION—if general market risk appetite returns, could be an early reversal candidate.
- Manage risk on names mentioned with overbought RSI (>70) and rising short-term volatility, e.g., VITAFOAM.
10. YTD Gainers and Losers – Table
| Top 5 YTD Gainers | |||||
|---|---|---|---|---|---|
| Name | Price | %ChgYTD | RSI | Sector | Notes |
| VITAFOAM NIG PLC. | 94.00 | +293.95% | 72.3 | Household Durables | Stretched RSI; watch for retracement |
| S C O A NIG. PLC. | 7.10 | +244.66% | 67.95 | Industrials | Momentum steady |
| SOVEREIGN TRUST INSURANCE | 3.65 | +213.01% | 60.13 | Insurance | Solid technicals |
| SKYAVN | 90.05 | +196.11% | 52.43 | Transport Services | Appearing in multiple gainers lists |
| EUNISELL | 54.60 | +183.34% | 89.36 | Oil & Gas | RSI extreme; overbought |
| Top 5 YTD Losers | |||||
|---|---|---|---|---|---|
| Name | Price | %ChgYTD | RSI | Sector | Notes |
| CONOIL PLC | 190.70 | -50.75% | 33.44 | Oil & Gas | Clear selloff, RSI near oversold |
| VSPBONDETF | 206.07 | -40.86% | 46.32 | ETFs | Bond ETF, underperforms in equity risk-on environments |
| JULI PLC. | 8.06 | -21.75% | 30.8 | Consumer Health | Approaching deep value territory |
| LIVINGTRUST MB | 4.00 | -8.68% | 34.69 | Banks | Sector headwinds persist |
| MERISTEM GROWTH ETF | 347.00 | -12.04% | 38.47 | ETFs | Growth ETF lagging, risk-off |
11. Market Activity Analysis: Retail vs Institutional Flows
- Institutional investors executed 38.98% of trades but accounted for a massive 74.22% of volume and 91.66% of trade value—implying larger average transaction sizes and positioning primarily in banking majors, blue chips, and momentum leaders.
- Retail investors dominated on trade count (61.02%) but represented only 8.34% of trade value, focusing on smaller, lower-priced stocks.
Top 5 Most Traded by Institutions
| Stock | Volume | Trade Value | Note |
|---|---|---|---|
| GTCO | 78.68M | ₦7.39B | High momentum, unusual volume |
| ACCESSCORP | 54.91M | ₦1.36B | Blue chip, sector leader |
| ZENITHBANK | 22.30M | ₦1.51B | Major institutional clustering |
| FIDELITYBK | 92.88M | ₦1.84B | Steady institutional interest |
| WAPCO | 6.10M | ₦844M | Sectoral rotation, building materials |
Top 5 Most Traded by Retail
| Stock | Volume | Trade Value | Note |
|---|---|---|---|
| LINKASSURE | 5.75M | ₦11.6M | Highly retail driven |
| ACCESSCORP | 4.51M | ₦112M | Strong overlap—crosses both institutional and retail focus |
| ZENITHBANK | 1.68M | ₦114M | Blue chip, retail also engaged |
| MTNN | 166.7K | ₦81.8M | Heavyweight telecom; both institutional & retail |
| FCMB | 4.17M | ₦44.2M | Cost-conscious retail rotation |
- Pattern: Main institutional flows are into high-beta banking and value plays; retail chases penny-stock (insurance-focused) momentum as well as blue-chip exposure where affordable.
- Correlation: ACCESSCORP and ZENITHBANK sit in both institutional and retail top traded lists—strengthens conviction in their liquidity and trend reliability, but sudden reversals can be sharp given the mixed participant base.
- Insider Tip: When institutions and retail both flock to a name, short-term price discovery can be rapid, but trend reversals (esp. post-earnings or macro news) are often abrupt—trade with stops.
12. FX Market Summary
The Naira appreciated +0.19% against the USD, closing at ₦1,467/$1—a marginal improvement, supporting importers and lowering foreign-exchange-driven cost-push inflation pressures.
Summary Takeaways & Strategic Recommendations
- Momentum names with volume and breadth confirmation (NASCON, ASOSAVINGS, SKYAVN) remain buy-the-dip candidates, but RSI caution applies.
- Defensive, high-yield/low Beta stocks (VITAFOAM, REGALINS, AFRIPRUD) offer shelter and slow-and-steady compounding, particularly if market switches risk-off.
- High institutional clustering in banks (ZENITHBANK, GTCO) sets the near-term tone; watch for spillover to mid-tier banks and sector ETFs.
- Bullish traders can ride trend in stocks crossing above 15DMA with moderate RSI (avoid >70), while bearish traders should target short-side in stocks breaking key supports and confirmed in YTD/bear tables (ROYALEX, MANSARD).
- Contrarians should keep a watchlist of conflict names (CHAMPION, LEGENDINT) for snapback rallies.
|
Top ASI Gainers Over Last 5 Trading Days
|
Top ASI Losers Over Last 5 Trading Days
|
For more detailed analysis, on InfoWARE Market Data Terminal <NSEPERF> <GO>
On InfoWARE Finance Mobile App (Android, iPhone & iPad, Windows Phone and Windows 8/10), "Top Gainers & Losers"
ASO SAVINGS AND LOANS PLC (ASOSAVINGS) topped the advancers list closing at N0.55 with a gain of 10.00% followed by SKYWAY AVIATION HANDLING COMPANY PLC (SKYAVN) which closed at N99.05 with a gain of 9.99%.
On the flip side THE INITIATES PLC (TIP) and LEGEND INTERNET PLC (LEGENDINT) topped the decliners log with a loss of -5.73% at a close of N13.00, and -5.69% to close the day at N5.80 respectively.
| Symbol | LClose | %Chg |
|---|---|---|
| ASOSAVINGS | 0.55 | 10.00 |
| SKYAVN | 99.05 | 9.99 |
| LOTUSHAL15 | 90.00 | 9.76 |
| UPDCREIT | 7.95 | 8.16 |
| NASCON | 110.00 | 6.80 |
For more detailed analysis,
- On InfoWARE Market Data Terminal <TOPG> <GO>
- On InfoWARE Finance Mobile App ( Android, iPhone & iPad and Windows 10) , "Top Gainers & Losers"
Currency Market
In the currency market, the Naira appreciated 0.19%(2.75) against the Dollar to settle at 1 to 1NSE: Bull Signal - Price crossed above 15 Day MA
This signal implies these stocks are under buying pressure and the price might continue to rise and therefore positions should be monitored closely. Further suggested analysis include looking at the overall market (ASI) to see if the uptrend is market wide, sector wide or specific to the stock. Portfolio managers tend to use this as a signal to do more research to add to their positions or lock in some profits. Typically further analysis should be done using commands like PC and RV on the InfoWARE Market Data Terminal. Another command is ALERTS to set price triggers for possible exit or entry as necessary
For more detailed analysis,
- On InfoWARE Market Data Terminal <NSEPERF> <GO>
- On InfoWARE Finance Mobile App ( Android , iPhone & iPad and Windows 10) , "Top Gainers & Losers"
| Symbol | Price | %Chg | 15DMA | PE | EPS | DivY | MktCap | Vol | Trades | Value | LstTradeTime |
|---|---|---|---|---|---|---|---|---|---|---|---|
| INTENEGINS | 2.90 | 4.14 | 2.88 | 0.52 | 2.85 | 3.40 | 3.72B | 643.88K | 38.00 | 1.86M | 22-Oct-2025 14:30:22.067 |
| HONYFLOUR | 22.95 | 2.83 | 22.52 | 16.28 | 0.31 | 1.40 | 182.00B | 971.66K | 235.00 | 22.12M | 22-Oct-2025 14:30:21.787 |
| GUINEAINS | 1.45 | 2.76 | 1.44 | 66.79 | 0.01 | 1.96 | 8.90B | 2.40M | 70.00 | 3.45M | 22-Oct-2025 14:31:21.880 |
| STERLINGNG | 7.95 | 1.89 | 7.94 | 15.75 | 0.30 | 3.19 | 228.88B | 6.09M | 522.00 | 48.40M | 22-Oct-2025 14:30:31.610 |
NSE: BEAR Signal - Price crossed below 15 Day MA
This signal implies these stocks are under selling pressure and the price might continue to slide and therefore positions should be monitored closely. Further suggested analysis include looking at the overall market (ASI) to see if the downtrend is market wide, sector wide or specific to the stock. If the overal market trend is upwards, then since these stocks are heading in the opposite direction, then further analysis should be done using commands like PC and RV on the InfoWARE Market Data Terminal. Another command is ALERTS to set price triggers for possible exit is necessar
For more detailed analysis,
- On InfoWARE Market Data Terminal <BEARM> <GO>
- On InfoWARE Finance Mobile App ( Android , iPhone & iPad and Windows 10)
| Symbol | Price | %Chg | 15DMA | PE | EPS | DivY | MktCap | Vol | Trades | Value | LstTradeTime |
|---|---|---|---|---|---|---|---|---|---|---|---|
| NGXMERIVAL | 13,533.89 | -0.55 | 13,582.05 | 12.13 | 38.38 | 0.00 | 0.00 | 210.67M | 7,174.00 | 7.70B | 22-Oct-2025 14:30:44.363 |
| VERITASKAP | 2.10 | -0.95 | 2.11 | 48.77 | 0.02 | 4.17 | 29.12B | 7.17M | 110.00 | 15.14M | 22-Oct-2025 14:30:33.490 |
| LASACO | 2.95 | -1.36 | 2.97 | 21.56 | 0.11 | 4.05 | 5.41B | 1.31M | 60.00 | 3.87M | 22-Oct-2025 14:30:22.493 |
| ETERNA | 40.00 | -2.50 | 40.01 | 29.51 | 0.75 | 0.68 | 52.17B | 1.30M | 232.00 | 51.88M | 22-Oct-2025 14:31:21.840 |
| OANDO | 45.00 | -3.44 | 45.26 | 24.10 | 2.53 | 1.15 | 559.41B | 3.42M | 566.00 | 157.76M | 22-Oct-2025 14:30:24.627 |
| CWG | 17.80 | -3.65 | 17.91 | 0.00 | 0.00 | 2.46 | 44.94B | 1.13M | 141.00 | 20.25M | 22-Oct-2025 14:31:21.790 |
| MANSARD | 16.00 | -4.38 | 16.36 | 31.16 | 0.24 | 4.59 | 144.00B | 2.69M | 96.00 | 43.26M | 22-Oct-2025 14:31:21.900 |
| ROYALEX | 2.20 | -5.00 | 2.23 | 0.00 | 0.00 | 7.81 | 11.32B | 3.12M | 92.00 | 7.00M | 22-Oct-2025 14:30:25.403 |
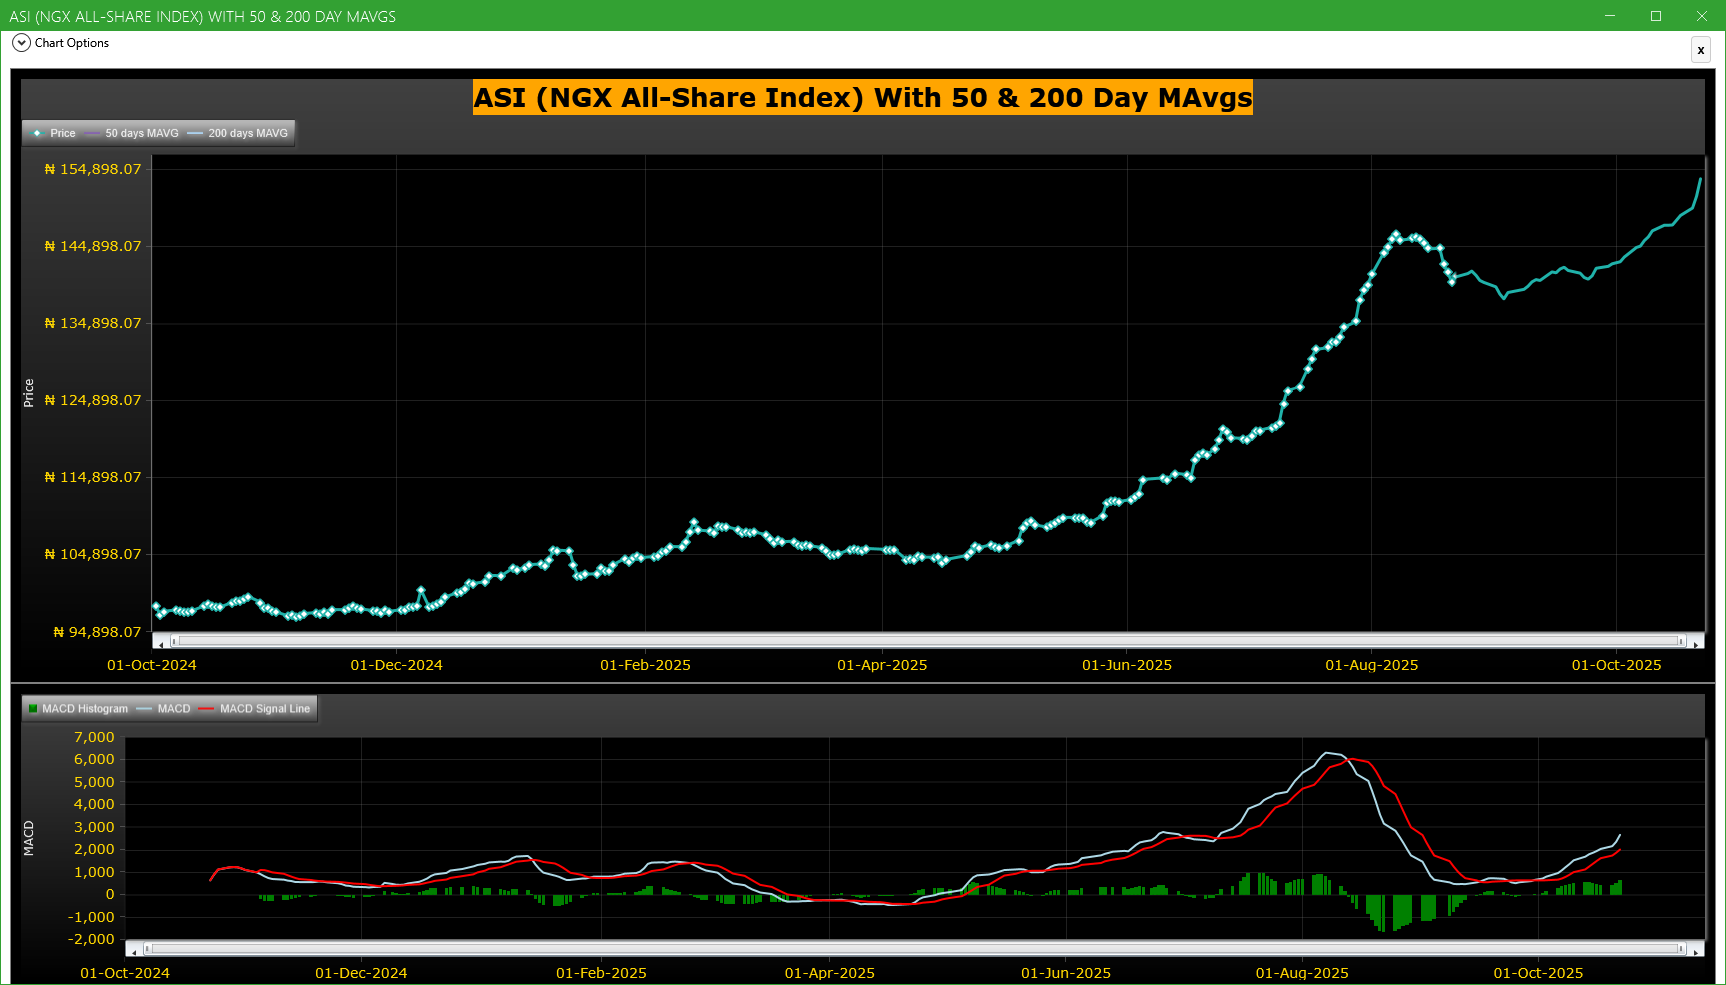
Market Trend - ASI (NGX All-Share-Index) With 50 & 200 Day MAvgs Chart
Technical traders typically use the 50 & 200 day moving averages to aid in choosing
where to enter or exit a position, which then causes these levels to act as strong
support or resistance. As a general guideline, if the price is above a moving average,
the trend is up. If the price is below a moving average, the trend is down.
It is important to note that critics of technical analysis say that moving averages act
as support and resistance because so many traders use these indicators to inform their
trading decisions. Also moving averages tend to work quite well in strong trending conditions
but poorly in choppy or ranging conditions.
Trading Strategies: Crossovers
Crossovers are one of the main moving average strategies. The first type is a price crossover,
which is when the price crosses above or below a moving average to signal a potential change
in trend. Another strategy is to apply two moving averages to a chart: one longer and one
shorter. When the shorter-term MA crosses above the longer-term MA, it is a buy signal, as
it indicates that the trend is shifting up. This is known as a golden cross. Meanwhile, when
the shorter-term MA crosses below the longer-term MA, it is a sell signal, as it indicates that
the trend is shifting down. This is known as a dead/death cross
For more detailed analysis,
- On InfoWARE Market Data Terminal <CI> <GO>
- On InfoWARE Finance Mobile App ( Android , iPhone & iPad and Windows 10) , "Research"
Unusual Volume: Volume traded is more than double the 90 day moving average (All exchanges; ASI & ASem). For more detailed analysis,
- On InfoWARE Market Data Terminal <UV> <GO>
- On InfoWARE Finance Mobile App ( Android , iPhone & iPad and Windows 10)
| Symbol | Name | Volume | 90DAvgVol | %VolChg | Price | LClose | %Chg | Trades | Value |
|---|---|---|---|---|---|---|---|---|---|
| GTCO | GUARANTY TRUST HOLDING COMPANY PLC | 79.45M | 17.54M | 352.95 | 93.00 | 92.95 | 0.05 | 1,236 | 7.39B |
| ASOSAVINGS | ASO SAVINGS AND LOANS PLC | 14.68M | 0.00 | 100.00 | 0.55 | 0.50 | 10.00 | 15 | 8.07M |
| NASCON | NATIONAL SALT CO. NIG. PLC | 7.71M | 2.24M | 243.68 | 110.00 | 103.00 | 6.80 | 138 | 813.64M |
| AFRIPRUD | AFRICA PRUDENTIAL REGISTRARS PLC | 5.84M | 2.00M | 192.49 | 14.05 | 14.10 | -0.35 | 227 | 82.59M |
| VITAFOAM | VITAFOAM NIG PLC. | 2.13M | 998.21K | 113.78 | 94.35 | 94.00 | 0.37 | 308 | 199.75M |
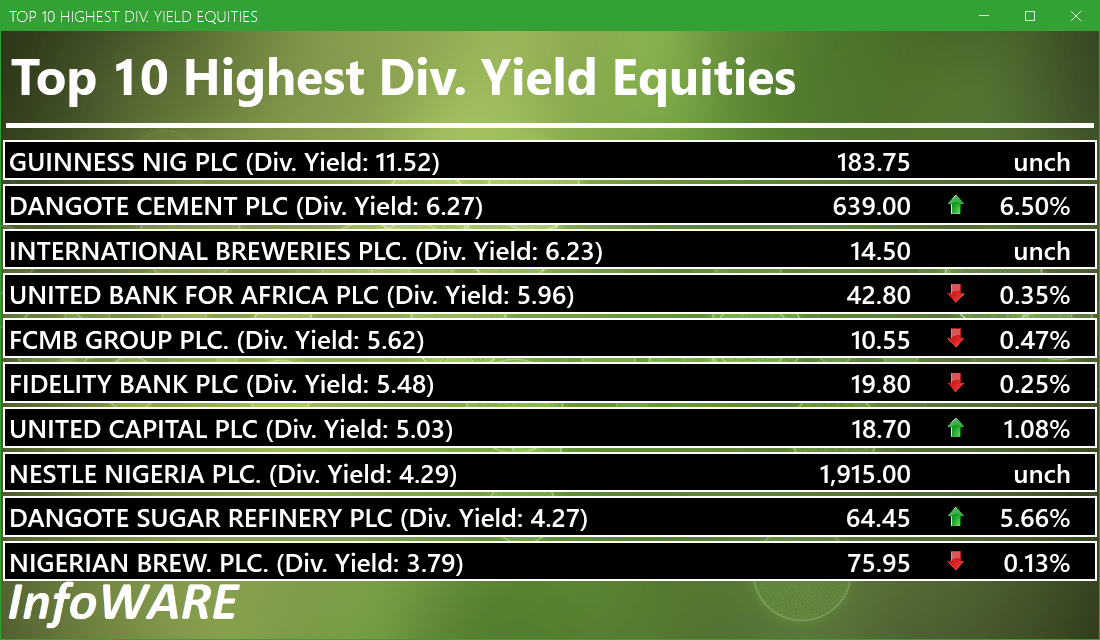
Investment Insights - High Div. Stocks
Dividend stocks distribute a portion of the company earnings to investors on a regular basis and they can a great choice for investors looking for regular income. As an investment or trading strategy, high dividend yield equities provide annual cash payments as against mostly capital gains in the price of a stock. The list in the table below represent the highest dividend paying stocks from the list of the most liquid stocks in the NSE top 30.
For more detailed analysis,
- On InfoWARE Market Data Terminal <HYIELD> <GO>
- On InfoWARE Finance Mobile App ( Android , iPhone & iPad and Windows 10) , "Research"
Investment Insights - Stocks outperforming the ASI but with approximately the same risk
These list of stocks represent equities that are less risky than the ASI but doing better than the ASI (All Shares Index) using the YTD (Year to Date) returns as the measure. The risk is measured by Beta. Beta is an assessment of a stock's tendency to undergo price changes, (its volatility), as well as its potential returns compared to the ASI. It is expressed as a ratio, where a score of 1 represents performance comparable to the ASI, and returns above or below the market may receive scores greater or lower than 1.
For a full list of both positively and negatively corelated stocks visit InfoWARE Market Data Terminal
- On InfoWARE Market Data Terminal <BANL> <GO>
- On InfoWARE Finance Mobile App ( Android , iPhone & iPad and Windows 10)
| Symbol | DivYield | PE | EPS | Beta | %ChgYTD | ASIYTDReturn | BetaDiff |
|---|---|---|---|---|---|---|---|
| HONYFLOUR | 1.40 | 16.28 | 0.31 | 0.99 | 231.65 | 49.00 | 0.01 |
| CAVERTON | 5.52 | 1.15 | 1.57 | 0.98 | 154.90 | 49.00 | 0.02 |
| ROYALEX | 7.81 | 0.00 | 0.00 | 0.96 | 100.00 | 49.00 | 0.04 |
| CORNERST | 5.28 | 8.62 | 0.35 | 0.93 | 66.67 | 49.00 | 0.07 |
| UNIVINSURE | 0.00 | 0.00 | 0.00 | 0.83 | 66.67 | 49.00 | 0.17 |
| FTNCOCOA | 1.60 | 0.00 | 0.00 | 0.79 | 198.94 | 49.00 | 0.21 |
| NB | 3.79 | 16.95 | 1.60 | 0.79 | 137.34 | 49.00 | 0.21 |
| MAYBAKER | 3.75 | 58.94 | 0.14 | 0.78 | 88.83 | 49.00 | 0.22 |
| UNILEVER | 2.81 | 67.09 | 0.40 | 0.75 | 105.56 | 49.00 | 0.25 |
| VETGOODS | 0.00 | 0.71 | 112.50 | 49.00 | 0.29 |
African Markets
| Name | LClose | Change | %Chg |
|---|---|---|---|
| BRVM Stock Exchange | 336.18 | -0.84 | -0.25 |
| Botswana Stock Exchange | 10,617.99 | 0.00 | 0.00 |
| Egyptian Exchange | 37,698.49 | -277.22 | -0.73 |
| Ghana Stock Exchange | 8,468.44 | -22.08 | -0.26 |
| Johannesburg Stock Exchange | 108,902.00 | -2,426.97 | -2.18 |
| Lusaka Stock Exchange | 25,413.45 | 32.99 | 0.13 |
| Casablanca Stock Exchange | 19,339.45 | 410.75 | 2.17 |
| Malawi Stock Exchange | 591,171.51 | 0.00 | 0.00 |
| Nigeria Stock Exchange | 151,456.91 | 1,514.42 | 1.01 |
| Nairobi Securities Exchange | 177.72 | 1.32 | 0.75 |
| Namibian Stock Exchange | 2,023.39 | -3.04 | -0.15 |
| Rwanda Stock Exchange | 178.74 | -0.54 | -0.30 |
| Tunis Stock Exchange | 12,382.71 | 17.31 | 0.14 |
| Uganda Securities Exchange | 1,465.18 | 23.78 | 1.65 |
Nigeria Market Indexes
| Symbol | LClose | %Chg | WTD% | MTD% | QTD% | YTD% | MktCap | Trades |
|---|---|---|---|---|---|---|---|---|
| ASI | 153,736.25 | 1.50 | 2.53 | 7.52 | 7.52 | 49.00 | 26,582 | |
| NGX30 | 5,623.76 | 1.55 | 2.69 | 7.78 | 7.78 | 47.42 | 14,523 | |
| NGXAFRBVI | 3,489.58 | -0.76 | -1.15 | -1.69 | -1.69 | 40.66 | 5,283 | |
| NGXAFRHDYI | 21,897.68 | -0.08 | -0.59 | -1.63 | -1.63 | 28.60 | 6,772 | |
| NGXASEM | 1,392.88 | 0.00 | 0.00 | -9.44 | -9.44 | -12.05 | 12 | |
| NGXBNK | 1,522.48 | -0.42 | -0.21 | 0.38 | 0.38 | 40.01 | 5,749 | |
| NGXCG | 4,196.38 | 0.49 | 0.61 | 3.59 | 3.59 | 48.32 | 12,717 | |
| NGXCNSMRGDS | 3,633.39 | 0.30 | 3.85 | 7.41 | 7.41 | 109.49 | 3,419 | |
| NGXCOMMDTY | 1,200.59 | 1.22 | 2.20 | 7.02 | 7.02 | 20.06 | ||
| NGXGROWTH | 14,790.34 | -0.43 | -1.73 | -1.87 | -1.87 | 90.53 | 346 | |
| NGXINDUSTR | 5,768.80 | 3.45 | 3.61 | 13.83 | 13.83 | 61.52 | 2,561 | |
| NGXINS | 1,278.88 | -0.51 | -0.13 | 6.92 | 6.92 | 62.67 | 3,429 | |
| NGXLOTUSISLM | 13,335.97 | 3.10 | 4.97 | 12.34 | 12.34 | 91.39 | 5,137 | |
| NGXMAINBOARD | 7,376.35 | 0.72 | 2.20 | 4.71 | 4.71 | 47.41 | 19,574 | |
| NGXMERIGRW | 10,251.74 | 1.30 | 1.52 | 3.52 | 3.52 | 57.16 | 3,659 | |
| NGXMERIVAL | 13,533.89 | -0.55 | -0.80 | 1.24 | 1.24 | 29.75 | 7,174 | |
| NGXOILGAS | 2,789.26 | 2.07 | 4.13 | 10.42 | 10.42 | 2.88 | 543 | |
| NGXPENBRD | 2,866.01 | 1.65 | 2.75 | 8.11 | 8.11 | 56.47 | 22,489 | |
| NGXPENSION | 7,040.35 | 1.00 | 1.51 | 4.49 | 4.49 | 55.28 | 16,070 | |
| NGXPREMIUM | 15,531.61 | 3.01 | 3.18 | 13.44 | 13.44 | 59.58 | 6,662 | |
| NGXSOVBND | 665.07 | -0.13 | -0.13 | 1.19 | 1.19 | 10.56 | 0 |
For more detailed analysis,
- On InfoWARE Market Data Terminal <MKTINS> <GO>
- On InfoWARE Finance Mobile App ( Android, iPhone & iPad and Windows 10) , "Market Indexes"
Find the topic interesting? Will like to comment? Contact Us at solutions@infowarelimited.com
Top News

MARKET PERFORMANCE REPORT & DAILY PRICE LIST

Daily Market Report

Chart Of The Day - ASI Chart Vs ASI Advance Decline Line (YTD) (22-Oct-2025 15:09:37.190)
InfoWARE AI Analyst Daily Market Report: 22-Oct-2025

[XNSA]>> CORDROS MILESTONE FUNDS' BID & OFFER PRICES
[XNSA]>> NGX FIXED INCOME INDICATIVE PRICE LIST FOR OCT 22, 2025
[LOTUSHAL15]>> DAILY INDICATIVE PRICES
[VSPBONDETF]>> DAILY INDICATIVE PRICES
[XNSA]>> H2 2025 BC/DR TEST
[XNSA]>> AELP CAPACITY BUILDING & ASSDA FORUM
[XNSA]>> LIFTING OF SUSPENSION PLACED ON TRADING IN THE SHARES OF ASO SAVINGS &
Chart Of The Day - ASI Chart Vs ASI Advance Decline Line (YTD) (21-Oct-2025 15:07:13.314)
InfoWARE AI Analyst Daily Market Report: 21-Oct-2025
[XNSA]>> CLOSING GONG CEREMONY
[VETINDETF]>> DAILY INDICATIVE PRICES
[XNSA]>> CORDROS MILESTONE FUNDS' BID & OFFER PRICES
[XNSA]>> NGX FIXED INCOME INDICATIVE PRICE LIST FOR OCT 21, 2025
[XNSA]>> H2 2025 BC/DR TEST
[XNSA]>> APPOINTMENT OF A DIRECTOR (FUTUREVIEW SECURITIES LIMITED)
[XNSA]>> AELP CAPACITY BUILDING & ASSDA FORUM
[XNSA]>> PILOT SECURITIES LIMITED - APPOINTMENT OF A DIRECTOR
[STANBICETF30]>> DAILY INDICATIVE PRICES
InfoWARE AI Analyst Daily Market Report: 20-Oct-2025
[XNSA]>> H2 2025 BC/DR TEST
[VSPBONDETF]>> DAILY INDICATIVE PRICES
[XNSA]>> CORDROS MILESTONE FUNDS' BID & OFFER PRICES
[XNSA]>> NGX FIXED INCOME INDICATIVE PRICE LIST FOR OCT 20, 2025
[XNSA]>> DAILY FUND PRICE SUBMISSION - FCMB ASSET MANAGEMENT LIMITED
[XNSA]>> EMERGING AFRICA DAILY MUTUAL FUND PRICES
[NEWGOLD]>> DAILY INDICATIVE PRICES
Get IDIA - the stock trading app for the modern investor
Solutions by Business
Product Suites
Company
Contacts
- 8th Floor,
- South Atlantic Petroleum Towers,
- 1 Adeola Odeku Street,
- Victoria Island,
- Lagos, Nigeria.
- Email: solutions@infowarelimited.com
Follow Us
 |
 |
 |
 |