


InfoWARE AI Analyst Daily Market Report: 23-Oct-2025 | InfoWARE Finance
Get IDIA - the stock trading app for the modern investor


InfoWARE AI Analyst Daily Market Report: 23-Oct-2025
(Source: InfoWARE Terminal, Date: 23-Oct-2025)
Dear Investor,
NGX Daily Market Summary – Thursday, October 23, 2025
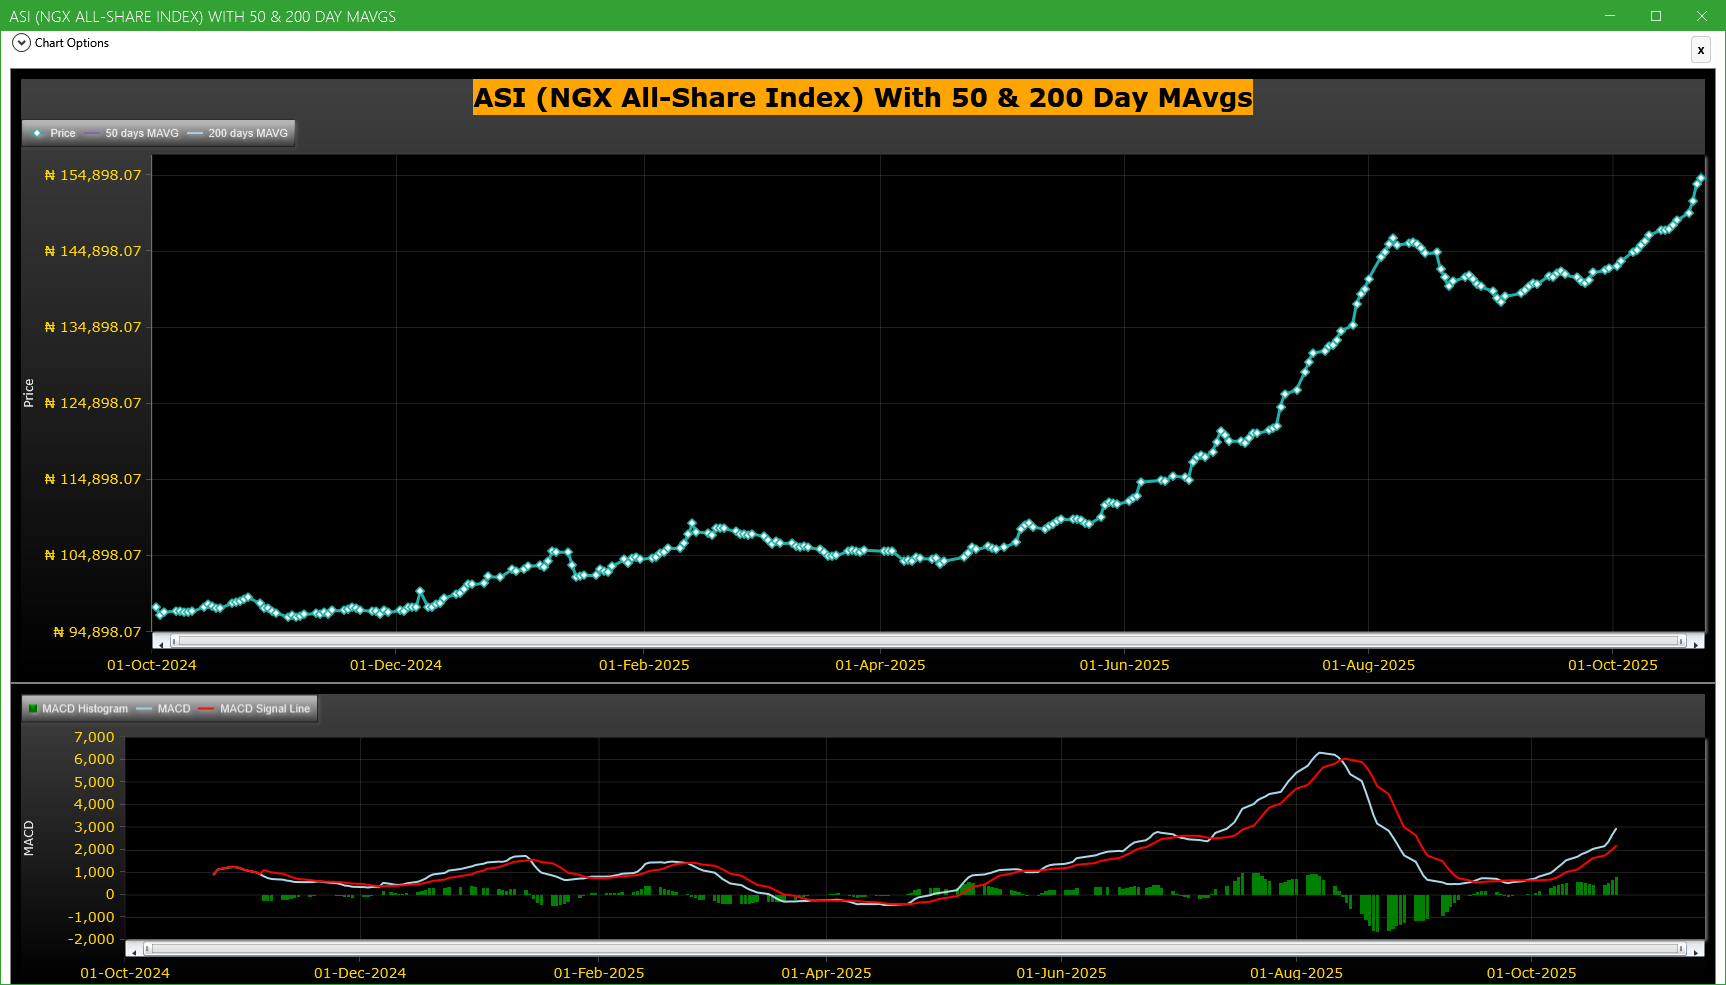
The NGX All Share Index (ASI) traded up 0.49%, marking another positive session and pushing its Year-To-Date (YTD) gain to a robust 49.73%. The ASI closed at 153,736.25, bouncing from yesterday’s 154,489.90. Market turnover shot up 17.04%, hitting ₦24.98B with volume soaring to 902.77M shares. Despite the upbeat momentum, market breadth held at 0.95x, with a nearly even split between advancers (36) and decliners (38). Top spotlights: PZ Cussons impressed with a 10.00% rally, while TIP and JOHN HOLT PLC. each saw sharp declines of -10.00% and -9.72% respectively.
Market Breadth & Trends
- Market breadth stayed slightly negative (0.95x)—a sign of underlying rotation or skepticism as gains slowed. Buying interest is strong but selective.
- Turnover jumped 17.04%, underpinned by big institutional flows—an encouraging sign for liquidity-sensitive strategies.
- Volume was up in 59 names but down in 81, indicating some pockets are attracting the lion’s share of new interest.
Top Gainers & Losers
| Top 5 Gainers | |||||
|---|---|---|---|---|---|
| Stock | Price | % Chg | RSI | MACD | 15DMA / 50DMA |
| PZ Cussons (PZ) | 42.90 | 10.00% | 55.5 | 1.01 | 39.51 / 36.49 |
| The Initiates (TIP) | 14.30 | 10.00% | 47.5 | 0.29 | 13.87 / 12.97 |
| ASO Savings (ASOSAVINGS) | 0.60 | 9.09% | 69.9 | 0.01 | 0.51 / 0.50 |
| CAP PLC | 74.00 | 8.82% | 45.95 | 0.09 | 70.00 / 69.56 |
| Lafarge WAPCO (WAPCO) | 150.45 | 8.63% | 62.14 | 3.33 | 132.64 / 129.02 |
| Top 5 Losers | |||||
|---|---|---|---|---|---|
| Stock | Price | % Chg | RSI | MACD | 15DMA / 50DMA |
| John Holt (JOHNHOLT) | 6.50 | -9.72% | 46.7 | -0.05 | 7.15 / 7.24 |
| Multiverse (MULTIVERSE) | 12.55 | -9.71% | 60.9 | 0.42 | 13.81 / 12.53 |
| Stanbic IBTC (STANBIC) | 107.20 | -9.15% | 66.3 | 4.89 | 113.04 / 104.55 |
| Nigerian Brew. (NB) | 70.00 | -7.83% | 53.5 | 1.61 | 76.43 / 72.28 |
| Caverton (CAVERTON) | 6.07 | -6.62% | 48.4 | -0.03 | 6.59 / 6.73 |
- PZ Cussons: Continues its streak, bolstered by moving average cross (15DMA above 50DMA) and an RSI around mid-50s, suggesting still-healthy but not overheated buying pressure.
- ASO Savings: Noticeably high volume (+4750% vs 90D avg) and an RSI near overbought territory (69.9) — momentum may extend but upside risk increases.
- WAPCO: Both price and institutional interest (record value traded) surged. Volume is 9x the 90-day average, flagging strong accumulation. 15DMA to 50DMA cross is very positive.
- Stanbic IBTC, NB, Multiverse: All appear in both today’s losers and YTD underperformers—a sign of persistent distribution or sector-specific headwinds.
Momentum & Volume Insights
-
Bullish Crosses (15DMA > 50DMA):
- PZ Cussons (Continued uptrend), CAP, TIP, BERGER, and WAPCO stand out with moving averages crossing bullishly—indicative of extended or resuming uptrends.
-
Bearish Crosses (15DMA < 50DMA):
- Stanbic IBTC, RT Briscoe, NB, and NGXBNK Index are all breaking down—these names should be watched for further weakness, especially with RSI heading toward neutral or lower.
-
Unusual Volume:
- ASO Savings (+4750% vs avg), JAPAULGOLD, WAPCO and NASCON attracted huge volumes. Stocks with both heavy volume and price spikes typically see follow-through — but also raise short-term speculation/volatility risk.
-
RSI Watch:
- ASO Savings (RSI 69.87), NASCON, and ARADEL (YTD leaders) are nearing or at overbought — monitor for exhaustion/pullbacks.
- No major stocks flagged excessively oversold (RSI < 30), suggesting downside is more drift than panic selling.
Contrarian Signals
- ASO Savings: Extreme volume and strong price action, but RSI at 69.9 is a warning—momentum traders may ride further upside, but a cooldown is likely.
- PZ Cussons: Despite 10% run-up, the RSI is moderate (55.5)—not overbought, supporting a potential further leg up as long as volume sustains.
- Stanbic IBTC: Negative price performance and bearish momentum, but still a relatively high RSI (66.3) and an uptrending MACD—suggesting potential bounce-back after de-risking.
- TIP: Posts double-digit gain, yet only a middling RSI (47.5)—further analysis warranted.
- NASCON: Appearing in both unusual volume and YTD gainers (279.6% YTD), but RSI is at an inflection—consider profit taking or tight risk controls.
Sector Heatmaps & Institutional/Technical Trends
| Sector | Top Stock | % Chg | 15DMA > 50DMA? | Notable Flow | Institutional Activity |
|---|---|---|---|---|---|
| Building Materials | WAPCO | 8.63% | Yes | Record Volume | 47M shares (4.9% of all institutional volume/#1 by value) |
| Personal/Household Products | PZ Cussons | 10.00% | Yes | High Momentum | — |
| Banking | NGXBNK Index | -1.07% | No | Under Pressure | Moderate Interest |
| Insurance | NGXINS Index | -1.28% | No | Weak | Low |
| Food Products | NASCON | 3.55% | — | High Volume | Spotty |
- Sector Note: Building Materials are today's standout; Banking and Insurance lag, with clear technical breakdowns (sub-15DMA for major names).
- Institutional clustering was highest in WAPCO (25.6% of inst. value), followed by ACCESSCORP, ARADEL, NB and MTNN.
Dividend-Beta Matrix: Defensive Opportunities
| Stock | Div. Yield | Beta | Comment |
|---|---|---|---|
| AFRIPRUD | 1.27% | 0.64 | High yield, low beta—classic "sleep-well” defensive |
| NASCON | 3.09% | 1.24 | High yield, slightly higher beta—defensive with added punch |
| PZ Cussons | 4.59% | 0.56 | High yield, positive momentum |
| CAP PLC | 4.13% | 0.04 | Low beta, steady earner; sector leader now showing upside momentum |
- Several high dividend plays (PZ, CAP, NASCON, AFRIPRUD) also show up among bullish momentum candidates, increasing the "total return" argument for cautious investors.
- NASCON and PZ: Rare overlap of "bullish technical" and "income defensive" buckets.
Institutional Clustering Alerts
- WAPCO: Accounted for 25.6% of total institutional trade value and nearly 5% of all institutional volume today—a red flag for institutional accumulation or rotation.
- ZENITHBANK: Although not a top mover, posted significant retail activity (3.11% trade count share); institutional interest remains steady.
- ARADEL: Institutional flows (22% of volume) support the ongoing rally—watch for extended moves, but tight stops are prudent as volumes have normalized from prior surges.
Market Activity Deep Dive: Retail vs Institutional Patterns
- Institutions only accounted for 38.96% of trade count but 84.36% of volume and an overwhelming 91.95% of value traded, confirming presence of block trading and strategic re-balancing over churn.
- Retail dominated trade count (61.04%) but traded in smaller lots (just 15.64% of volume, 8.05% value)—indicative of broader, smaller-scale activity in more liquid counters.
- Top institutional stocks: WAPCO, ACCESSCORP, ARADEL, NB, and MTNN. WAPCO and NB overlap with top volume and value gainers, reflecting sector (cement/industry) rotation.
- Top retail stocks: MTNN, ACCESSCORP, DANGCEM, GTCO, ZENITHBANK. Note that ACCESSCORP appears in both institutional and retail lists—market bellwether or speculative play; monitor for spillover volatility.
- Insight: Names with heavy institutional flows (WAPCO, ARADEL) and unusual volumes are likely to continue trending in the short term—especially if technicals confirm bullish setups (as seen with 15DMA crossovers).
Trader Takeaways & Recommendations
- Opportunities: Consider trading with the trend in WAPCO, NASCON, ASO Savings, and PZ while trailing stops—momentum and institutional support present, but manage risk as volumes spike.
- Caution: Avoid freshly-bearish names (STANBIC, NB, RT Briscoe) for new longs until momentum shifts; monitor for mean reversion/contrarian signals if oversold levels are reached.
- Income-seekers: Focus on high-yield, low-beta names like AFRIPRUD and CAP. Overlay with technical signals to time entries.
- Rotation Watch: Broad market remains bullish, but sector-level divergence is real. Building Materials outperform; banking/insurance lag—use relative strength checks for portfolio balancing.
- Position sizing: Elevated/unusual volumes (ASO, NASCON, WAPCO) warrant smaller entries—anticipated volatility and profit taking spikes possible.
Currency & Macro
- Naira: Appreciation of 0.07% against the USD (₦1,466/$)—a supportive backdrop but watch for currency-fueled repositioning if trend persists.
|
Top ASI Gainers Over Last 5 Trading Days
|
Top ASI Losers Over Last 5 Trading Days
|
For more detailed analysis, on InfoWARE Market Data Terminal <NSEPERF> <GO>
On InfoWARE Finance Mobile App (Android, iPhone & iPad, Windows Phone and Windows 8/10), "Top Gainers & Losers"
P Z CUSSONS NIGERIA PLC. (PZ) topped the advancers list closing at N42.90 with a gain of 10.00% followed by THE INITIATES PLC (TIP) which closed at N14.30 with a gain of 10.00%.
On the flip side LOTUS HALAL EQUITY ETF (LOTUSHAL15) and JOHN HOLT PLC. (JOHNHOLT) topped the decliners log with a loss of -9.89% at a close of N81.10, and -9.72% to close the day at N6.50 respectively.
| Symbol | LClose | %Chg |
|---|---|---|
| PZ | 42.90 | 10.00 |
| TIP | 14.30 | 10.00 |
| ASOSAVINGS | 0.60 | 9.09 |
| CAP | 74.00 | 8.82 |
| WAPCO | 150.45 | 8.63 |
| Symbol | LClose | %Chg |
|---|---|---|
| LOTUSHAL15 | 81.10 | -9.89 |
| JOHNHOLT | 6.50 | -9.72 |
| MULTIVERSE | 12.55 | -9.71 |
| STANBIC | 107.20 | -9.15 |
| NB | 70.00 | -7.83 |
For more detailed analysis,
- On InfoWARE Market Data Terminal <TOPG> <GO>
- On InfoWARE Finance Mobile App ( Android, iPhone & iPad and Windows 10) , "Top Gainers & Losers"
Currency Market
In the currency market, the Naira appreciated 0.07%(1.02) against the Dollar to settle at 1 to 1NSE: Bull Signal - Price crossed above 15 Day MA
This signal implies these stocks are under buying pressure and the price might continue to rise and therefore positions should be monitored closely. Further suggested analysis include looking at the overall market (ASI) to see if the uptrend is market wide, sector wide or specific to the stock. Portfolio managers tend to use this as a signal to do more research to add to their positions or lock in some profits. Typically further analysis should be done using commands like PC and RV on the InfoWARE Market Data Terminal. Another command is ALERTS to set price triggers for possible exit or entry as necessary
For more detailed analysis,
- On InfoWARE Market Data Terminal <NSEPERF> <GO>
- On InfoWARE Finance Mobile App ( Android , iPhone & iPad and Windows 10) , "Top Gainers & Losers"
| Symbol | Price | %Chg | 15DMA | PE | EPS | DivY | MktCap | Vol | Trades | Value | LstTradeTime |
|---|---|---|---|---|---|---|---|---|---|---|---|
| PZ | 42.90 | 9.09 | 39.51 | 44.17 | 0.50 | 4.59 | 170.33B | 5.77M | 296.00 | 240.13M | 23-Oct-2025 14:30:35.893 |
| TIP | 14.30 | 9.09 | 13.87 | 0.00 | 12.73B | 1.73M | 136.00 | 24.15M | 23-Oct-2025 14:30:37.963 | ||
| CAP | 74.00 | 8.11 | 70.00 | 12.92 | 2.90 | 4.13 | 60.29B | 641.97K | 49.00 | 46.95M | 23-Oct-2025 14:30:10.423 |
| NGXGROWTH | 15,808.19 | 6.44 | 15,178.80 | 18.83 | 0.18 | 0.00 | 0.00 | 2.68M | 222.00 | 27.79M | 23-Oct-2025 14:30:18.507 |
| BERGER | 38.90 | 6.04 | 37.71 | 14.18 | 1.22 | 1.15 | 11.27B | 750.99K | 71.00 | 28.51M | 23-Oct-2025 14:30:10.270 |
| VERITASKAP | 2.17 | 3.23 | 2.12 | 48.77 | 0.02 | 4.17 | 30.09B | 9.65M | 107.00 | 20.89M | 23-Oct-2025 14:30:13.783 |
| CWG | 18.20 | 2.20 | 18.01 | 0.00 | 0.00 | 2.46 | 45.95B | 1.79M | 115.00 | 32.12M | 23-Oct-2025 14:30:10.730 |
| NGXMERIVAL | 13,602.64 | 0.51 | 13,597.70 | 12.13 | 38.38 | 0.00 | 0.00 | 198.26M | 7,376.00 | 13.61B | 23-Oct-2025 14:30:18.637 |
NSE: BEAR Signal - Price crossed below 15 Day MA
This signal implies these stocks are under selling pressure and the price might continue to slide and therefore positions should be monitored closely. Further suggested analysis include looking at the overall market (ASI) to see if the downtrend is market wide, sector wide or specific to the stock. If the overal market trend is upwards, then since these stocks are heading in the opposite direction, then further analysis should be done using commands like PC and RV on the InfoWARE Market Data Terminal. Another command is ALERTS to set price triggers for possible exit is necessar
For more detailed analysis,
- On InfoWARE Market Data Terminal <BEARM> <GO>
- On InfoWARE Finance Mobile App ( Android , iPhone & iPad and Windows 10)
| Symbol | Price | %Chg | 15DMA | PE | EPS | DivY | MktCap | Vol | Trades | Value | LstTradeTime |
|---|---|---|---|---|---|---|---|---|---|---|---|
| FGS202766 | 125.00 | 0.00 | 125.00 | 0.00 | 0.00 | 0.00 | 0.00 | 0.00 | 23-Oct-2025 14:30:17.443 | ||
| NGXBNK | 1,506.35 | -1.07 | 1,520.92 | 6.10 | 34.65 | 0.00 | 0.00 | 156.68M | 7,168.00 | 3.88B | 23-Oct-2025 14:30:18.423 |
| NGXINS | 1,262.68 | -1.28 | 1,272.49 | 10.41 | 2.09 | 0.00 | 0.00 | 70.87M | 2,002.00 | 210.52M | 23-Oct-2025 14:30:18.547 |
| GUINEAINS | 1.39 | -4.32 | 1.44 | 66.79 | 0.01 | 1.96 | 8.53B | 2.79M | 67.00 | 3.96M | 23-Oct-2025 14:30:35.870 |
| IKEJAHOTEL | 19.00 | -5.00 | 19.74 | 51.55 | 0.16 | 0.94 | 39.50B | 870.30K | 56.00 | 16.81M | 23-Oct-2025 14:30:11.567 |
| LIVESTOCK | 7.50 | -5.33 | 7.81 | 0.00 | 0.00 | 2.94 | 22.50B | 927.37K | 105.00 | 6.96M | 23-Oct-2025 14:30:11.900 |
| RTBRISCOE | 3.40 | -5.88 | 3.54 | 0.00 | 0.00 | 4.35 | 4.00B | 892.53K | 41.00 | 3.02M | 23-Oct-2025 14:30:12.927 |
| STANBIC | 107.20 | -10.07 | 113.04 | 6.87 | 8.23 | 3.54 | 1,388.99B | 794.76K | 366.00 | 88.25M | 23-Oct-2025 14:30:13.087 |
| FGS202886 | 80.00 | -25.00 | 98.33 | 0.00 | 0.00 | 150.00 | 1.00 | 120.00K | 23-Oct-2025 14:30:17.767 |
Market Trend - ASI (NGX All-Share-Index) With 50 & 200 Day MAvgs Chart
Technical traders typically use the 50 & 200 day moving averages to aid in choosing
where to enter or exit a position, which then causes these levels to act as strong
support or resistance. As a general guideline, if the price is above a moving average,
the trend is up. If the price is below a moving average, the trend is down.
It is important to note that critics of technical analysis say that moving averages act
as support and resistance because so many traders use these indicators to inform their
trading decisions. Also moving averages tend to work quite well in strong trending conditions
but poorly in choppy or ranging conditions.
Trading Strategies: Crossovers
Crossovers are one of the main moving average strategies. The first type is a price crossover,
which is when the price crosses above or below a moving average to signal a potential change
in trend. Another strategy is to apply two moving averages to a chart: one longer and one
shorter. When the shorter-term MA crosses above the longer-term MA, it is a buy signal, as
it indicates that the trend is shifting up. This is known as a golden cross. Meanwhile, when
the shorter-term MA crosses below the longer-term MA, it is a sell signal, as it indicates that
the trend is shifting down. This is known as a dead/death cross
For more detailed analysis,
- On InfoWARE Market Data Terminal <CI> <GO>
- On InfoWARE Finance Mobile App ( Android , iPhone & iPad and Windows 10) , "Research"
Unusual Volume: Volume traded is more than double the 90 day moving average (All exchanges; ASI & ASem). For more detailed analysis,
- On InfoWARE Market Data Terminal <UV> <GO>
- On InfoWARE Finance Mobile App ( Android , iPhone & iPad and Windows 10)
| Symbol | Name | Volume | 90DAvgVol | %VolChg | Price | LClose | %Chg | Trades | Value |
|---|---|---|---|---|---|---|---|---|---|
| JAPAULGOLD | JAPAUL GOLD & VENTURES PLC | 436.05M | 19.86M | 2,095.41 | 2.55 | 2.52 | 1.19 | 283 | 1.09B |
| WAPCO | LAFARGE WAPCO PLC. | 46.37M | 4.67M | 893.75 | 150.45 | 138.50 | 8.63 | 888 | 6.98B |
| NASCON | NATIONAL SALT CO. NIG. PLC | 17.92M | 2.33M | 670.11 | 113.90 | 110.00 | 3.55 | 288 | 1.99B |
| DAARCOMM | DAAR COMMUNICATIONS PLC | 16.63M | 4.56M | 264.66 | 1.05 | 1.03 | 1.94 | 156 | 16.48M |
| ASOSAVINGS | ASO SAVINGS AND LOANS PLC | 11.30M | 232.96K | 4,750.73 | 0.60 | 0.55 | 9.09 | 17 | 6.78M |
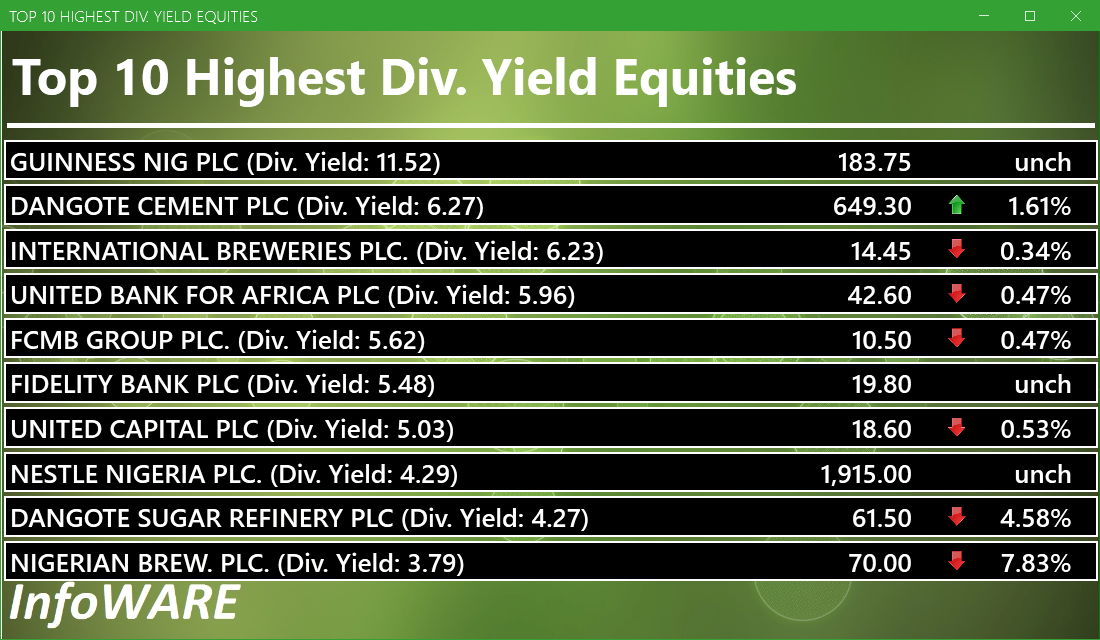
Investment Insights - High Div. Stocks
Dividend stocks distribute a portion of the company earnings to investors on a regular basis and they can a great choice for investors looking for regular income. As an investment or trading strategy, high dividend yield equities provide annual cash payments as against mostly capital gains in the price of a stock. The list in the table below represent the highest dividend paying stocks from the list of the most liquid stocks in the NSE top 30.
For more detailed analysis,
- On InfoWARE Market Data Terminal <HYIELD> <GO>
- On InfoWARE Finance Mobile App ( Android , iPhone & iPad and Windows 10) , "Research"
African Markets
| Name | LClose | Change | %Chg |
|---|---|---|---|
| BRVM Stock Exchange | 338.43 | 2.25 | 0.67 |
| Egyptian Exchange | 37,698.49 | -277.22 | -0.73 |
| Johannesburg Stock Exchange | 108,837.10 | -65.34 | -0.06 |
| Lusaka Stock Exchange | 25,427.42 | 12.71 | 0.05 |
| Casablanca Stock Exchange | 19,452.84 | 114.10 | 0.59 |
| Malawi Stock Exchange | 591,103.33 | -59.12 | -0.01 |
| Nairobi Securities Exchange | 178.36 | 0.64 | 0.36 |
| Namibian Stock Exchange | 2,028.77 | 5.46 | 0.27 |
| Rwanda Stock Exchange | 179.00 | 0.27 | 0.15 |
| Tunis Stock Exchange | 12,427.95 | 45.81 | 0.37 |
Nigeria Market Indexes
| Symbol | LClose | %Chg | WTD% | MTD% | QTD% | YTD% | MktCap | Trades |
|---|---|---|---|---|---|---|---|---|
| ASI | 154,489.90 | 0.49 | 3.03 | 8.05 | 8.05 | 49.73 | 28,988 | |
| NGX30 | 5,650.07 | 0.47 | 3.17 | 8.28 | 8.28 | 48.11 | 15,820 | |
| NGXAFRBVI | 3,465.07 | -0.70 | -1.85 | -2.38 | -2.38 | 39.68 | 4,788 | |
| NGXAFRHDYI | 21,924.49 | 0.12 | -0.47 | -1.51 | -1.51 | 28.76 | 6,638 | |
| NGXASEM | 1,392.88 | 0.00 | 0.00 | -9.44 | -9.44 | -12.05 | 10 | |
| NGXBNK | 1,506.35 | -1.06 | -1.27 | -0.69 | -0.69 | 38.53 | 7,168 | |
| NGXCG | 4,183.96 | -0.30 | 0.32 | 3.29 | 3.29 | 47.88 | 14,252 | |
| NGXCNSMRGDS | 3,599.27 | -0.94 | 2.87 | 6.40 | 6.40 | 107.53 | 4,498 | |
| NGXCOMMDTY | 1,210.61 | 0.83 | 3.05 | 7.91 | 7.91 | 21.06 | ||
| NGXGROWTH | 15,808.19 | 6.88 | 5.03 | 4.88 | 4.88 | 103.64 | 222 | |
| NGXINDUSTR | 5,947.11 | 3.09 | 6.82 | 17.35 | 17.35 | 66.51 | 3,386 | |
| NGXINS | 1,262.68 | -1.27 | -1.39 | 5.57 | 5.57 | 60.61 | 2,002 | |
| NGXLOTUSISLM | 13,664.03 | 2.46 | 7.55 | 15.10 | 15.10 | 96.10 | 8,314 | |
| NGXMAINBOARD | 7,363.86 | -0.17 | 2.03 | 4.53 | 4.53 | 47.16 | 21,436 | |
| NGXMERIGRW | 10,204.16 | -0.46 | 1.05 | 3.04 | 3.04 | 56.43 | 6,154 | |
| NGXMERIVAL | 13,602.64 | 0.51 | -0.29 | 1.76 | 1.76 | 30.41 | 7,376 | |
| NGXOILGAS | 2,820.66 | 1.13 | 5.31 | 11.67 | 11.67 | 4.04 | 478 | |
| NGXPENBRD | 2,882.12 | 0.56 | 3.33 | 8.71 | 8.71 | 57.35 | 24,740 | |
| NGXPENSION | 7,050.04 | 0.14 | 1.65 | 4.63 | 4.63 | 55.49 | 17,708 | |
| NGXPREMIUM | 15,791.43 | 1.67 | 4.91 | 15.34 | 15.34 | 62.25 | 7,330 | |
| NGXSOVBND | 665.07 | 0.00 | -0.13 | 1.19 | 1.19 | 10.56 | 0 |
For more detailed analysis,
- On InfoWARE Market Data Terminal <MKTINS> <GO>
- On InfoWARE Finance Mobile App ( Android, iPhone & iPad and Windows 10) , "Market Indexes"
Find the topic interesting? Will like to comment? Contact Us at solutions@infowarelimited.com
Top News

Chart Of The Day - ASI Chart Vs ASI Advance Decline Line (YTD) (23-Oct-2025 15:11:07.543)
InfoWARE AI Analyst Daily Market Report: 23-Oct-2025

[XNSA]>> APPOINTMENT OF A DIRECTOR
[XNSA]>> RESIGNATION OF A DIRECTOR
[XNSA]>> FBF PRESENTATION BY ELLAH LAKES PLC
[XNSA]>> CORDROS MILESTONE FUNDS' BID & OFFER PRICES
[XNSA]>> H2 2025 BC/DR TEST
[VSPBONDETF]>> DAILY INDICATIVE PRICES
[XNSA]>> CLOSING GONG CEREMONY
[XNSA]>> AELP CAPACITY BUILDING & ASSDA FORUM
[XNSA]>> NGX FIXED INCOME INDICATIVE PRICE LIST FOR OCT 23, 2025
[LOTUSHAL15]>> DAILY INDICATIVE PRICES
[STANBICETF30]>> DAILY INDICATIVE PRICES

MARKET PERFORMANCE REPORT & DAILY PRICE LIST

Daily Market Report
Chart Of The Day - ASI Chart Vs ASI Advance Decline Line (YTD) (22-Oct-2025 15:09:37.190)
InfoWARE AI Analyst Daily Market Report: 22-Oct-2025
[XNSA]>> CORDROS MILESTONE FUNDS' BID & OFFER PRICES
[XNSA]>> NGX FIXED INCOME INDICATIVE PRICE LIST FOR OCT 22, 2025
[LOTUSHAL15]>> DAILY INDICATIVE PRICES
[VSPBONDETF]>> DAILY INDICATIVE PRICES
[XNSA]>> H2 2025 BC/DR TEST
[XNSA]>> AELP CAPACITY BUILDING & ASSDA FORUM
[XNSA]>> LIFTING OF SUSPENSION PLACED ON TRADING IN THE SHARES OF ASO SAVINGS &
Chart Of The Day - ASI Chart Vs ASI Advance Decline Line (YTD) (21-Oct-2025 15:07:13.314)
InfoWARE AI Analyst Daily Market Report: 21-Oct-2025
[XNSA]>> CLOSING GONG CEREMONY
[VETINDETF]>> DAILY INDICATIVE PRICES
[XNSA]>> CORDROS MILESTONE FUNDS' BID & OFFER PRICES
[XNSA]>> NGX FIXED INCOME INDICATIVE PRICE LIST FOR OCT 21, 2025
Get IDIA - the stock trading app for the modern investor
Solutions by Business
Product Suites
Company
Contacts
- 8th Floor,
- South Atlantic Petroleum Towers,
- 1 Adeola Odeku Street,
- Victoria Island,
- Lagos, Nigeria.
- Email: solutions@infowarelimited.com
Follow Us
 |
 |
 |
 |