


InfoWARE AI Analyst Daily Market Report: 11-Nov-2025 | InfoWARE Finance
Get IDIA - the stock trading app for the modern investor


InfoWARE AI Analyst Daily Market Report: 11-Nov-2025
(Source: InfoWARE Terminal, Date: 11-Nov-2025)
Dear Investor,
NGX Market Summary – Tuesday, November 11, 2025
The NGX All Share Index (ASI) saw a sharp -5.01% decline today, closing at 148,781.90, though the YTD return remains robust at 36.97%. Market sentiment was negative, as the breadth indicator hit an extreme low of 0.09x, with just 6 advancers versus 65 decliners. However, both traded volume and turnover surged significantly—volume jumped to 570.30M shares (+64.7% vs. previous day), while market turnover soared to 24.8B Naira (+139.03%). Despite the market-wide sell-off, a handful of stocks saw notable gains, with ETFs and selected financials bucking the trend. Technical signals highlight growing bearish momentum across major blue chips and sector leaders, with only isolated pockets of bullish strength.
Significant Trends in Market Breadth
- Market Breadth: Severely negative at 0.09x—only 6 stocks advanced against 65 decliners. This is the deepest negative breadth in recent weeks and signals potential panic selling/climax.
- Volume Surge: Unusual; over half (84) of listed companies saw volume gains, suggesting intense institutional activity, especially in large caps.
- Turnover Spike: Massive +139.03% jump in traded value, indicating heavy block trades or institutional repositioning despite weak prices.
Top 5 Year-To-Date Gainers & Losers
| Top 5 YTD Gainers | |||||
|---|---|---|---|---|---|
| Stock | Price | %Chg1Dy | %Chg5Dys | %ChgYTD | RSI |
| NCR | 21.25 | 9.82 | 20.74 | 286.36 | 91.03 |
| NEWGOLD ETF | 57,449 | 0.00 | 11.55 | 97.40 | 56.32 |
| NEIMETH | 5.65 | 0.00 | 8.65 | 125.10 | 48.19 |
| DEAPCAP | 1.9 | -10.00 | 7.55 | 42.50 | 57.86 |
| STANBICETF30 | 519.95 | 9.99 | 3.99 | 54.99 | 51.73 |
| Top 5 YTD Losers | |||||
| Stock | Price | %Chg1Dy | %Chg5Dys | %ChgYTD | RSI |
| MULTIVERSE | 10.60 | -9.43 | -26.15 | -30.94 | 19.74 |
| GUINEAINS | 1.05 | -8.57 | -21.95 | -32.39 | 32.30 |
| LINKASSURE | 1.62 | -9.88 | -21.08 | -29.47 | 33.75 |
| VERITASKAP | 1.70 | -10.00 | -19.90 | -27.14 | 29.75 |
| CUSTODIAN | 38.00 | -10.00 | -19.43 | -19.05 | 36.12 |
- NCR (Nigeria): Remains the standout, posting a 9.82% daily gain and holding a remarkable 286.36% YTD return—but RSI at 91 suggests highly overbought/overextended territory.
- STANBICETF30: The only security in both the top price gainers and bullish momentum tables, showing technical as well as return outperformance.
- Losses deepen: YTD losers such as MULTIVERSE and CUSTODIAN continued to slide, many hitting extreme oversold RSI readings (sub-40).
- High Volatility: YTD losers cluster in insurance and small/mid cap names, indicating risk-off sentiment.
Momentum Insights & Hidden Patterns
- Bullish Momentum: Only STANBICETF30 closed above its 15D MA. It’s also today’s top gainer (+9.99%), and it appears in the YTD Top Gainers, marking a rare triple-confluence of strength (momentum, price, and historic outperformance).
- Bull Burnout Watch: NCR’s RSI 91.0 is at textbook overbought levels—risk of snap-back or profit-taking is extremely high, even as price surges.
- Bearish Momentum: Multiple blue chips broke 15DMA from above including JAIZBANK, FIDELITYBK, STANBIC, BUACEMENT, DANGCEM, and DEAPCAP, all with daily price drops exceeding -4.62% to -11.11%. Investors should monitor for continued slide.
- Unusual Volume: STANBIC saw a staggering 888% spike above its 90-day volume average, accompanying a -9.97% drop and negative 15DMA crossover—a major distribution signal.
- Sector Pressure: Major financials and building material stocks are under acute selling, as seen by negative crossover and sharp trade value drops.
Contrarian Signals (Conflicting Technicals)
- NCR: Even as price explodes higher +9.82% and YTD triple-digit gains, its RSI at 91 and unchanged MACD suggest short-term exhaustion. Caution against "chasing” at these highs.
- DEAPCAP: Despite being a recent YTD gainer, its technicals (bearing momentum, 15DMA breakdown, and -10% daily) may signal a near-term reversal or completion of a rally.
- STANBIC: Notable for record high trade volume, but with -9.97% price drop and a move below 15DMA, despite historical beta <0.3, often associated with defensive status.
Sector Heatmap & Technical Summary
| Sector | % Advancers | % Decliners | Major Moves | Bulk of Inst. Trades? | Bullish/Bearish? |
|---|---|---|---|---|---|
| Banking | 0% | 100% | ZENITHBANK -9.4% (20.2% of inst. value), ACCESSCORP -8.3%, FIDELITYBK -9.5% | Yes | Bearish |
| Insurance/Financials | 20% | 80% | NCR +9.8%, DEAPCAP -10% | Moderate | Mixed |
| Building Materials | 0% | 100% | BUACEMENT -11.1%, DANGCEM -11.1% | No | Bearish |
| ETF | 40% | 60% | STANBICETF30 +10% | Low | Bullish (selected) |
| Beverages/Brewers | 0% | 100% | NB -7.98%, GUINNESS -3.79% | No | Bearish |
| Oil & Gas | 0% | 100% | OANDO -10% | Low | Bearish |
Dividend / Beta Defensive Stocks Matrix
| Stock | Div Yield (%) | Beta | Sector | YTD (%) | Notes |
|---|---|---|---|---|---|
| ZENITHBANK | 2.25 | 1.20 | Banking | -21.74 | High Div, High Risk. But under intense selling. Institutional flows high. |
| FIDELITYBK | 5.48 | 0.89 | Banking | N/A | Yield defensive, but negative trend short-term. |
| BUACEMENT | 2.11 | 1.36 | Building Materials | N/A | High Beta, moderate yield; now in technical sell-off. |
| JAIZBANK | 1.67 | 1.14 | Banking | N/A | Low yield, beta near 1—currently bearish signal. |
- Defensive Play: No high yielding, low-beta stock is currently in a bullish technical phase. Recent 'defensive' classics are in distribution, not accumulation.
- AFRIPRUD (referenced): 1.27% yield, Beta 0.64, but absent from momentum/gainers tables—suggest possible rotation away from yield to liquid large caps.
Institutional Clustering Alerts
- ZENITHBANK: 20.17% share of institutional volume, accounting for 37% of all trades by value/volume in the sector. Net price action sharply negative; institutional money appears to be offloading/redistributing in size.
- STANBIC and FIRSTHOLDCO: Unusual volume spikes and high institutional activity, but price action is negative on both—a classic "sell the rally” or "exit liquidity” picture.
Dividend Yield Meets Momentum: Implications
- Note: None of the day’s bullish momentum or top gainer names have a material dividend yield. This indicates the day’s strength is momentum/sentiment driven, not income/yield rotation.
- High Dividend Bearish: Several high-yield bank stocks (ZENITHBANK, FIDELITYBK, UBA) are in bearish momentum tables and see heavy institutional selling—signal for caution.
- Income portfolios should avoid chasing high-yielders while they are in technical breakdown.
Actionable Suggestions & Caution for Traders
- Don’t fight the trend: Market is in distribution—new longs should be avoided except in isolated ETFs or momentum pockets (e.g. STANBICETF30).
- Volatility spike: Be wary of liquidity gaps—wide trading bands appearing in high-volume names. Wait for stabilization before bottom-fishing.
- Profit-taking in Overbought Stocks: NCR RSI warns of likely near-term mean reversion; consider tightening stops or partial exits if long.
- Institutional flows indicate risk-off: Watch for rebound signals; otherwise, avoid crowded longs in names like ZENITHBANK, ACCESSCORP, STANBIC, DANGCEM.
- Short-term Contrarian Play: If new support forms in severely oversold bank or cement heavyweights, oversold RSI (<35) may prove buyable—but not until volume subsides.
Market Activity & Flow Insights
- Institutional vs Retail: Institutional investors dominated volume (70.03%) and value (92.79%), but made up only 37.05% of trade count (larger ticket size). Retail made up 63% of trades but only 7.21% of value—small lots.
- Top Institutional Stocks (by trade value): ZENITHBANK, ARADEL, ACCESSCORP, GTCO, UBA. All are major banking/financial sector names and each saw heavy price declines (from -7.7% to -9.4%), suggesting broad sector redemptions.
- Top Retail Traded Stocks: MTNN, ZENITHBANK, ACCESSCORP, UBA, GTCO—all high-liquidity blue chips, with price action mirroring institutional trades and declines, indicating no "safe haven" among big names.
- Correlation: Both retail and institutional flows converged on the same names, amplifying directional moves and suggesting little divergence in sentiment.
- Implication: The rally in daily turnover is due to forced or risk-off repositioning, rather than fresh capital inflow—caution is warranted on rebounds.
Summary: Look for support in high-quality names after current selling exhausts. Until then, focus on defensive trading—preserve capital and avoid buying into sharp falls unless clear reversal signals (RSI, volume contraction, bullish MACD) emerge.
|
Top ASI Gainers Over Last 5 Trading Days
|
Top ASI Losers Over Last 5 Trading Days
|
For more detailed analysis, on InfoWARE Market Data Terminal <NSEPERF> <GO>
On InfoWARE Finance Mobile App (Android, iPhone & iPad, Windows Phone and Windows 8/10), "Top Gainers & Losers"
STANBIC IBTC ETF 30 (STANBICETF30) topped the advancers list closing at N571.93 with a gain of 10.00% followed by NCR (NIGERIA) PLC. (NCR) which closed at N21.25 with a gain of 9.82%.
On the flip side ACADEMY PRESS PLC. (ACADEMY) and BUA CEMENT PLC (BUACEMENT) topped the decliners log with a loss of -10.00% at a close of N6.75, and -10.00% to close the day at N162.00 respectively.
| Symbol | LClose | %Chg |
|---|---|---|
| STANBICETF30 | 571.93 | 10.00 |
| NCR | 21.25 | 9.82 |
| BERGER | 36.00 | 2.56 |
| FCMB | 10.50 | 0.96 |
| MANSARD | 12.10 | 0.25 |
For more detailed analysis,
- On InfoWARE Market Data Terminal <TOPG> <GO>
- On InfoWARE Finance Mobile App ( Android, iPhone & iPad and Windows 10) , "Top Gainers & Losers"
Currency Market
In the currency market, the Naira was unchanged against the dollar at 1 to 1NSE: Bull Signal - Price crossed above 15 Day MA
This signal implies these stocks are under buying pressure and the price might continue to rise and therefore positions should be monitored closely. Further suggested analysis include looking at the overall market (ASI) to see if the uptrend is market wide, sector wide or specific to the stock. Portfolio managers tend to use this as a signal to do more research to add to their positions or lock in some profits. Typically further analysis should be done using commands like PC and RV on the InfoWARE Market Data Terminal. Another command is ALERTS to set price triggers for possible exit or entry as necessary
For more detailed analysis,
- On InfoWARE Market Data Terminal <NSEPERF> <GO>
- On InfoWARE Finance Mobile App ( Android , iPhone & iPad and Windows 10) , "Top Gainers & Losers"
| Symbol | Price | %Chg | 15DMA | PE | EPS | DivY | MktCap | Vol | Trades | Value | LstTradeTime |
|---|---|---|---|---|---|---|---|---|---|---|---|
| STANBICETF30 | 571.93 | 9.09 | 527.79 | 0.00 | 0.00 | 5.75K | 72.00 | 3.08M | 11-Nov-2025 14:36:08.200 |
NSE: BEAR Signal - Price crossed below 15 Day MA
This signal implies these stocks are under selling pressure and the price might continue to slide and therefore positions should be monitored closely. Further suggested analysis include looking at the overall market (ASI) to see if the downtrend is market wide, sector wide or specific to the stock. If the overal market trend is upwards, then since these stocks are heading in the opposite direction, then further analysis should be done using commands like PC and RV on the InfoWARE Market Data Terminal. Another command is ALERTS to set price triggers for possible exit is necessar
For more detailed analysis,
- On InfoWARE Market Data Terminal <BEARM> <GO>
- On InfoWARE Finance Mobile App ( Android , iPhone & iPad and Windows 10)
| Symbol | Price | %Chg | 15DMA | PE | EPS | DivY | MktCap | Vol | Trades | Value | LstTradeTime |
|---|---|---|---|---|---|---|---|---|---|---|---|
| FGS202884 | 92.63 | 0.00 | 92.63 | 0.00 | 0.00 | 0.00 | 0.00 | 0.00 | 11-Nov-2025 14:35:24.070 | ||
| JAIZBANK | 4.34 | -4.84 | 4.42 | 83.05 | 0.03 | 1.67 | 149.91B | 29.76M | 406.00 | 131.43M | 11-Nov-2025 14:36:11.130 |
| VSPBONDETF | 204.00 | -6.86 | 212.69 | 0.00 | 0.00 | 2.73K | 4.00 | 590.83K | 11-Nov-2025 14:36:08.270 | ||
| FIDELITYBK | 17.90 | -9.50 | 19.08 | 13.24 | 1.17 | 5.48 | 518.65B | 38.48M | 857.00 | 693.73M | 11-Nov-2025 14:36:07.943 |
| MAYBAKER | 16.00 | -10.00 | 17.45 | 58.94 | 0.14 | 3.75 | 27.60B | 1.73M | 110.00 | 27.64M | 11-Nov-2025 14:35:13.543 |
| VETGOODS | 35.00 | -10.00 | 36.98 | 0.00 | 0.00 | 138.09K | 16.00 | 4.93M | 11-Nov-2025 14:36:08.227 | ||
| LIVESTOCK | 6.70 | -10.45 | 7.30 | 0.00 | 0.00 | 2.94 | 20.10B | 1.06M | 97.00 | 7.12M | 11-Nov-2025 14:35:12.943 |
| FGS202789 | 90.36 | -10.67 | 95.36 | 0.00 | 0.00 | 400.00 | 1.00 | 361.45K | 11-Nov-2025 14:35:23.970 | ||
| STANBIC | 101.15 | -11.07 | 110.43 | 6.87 | 8.23 | 3.54 | 1,310.60B | 31.55M | 218.00 | 3.19B | 11-Nov-2025 14:35:18.080 |
| BUACEMENT | 162.00 | -11.11 | 177.40 | 0.00 | 0.00 | 2.11 | 5,486.03B | 274.02K | 250.00 | 44.39M | 11-Nov-2025 14:34:04.570 |
| DANGCEM | 594.00 | -11.11 | 654.49 | 761.31 | 0.63 | 6.27 | 10,122.06B | 1.77M | 532.00 | 1.05B | 11-Nov-2025 14:36:08.310 |
| DEAPCAP | 1.71 | -11.11 | 1.73 | 188.84 | 0.01 | 13.76 | 2.57B | 1.21M | 54.00 | 2.09M | 11-Nov-2025 14:34:36.487 |
Economic Indicators - Nigeria FX Reserves Vs ASI Chart
Nigeria FX Reserves are assets held on reserve by CBN in foreign currencies. These reserves are used to back liabilities and influence monetary policy. Given the nature of the Nigeria economy, FX Reserves can appear to have an outsize influence on the economy and hence on the capital market. The chart below allows comparison of FX Reserves against the ASI to make investment decisions

For more detailed analysis,
- On InfoWARE Market Data Terminal <CI> <GO>
- On InfoWARE Finance Mobile App ( Android , iPhone & iPad and Windows 10) , "Research"
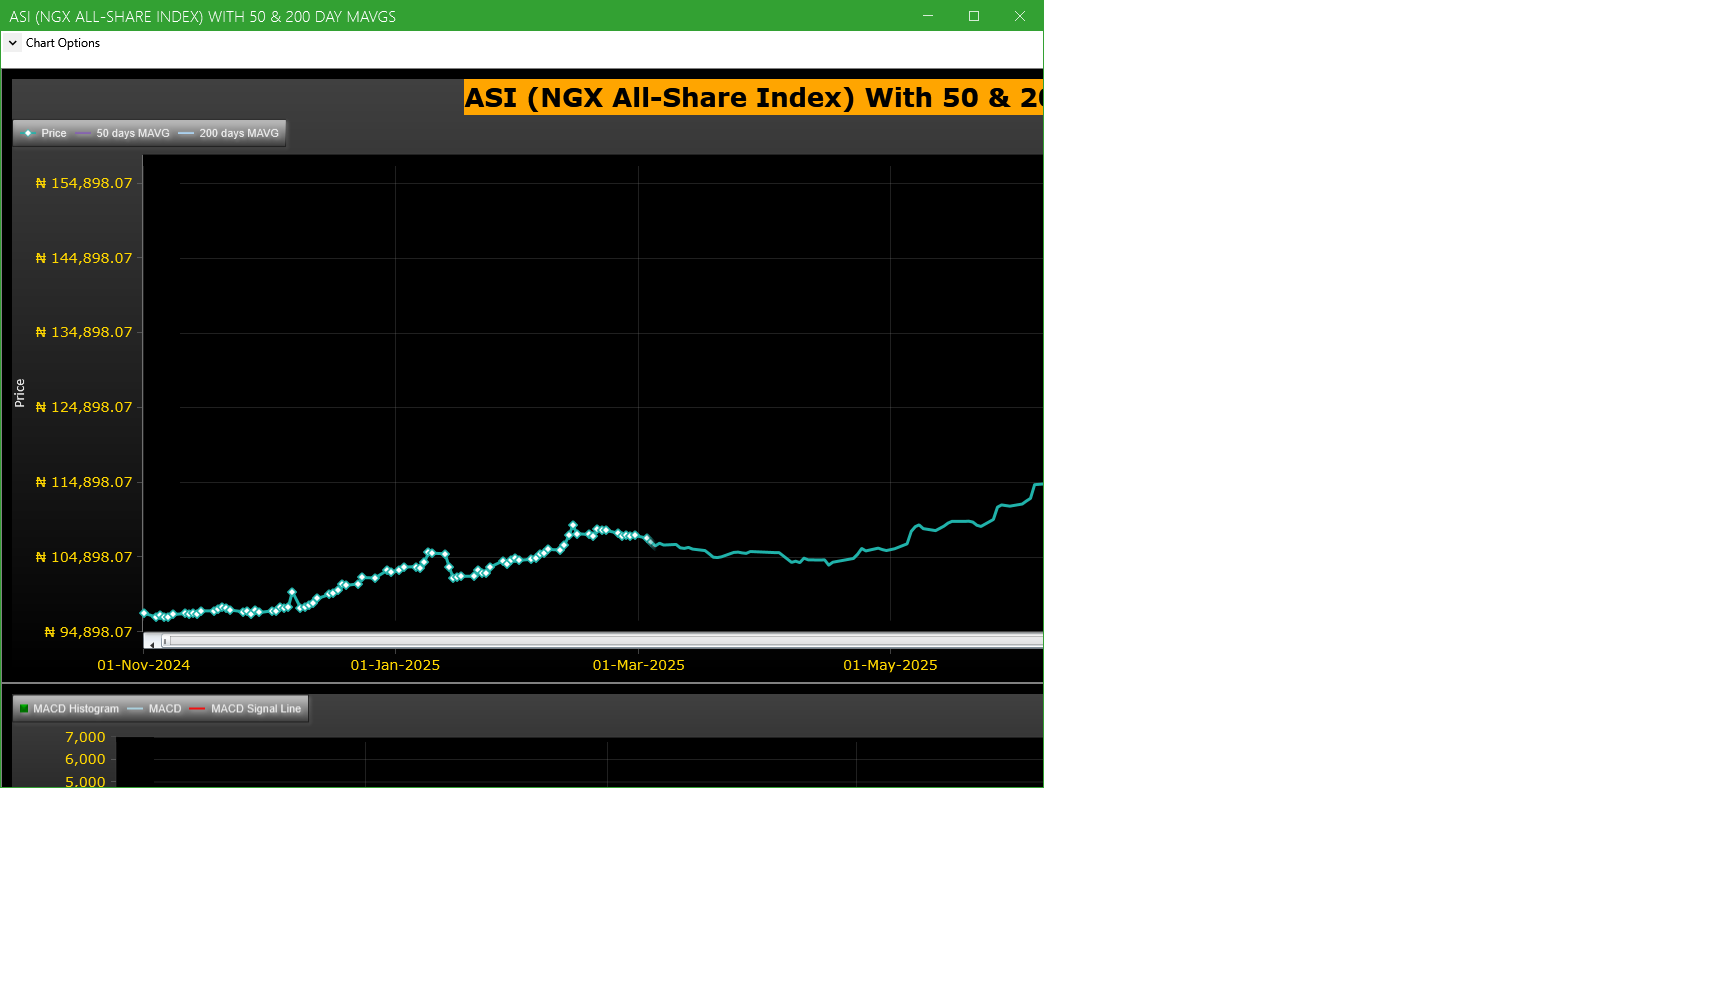
Market Trend - ASI (NGX All-Share-Index) With 50 & 200 Day MAvgs Chart
Technical traders typically use the 50 & 200 day moving averages to aid in choosing
where to enter or exit a position, which then causes these levels to act as strong
support or resistance. As a general guideline, if the price is above a moving average,
the trend is up. If the price is below a moving average, the trend is down.
It is important to note that critics of technical analysis say that moving averages act
as support and resistance because so many traders use these indicators to inform their
trading decisions. Also moving averages tend to work quite well in strong trending conditions
but poorly in choppy or ranging conditions.
Trading Strategies: Crossovers
Crossovers are one of the main moving average strategies. The first type is a price crossover,
which is when the price crosses above or below a moving average to signal a potential change
in trend. Another strategy is to apply two moving averages to a chart: one longer and one
shorter. When the shorter-term MA crosses above the longer-term MA, it is a buy signal, as
it indicates that the trend is shifting up. This is known as a golden cross. Meanwhile, when
the shorter-term MA crosses below the longer-term MA, it is a sell signal, as it indicates that
the trend is shifting down. This is known as a dead/death cross
For more detailed analysis,
- On InfoWARE Market Data Terminal <CI> <GO>
- On InfoWARE Finance Mobile App ( Android , iPhone & iPad and Windows 10) , "Research"
Unusual Volume: Volume traded is more than double the 90 day moving average (All exchanges; ASI & ASem). For more detailed analysis,
- On InfoWARE Market Data Terminal <UV> <GO>
- On InfoWARE Finance Mobile App ( Android , iPhone & iPad and Windows 10)
| Symbol | Name | Volume | 90DAvgVol | %VolChg | Price | LClose | %Chg | Trades | Value |
|---|---|---|---|---|---|---|---|---|---|
| FIRSTHOLDCO | FIRST HOLDCO PLC | 68.27M | 18.28M | 273.49 | 30.90 | 31.50 | -1.90 | 437 | 2.11B |
| STANBIC | STANBIC IBTC HOLDINGS PLC | 31.55M | 3.19M | 888.52 | 101.15 | 112.35 | -9.97 | 218 | 3.19B |
| JAIZBANK | JAIZ BANK PLC | 29.76M | 10.11M | 194.29 | 4.34 | 4.55 | -4.62 | 406 | 131.43M |
| NB | NIGERIAN BREW. PLC. | 23.88M | 7.51M | 217.84 | 60.00 | 65.20 | -7.98 | 340 | 1.55B |
| GUINNESS | GUINNESS NIG PLC | 8.64M | 1.02M | 743.89 | 170.00 | 176.70 | -3.79 | 127 | 1.46B |
Investment Insights - High Div. Stocks
Dividend stocks distribute a portion of the company earnings to investors on a regular basis and they can a great choice for investors looking for regular income. As an investment or trading strategy, high dividend yield equities provide annual cash payments as against mostly capital gains in the price of a stock. The list in the table below represent the highest dividend paying stocks from the list of the most liquid stocks in the NSE top 30.

For more detailed analysis,
- On InfoWARE Market Data Terminal <HYIELD> <GO>
- On InfoWARE Finance Mobile App ( Android , iPhone & iPad and Windows 10) , "Research"
African Markets
| Name | LClose | Change | %Chg |
|---|---|---|---|
| BRVM Stock Exchange | 335.94 | -0.57 | -0.17 |
| Botswana Stock Exchange | 10,620.30 | 4.25 | 0.04 |
| Egyptian Exchange | 40,427.35 | -395.99 | -0.97 |
| Ghana Stock Exchange | 8,172.30 | -56.78 | -0.69 |
| Johannesburg Stock Exchange | 110,841.60 | 1,991.95 | 1.83 |
| Lusaka Stock Exchange | 25,378.76 | 2.54 | 0.01 |
| Casablanca Stock Exchange | 19,064.05 | -204.24 | -1.06 |
| Malawi Stock Exchange | 631,054.62 | 17,068.81 | 2.78 |
| Nigeria Stock Exchange | 148,781.90 | -747.65 | -0.50 |
| Nairobi Securities Exchange | 190.54 | -1.54 | -0.80 |
| Namibian Stock Exchange | 1,980.63 | 20.19 | 1.03 |
| Rwanda Stock Exchange | 179.09 | 0.00 | 0.00 |
| Tunis Stock Exchange | 12,756.58 | 34.35 | 0.27 |
| Uganda Securities Exchange | 1,623.35 | 36.19 | 2.28 |
Nigeria Market Indexes
| Symbol | LClose | %Chg | WTD% | MTD% | QTD% | YTD% | MktCap | Trades |
|---|---|---|---|---|---|---|---|---|
| ASI | 141,327.30 | -5.01 | -5.04 | -8.07 | -1.16 | 36.97 | 27,574 | |
| NGX30 | 5,177.36 | -5.17 | -5.20 | -8.17 | -0.78 | 35.72 | 15,669 | |
| NGXAFRBVI | 2,869.44 | -8.57 | -8.57 | -13.53 | -19.16 | 15.67 | 6,882 | |
| NGXAFRHDYI | 19,528.79 | -5.01 | -5.01 | -10.41 | -12.27 | 14.69 | 7,278 | |
| NGXASEM | 1,392.88 | 0.00 | 0.00 | 0.00 | -9.44 | -12.05 | 2 | |
| NGXBNK | 1,298.86 | -7.27 | -7.27 | -11.23 | -14.37 | 19.44 | 7,503 | |
| NGXCG | 3,633.94 | -6.63 | -6.63 | -11.10 | -10.29 | 28.44 | 15,570 | |
| NGXCNSMRGDS | 3,323.92 | -2.20 | -2.20 | -6.41 | -1.74 | 91.65 | 3,361 | |
| NGXCOMMDTY | 1,185.31 | -2.07 | -2.07 | -1.86 | 5.66 | 18.53 | ||
| NGXGROWTH | 14,304.70 | -0.10 | -0.10 | -7.76 | -5.09 | 84.27 | 441 | |
| NGXINDUSTR | 5,387.16 | -8.55 | -8.55 | -9.55 | 6.30 | 50.83 | 1,787 | |
| NGXINS | 1,042.64 | -4.33 | -4.33 | -14.04 | -12.83 | 32.62 | 1,940 | |
| NGXLOTUSISLM | 12,498.37 | -5.41 | -5.41 | -8.18 | 5.28 | 79.37 | 4,823 | |
| NGXMAINBOARD | 6,874.04 | -3.50 | -3.56 | -6.21 | -2.42 | 37.37 | 18,968 | |
| NGXMERIGRW | 9,686.26 | -2.93 | -2.93 | -6.14 | -2.19 | 48.49 | 3,791 | |
| NGXMERIVAL | 11,737.01 | -5.50 | -5.50 | -9.93 | -12.20 | 12.53 | 8,596 | |
| NGXOILGAS | 2,644.24 | -4.65 | -4.65 | -5.50 | 4.68 | -2.47 | 391 | |
| NGXPENBRD | 2,653.48 | -5.09 | -5.09 | -7.59 | 0.09 | 44.87 | 22,672 | |
| NGXPENSION | 6,306.80 | -5.73 | -5.73 | -9.31 | -6.40 | 39.10 | 17,157 | |
| NGXPREMIUM | 13,905.30 | -7.79 | -7.79 | -11.49 | 1.56 | 42.87 | 8,165 | |
| NGXSOVBND | 668.40 | 0.00 | 0.00 | 0.00 | 1.69 | 11.11 | 0 |
For more detailed analysis,
- On InfoWARE Market Data Terminal <MKTINS> <GO>
- On InfoWARE Finance Mobile App ( Android, iPhone & iPad and Windows 10) , "Market Indexes"
Find the topic interesting? Will like to comment? Contact Us at solutions@infowarelimited.com
Top News

Chart Of The Day - ASI Chart Vs ASI Advance Decline Line (YTD) (11-Nov-2025 15:08:12.741)
InfoWARE AI Analyst Daily Market Report: 11-Nov-2025

[XNSA]>> RESIGNATION OF A DIRECTOR
[VETBANK]>> DAILY INDICATIVE PRICES
[XNSA]>> H2 2025 BC/DR TEST
[XNSA]>> NGX FIXED INCOME INDICATIVE PRICE LIST FOR NOV 11, 2025
[XNSA]>> AELP CAPACITY BUILDING & ASSDA FORUM
[XNSA]>> LISTING OF MINISTRY OF FINANCE INCORPORATED SERIES 2 FUND
[XNSA]>> CORDROS MILESTONE FUNDS' BID & OFFER PRICES
[STANBICETF30]>> DAILY INDICATIVE PRICES
[XNSA]>> CLOSING GONG CEREMONY
Chart Of The Day - ASI Chart Vs ASI Advance Decline Line (YTD) (10-Nov-2025 15:08:54.385)
InfoWARE AI Analyst Daily Market Report: 10-Nov-2025
[XNSA]>> DAILY FUND PRICE SUBMISSION - FCMB ASSET MANAGEMENT LIMITED
[VSPBONDETF]>> DAILY INDICATIVE PRICES
[XNSA]>> NGX FIXED INCOME INDICATIVE PRICE LIST FOR NOV 10, 2025
[XNSA]>> H2 2025 BC/DR TEST
[LOTUSHAL15]>> DAILY INDICATIVE PRICES
[XNSA]>> AELP CAPACITY BUILDING & ASSDA FORUM
[XNSA]>> FACTS BEHIND THE OFFER PRESENTATION BY ELLAH LAKES PLC
[XNSA]>> EMERGING AFRICA DAILY MUTUAL FUND PRICES
[XNSA]>> CORDROS MILESTONE FUNDS' BID & OFFER PRICES
[XNSA]>> NOTIFICATION OF PRICE ADJUSTMENT
InfoWARE Analyst Daily Market Report (10-Nov-2025 06:51:14.061)
InfoWARE AI Analyst Weekly Market Report: 07-Nov-2025
Chart Of The Day - ASI Chart Vs ASI Advance Decline Line (YTD) (07-Nov-2025 15:07:17.151)
InfoWARE AI Analyst Daily Market Report: 07-Nov-2025
[XNSA]>> NORRENBERGER MUTUAL FUNDS WEEKLY UPDATE
[MERVALUE]>> DAILY INDICATIVE PRICES
[LOTUSHAL15>> DAILY INDICATIVE PRICES
Get IDIA - the stock trading app for the modern investor
Solutions by Business
Product Suites
Company
Contacts
- 8th Floor,
- South Atlantic Petroleum Towers,
- 1 Adeola Odeku Street,
- Victoria Island,
- Lagos, Nigeria.
- Email: solutions@infowarelimited.com
Follow Us
 |
 |
 |
 |