


InfoWARE AI Analyst Daily Market Report: 10-Nov-2025 | InfoWARE Finance
Get IDIA - the stock trading app for the modern investor


InfoWARE AI Analyst Daily Market Report: 10-Nov-2025
(Source: InfoWARE Terminal, Date: 10-Nov-2025)
Dear Investor,
NGX Market Summary – Monday, November 10, 2025
Market Recap:
The NGX All Share Index (ASI) slipped -0.46% today to close at 149,524.81, continuing a recent softening after robust YTD returns of 44.24%. Activity moderated from the prior session as volume decreased to 346.26M shares and turnover fell -24.88% to 10.38B Naira, underlining a risk-averse tone. Market breadth was extremely narrow (0.30x), with only 14 advancers and a heavy 47 decliners -- further illustrating sellers’ dominance at the start of the week.
Winners included ASO SAVINGS (+10% , unusual volume up 127% above 90-day average) while DEAP CAPITAL (-9.83%, also high volume) topped losers. In spite of the pullback, U.S. Dollar-Naira exchange saw a further firming of the Naira (+0.30%) to 1,438 per dollar.
Significant Trends in Market Breadth
- Decliners Dominated: Just 14 stocks advanced vs. 47 decliners (breadth 0.30x), flagging broad-based selling.
- Turnover & Participation: Both volume and value fell, a classic sign of "risk-off” as institutions retreated. Notably, institutional trades made up 82.4% of traded value despite just 38.4% of trades by count, showing high-value blocks were driving the tape.
- Mixed Volume Action: 68 stocks saw increasing volume, while 74 fell -- suggesting selective but scattered interest instead of outright panic.
Top Gainers & Losers — Standout Performers
| Stock | Close | %Change | RSI | MACD |
|---|---|---|---|---|
| ASOSAVINGS | 0.99 | +10.00% | 67.0 | 0.13 |
| DEAPCAP | 1.90 | +9.83% | 51.0 | 0.0014 |
| CORNERST | 6.00 | +8.70% | 41.6 | -0.14 |
| NEIMETH | 5.65 | +8.65% | 34.0 | -0.25 |
| JAPAULGOLD | 2.23 | +6.70% | 29.9 | -0.13 |
| Stock | Close | %Change | RSI | MACD |
|---|---|---|---|---|
| RTBRISCOE | 3.06 | -10.00% | 49.5 | -0.05 |
| LINKASSURE | 1.62 | -10.00% | 40.4 | -0.05 |
| NAHCO | 95.00 | -9.95% | 40.9 | -0.32 |
| AIICO | 3.37 | -9.89% | 47.5 | -0.04 |
| MBENEFIT | 3.37 | -9.89% | 46.6 | -0.02 |
- ASOSAVINGS (+10%) surged on volume 127% above normal — signaling heightened speculative interest.
- DEAPCAP is the only gainer (9.8%) from both today’s and YTD tables, supported by large volume and mid-level RSI (not yet overbought).
- NAHCO (-9.95%) posted an outsized loss on volume more than double its 90DMA, perhaps flushed by profit taking from its high YTD.
- LINKASSURE (-10%) — persistent YTD underperformer, now making another new low, deepening negative momentum.
Key Insights & Analytical Takeaways
- Turnover Decline: A -24.9% drop in traded value sends a warning on conviction: institutional appetite has waned. Short-term rallies could lose steam unless turnover recovers.
- Advancers/Decliners Trend: Only 14 gainers out of 126 active stocks is a red flag, especially as the market has generated huge YTD returns — a classic rotation from leaders to laggards may be underway.
-
Unusual Volume Stocks:
- DEAPCAP, ASOSAVINGS, DANGCEM, PZ, and NAHCO all saw 2–2.5x their average volumes — these are likely the battleground stocks for the week, with a mix of momentum chasers and profit takers.
- PZ saw heavy volume but fell -3.02%, potentially an early warning of distribution in consumer stocks.
-
Momentum Tables Cross-analysis:
- NEIMETH appears in both top gainers and as a bullish momentum name (price above 15DMA). Its RSI (34) is below "overbought” (70), suggesting further headroom for uptrend before exhaustion.
- No major YTD top gainers are currently registering bullish signals (RSI > 70). Caution: The lack of extremely "overbought” RSI prints signals most rallying stocks have room to run or are resetting for another go higher.
- LINKASSURE is both a top daily and YTD loser — confirming entrenched downtrend.
- On the bearish momentum side, several large caps (e.g., PRESCO, VITAFOAM, UNILEVER) have just broken below their 15DMA; combined with their relatively high dividend yields, these could attract bottom-fishers seeking mean reversion trades.
Contrarian Signals: Hidden & Conflicting Indicators
-
CHAMPION BREWERIES (CHAMPION):
- YTD: -9.80% (Loser), but RSI is middle zone (54.4), and MACD just turned bullish.
- Potential reversal? Watch for volume confirmation; technicals hint a bottoming process is in effect despite YTD weakness.
- PZ Cussons: Large "unusual” volume accompanied by price drop. Possibility: Institutions quietly unloading? Contrarians might want to monitor for capitulation lows.
- NAHCO: Despite a one-day collapse and now among YTD losers, its YTD return is still high (nearly +98%). RSI (40.8) is not "oversold”; suggesting room for another leg lower… BUT volume spike and strong longer-term uptrend could attract swing traders looking for a sharp bounce.
Sector Heatmaps
| Sector | Leading Stock (by Volume/Trend) | Momentum | Trend Signal |
|---|---|---|---|
| Banking | FIDELITYBK (price above 15DMA) | Bullish (FIDELITYBK +4.6%) | Moving average crossover, tested by profit taking in ACCESSCORP & ZENITHBANK |
| Consumer Goods | PZ (high volume, -3.02%) | Mixed | Heavy volume—possible selling in blue chip consumer |
| Insurance | LINKASSURE (-10%, among YTD losers) | Bearish | Persistently weak, multiple names in downtrend |
| Others | ASOSAVINGS (Mortgages, +10%) | Speculative/Hot | Unusual volume, price momentum |
Dividend–Beta Matrix: Defensive Stock Opportunities
| Stock | Dividend Yield | Beta | Momentum Status | Signal |
|---|---|---|---|---|
| FIDELITYBK | 5.48% | 0.89 | Bullish (above 15DMA) | Defensive Yield Play rising with market |
| AFRIPRUD | 1.27% | 0.64 | - | Stable low beta, moderate yield – safe harbor if volatility worsens |
| VITAFOAM | 7.03% | 0.47 | Bearish (below 15DMA) | High yield, but in technical decline – "yield trap” risk |
| PRESCO | 0.44% | 0.31 | Bearish (below 15DMA) | Low beta, but momentum negative |
Institutional Clustering Alerts
- ZENITHBANK: Institutions accounted for 20.17% of institutional trade value—highest among peers— signaling fund concentration. ZENITHBANK is also a retail trade favorite. This dual participation can imply high liquidity but also raise volatility if flows reverse.
- DANGCEM: Another institutional darling (18.68% of value), on 151% of avg volume but with zero price change, implying buyers and sellers reached temporary equilibrium. Watch for breakout.
Trader Pointers & Cautions
- Momentum Watch: NEIMETH and FIDELITYBK have crossed above their 15DMA and remain well below "overbought” RSI. These could trend further up barring market-wide risk-off events.
- Yield Traps: Some high dividend payers (VITAFOAM, PRESCO) are breaking down technically. Avoid "buying the dip” blindly until momentum reverses.
- YTD Top Performer Weakness: NAHCO’s sharp slump on heavy volume may portend post-earnings profit taking or institutional derisking – could be susceptible to further swings.
- Bargain Radar: "Contrarian alert” on CHAMPION – YTD loser but with improving technicals; volume confirmation needed.
Mon/Tue: YTD Gainers & Losers (Highlights)
| Stock | YTD % | RSI | MACD |
|---|---|---|---|
| EUNISELL | +267.9% | 84.7 | 7.41 |
| NCR | +251.8% | 91.0 | 0.74 |
| VETGOODS | +123.8% | 72.9 | 0.64 |
| NEIMETH | +125.1% | 34.0 | -0.25 |
| NEWGOLD ETF | +97.4% | 56.3 | 360.8 |
| Stock | YTD % | RSI | MACD |
|---|---|---|---|
| TIP | -300.0% | 33.5 | -0.38 |
| LINKASSURE | -25.6% | 40.4 | -0.05 |
| MULTIVERSE | -31.7% | 27.6 | -0.15 |
| CHAMPION | -254.3% | 37.0 | -0.32 |
| NAHCO | -97.9% | 40.9 | -0.32 |
Market Activity: Retail vs Institutional Dynamics
- Trade Count: Retail dominated by number (61.6% of trades), yet controlled less than half the volume (45.9%) and just 17.6% of value.
- Institutions: Concentrated large block trades (just 38.4% of trades but 82.4% of value), especially in ZENITHBANK, DANGCEM, ACCESSCORP. Mean institutions are taking fewer but larger positions, possibly rebalancing post-Earnings/YTD run-up.
-
Retail "Most Traded” Stocks: MTNN, ZENITHBANK, GTCO, ACCESSCORP, UBA. High overlap with institutional list except for MTNN (heavily traded by retail only). This pattern implies:
- ZENITHBANK, GTCO, ACCESSCORP are highly liquid and favored by both camps—suitable for tactical trades.
- MTNN is a retail favorite but not heavily traded by institutions today, signaling possible price inefficiency opportunities.
- Unusual Volumes: Institutional names (DEAPCAP, DANGCEM) and speculative retail (ASOSAVINGS) overlap, potentially creating volatility and "volume pivots” for swing/trend traders.
Previous Week’s Performance Snapshot
Summary: Markets rallied strongly into the end of last week, led by speculative names and ETFs. Early strength has faded as investors lock in profits and rotate into defensives. The ASI now consolidates after a 44% YTD run, and Friday’s heavy turnover and volume spikes in select names hinted at the leadership exhaustion.
Summary & Suggestions for Traders
- For Bulls: Watch NEIMETH, FIDELITYBK, and other 15DMA breakout names for momentum continuation. Institutions may re-enter as volume/vix normalizes.
- For Bears: Avoid "catching falling knives” in perennial losers like LINKASSURE or heavily sold sectors unless clear reversal signals emerge.
- For Contrarians: Look for exhaustion signals or potential snap-backs in high-volume underperformers (PZ, NAHCO, CHAMPION) — confirm with volume reversals and MACD crossovers.
- Yield Hunters: Avoid stocks just for yield when technicals are negative (VITAFOAM, PRESCO). Focus on those combining defensive yield, low beta and upward momentum (e.g., FIDELITYBK, AFRIPRUD).
- General Caution: With breadth so poor, use stops liberally and wait for turnover rebound before betting on a broad rally. Defensive allocations (cash, ETFs) prudent until sector trends stabilize.
|
Top ASI Gainers Over Last 5 Trading Days
|
Top ASI Losers Over Last 5 Trading Days
|
For more detailed analysis, on InfoWARE Market Data Terminal <NSEPERF> <GO>
On InfoWARE Finance Mobile App (Android, iPhone & iPad, Windows Phone and Windows 8/10), "Top Gainers & Losers"
ASO SAVINGS AND LOANS PLC (ASOSAVINGS) topped the advancers list closing at N0.99 with a gain of 10.00% followed by DEAP CAPITAL MANAGEMENT & TRUST PLC (DEAPCAP) which closed at N1.90 with a gain of 9.83%.
On the flip side LINKAGE ASSURANCE PLC (LINKASSURE) and R T BRISCOE PLC. (RTBRISCOE) topped the decliners log with a loss of -10.00% at a close of N1.62, and -10.00% to close the day at N3.06 respectively.
| Symbol | LClose | %Chg |
|---|---|---|
| ASOSAVINGS | 0.99 | 10.00 |
| DEAPCAP | 1.90 | 9.83 |
| CORNERST | 6.00 | 8.70 |
| NEIMETH | 5.65 | 8.65 |
| JAPAULGOLD | 2.23 | 6.70 |
| Symbol | LClose | %Chg |
|---|---|---|
| LINKASSURE | 1.62 | -10.00 |
| RTBRISCOE | 3.06 | -10.00 |
| NAHCO | 95.00 | -9.95 |
| MBENEFIT | 3.37 | -9.89 |
| AIICO | 3.37 | -9.89 |
For more detailed analysis,
- On InfoWARE Market Data Terminal <TOPG> <GO>
- On InfoWARE Finance Mobile App ( Android, iPhone & iPad and Windows 10) , "Top Gainers & Losers"
Currency Market
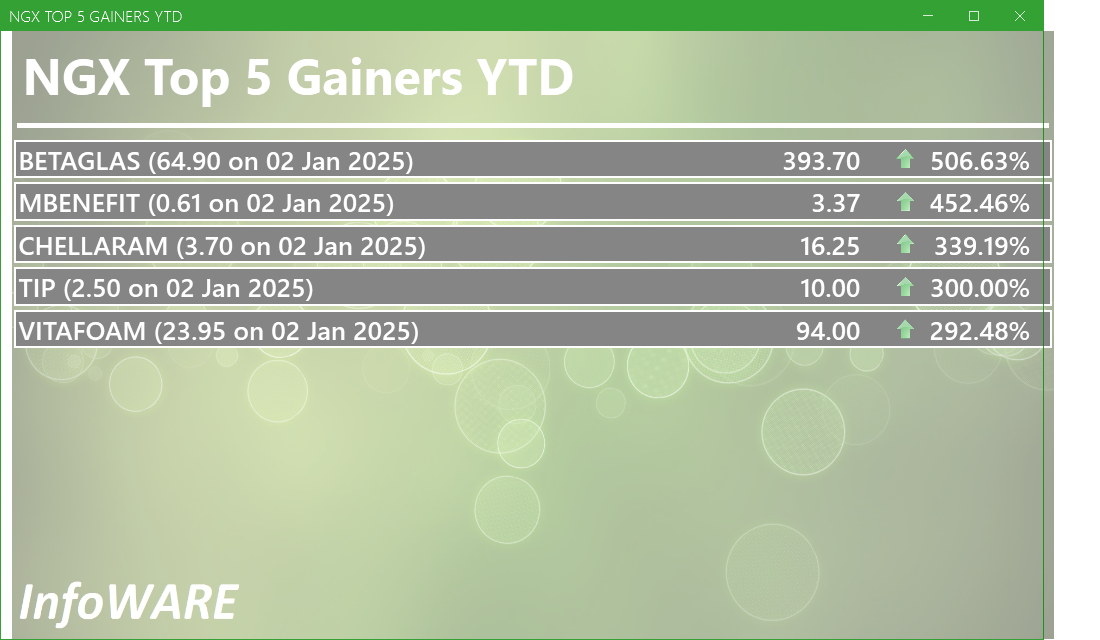
In the currency market, the Naira appreciated 0.30%(4.29) against the Dollar to settle at 1 to 1Investment Insights - Top 5 Gainers YTD
These stocks are the best performers whose price has risen faster than the market as a whole with the best returns year to date. Momentum investors believe that stocks that have outperformed the market will often continue to do so because the factors that caused them to outperform will not suddenly disappear. In addition, other investors seeking to benefit from the stock’s outperformance will often purchase the stock, further bidding its price higher and pushing the stock higher still
For more detailed analysis,
- On InfoWARE Market Data Terminal <T5YTD2> <GO>
- On InfoWARE Finance Mobile App ( Android , iPhone & iPad and Windows 10) , "Research"
NSE: Bull Signal - Price crossed above 15 Day MA
This signal implies these stocks are under buying pressure and the price might continue to rise and therefore positions should be monitored closely. Further suggested analysis include looking at the overall market (ASI) to see if the uptrend is market wide, sector wide or specific to the stock. Portfolio managers tend to use this as a signal to do more research to add to their positions or lock in some profits. Typically further analysis should be done using commands like PC and RV on the InfoWARE Market Data Terminal. Another command is ALERTS to set price triggers for possible exit or entry as necessary
For more detailed analysis,
- On InfoWARE Market Data Terminal <NSEPERF> <GO>
- On InfoWARE Finance Mobile App ( Android , iPhone & iPad and Windows 10) , "Top Gainers & Losers"
| Symbol | Price | %Chg | 15DMA | PE | EPS | DivY | MktCap | Vol | Trades | Value | LstTradeTime |
|---|---|---|---|---|---|---|---|---|---|---|---|
| NEIMETH | 5.65 | 7.96 | 5.57 | 125.52 | 0.02 | 3.38 | 24.14B | 1.74M | 166.00 | 9.64M | 10-Nov-2025 14:30:28.293 |
| FIDELITYBK | 19.60 | 4.59 | 19.21 | 13.24 | 1.17 | 5.48 | 567.91B | 11.22M | 728.00 | 199.80M | 10-Nov-2025 14:31:23.413 |
| LIVESTOCK | 7.40 | 0.00 | 7.38 | 0.00 | 0.00 | 2.94 | 22.20B | 204.79K | 85.00 | 1.38M | 10-Nov-2025 14:30:26.823 |
NSE: BEAR Signal - Price crossed below 15 Day MA
This signal implies these stocks are under selling pressure and the price might continue to slide and therefore positions should be monitored closely. Further suggested analysis include looking at the overall market (ASI) to see if the downtrend is market wide, sector wide or specific to the stock. If the overal market trend is upwards, then since these stocks are heading in the opposite direction, then further analysis should be done using commands like PC and RV on the InfoWARE Market Data Terminal. Another command is ALERTS to set price triggers for possible exit is necessar
For more detailed analysis,
- On InfoWARE Market Data Terminal <BEARM> <GO>
- On InfoWARE Finance Mobile App ( Android , iPhone & iPad and Windows 10)
| Symbol | Price | %Chg | 15DMA | PE | EPS | DivY | MktCap | Vol | Trades | Value | LstTradeTime |
|---|---|---|---|---|---|---|---|---|---|---|---|
| PRESCO | 1,450.00 | 0.00 | 1,477.99 | 169.69 | 2.65 | 0.44 | 1,450.00B | 237.61K | 500.00 | 330.87M | 10-Nov-2025 14:30:29.920 |
| VITAFOAM | 94.00 | 0.00 | 94.02 | 8.66 | 2.56 | 7.03 | 117.58B | 355.89K | 143.00 | 30.11M | 10-Nov-2025 14:30:31.880 |
| NGXINDUSTR | 5,890.62 | -0.01 | 5,904.16 | 39.90 | 18.97 | 0.00 | 0.00 | 15.73M | 2,873.00 | 3.53B | 10-Nov-2025 14:31:02.710 |
| UNILEVER | 73.70 | -1.76 | 74.65 | 67.09 | 0.40 | 2.81 | 423.41B | 1.01M | 131.00 | 74.27M | 10-Nov-2025 14:30:31.483 |
| VETGRIF30 | 55.00 | -1.82 | 55.86 | 0.00 | 0.00 | 32.24K | 34.00 | 1.77M | 10-Nov-2025 14:31:24.260 | ||
| STANBICETF30 | 519.95 | -9.63 | 525.66 | 0.00 | 0.00 | 4.60K | 89.00 | 2.56M | 10-Nov-2025 14:31:24.047 | ||
| HONYFLOUR | 19.75 | -10.89 | 21.57 | 16.28 | 0.31 | 1.40 | 156.62B | 2.30M | 412.00 | 45.56M | 10-Nov-2025 14:30:25.757 |
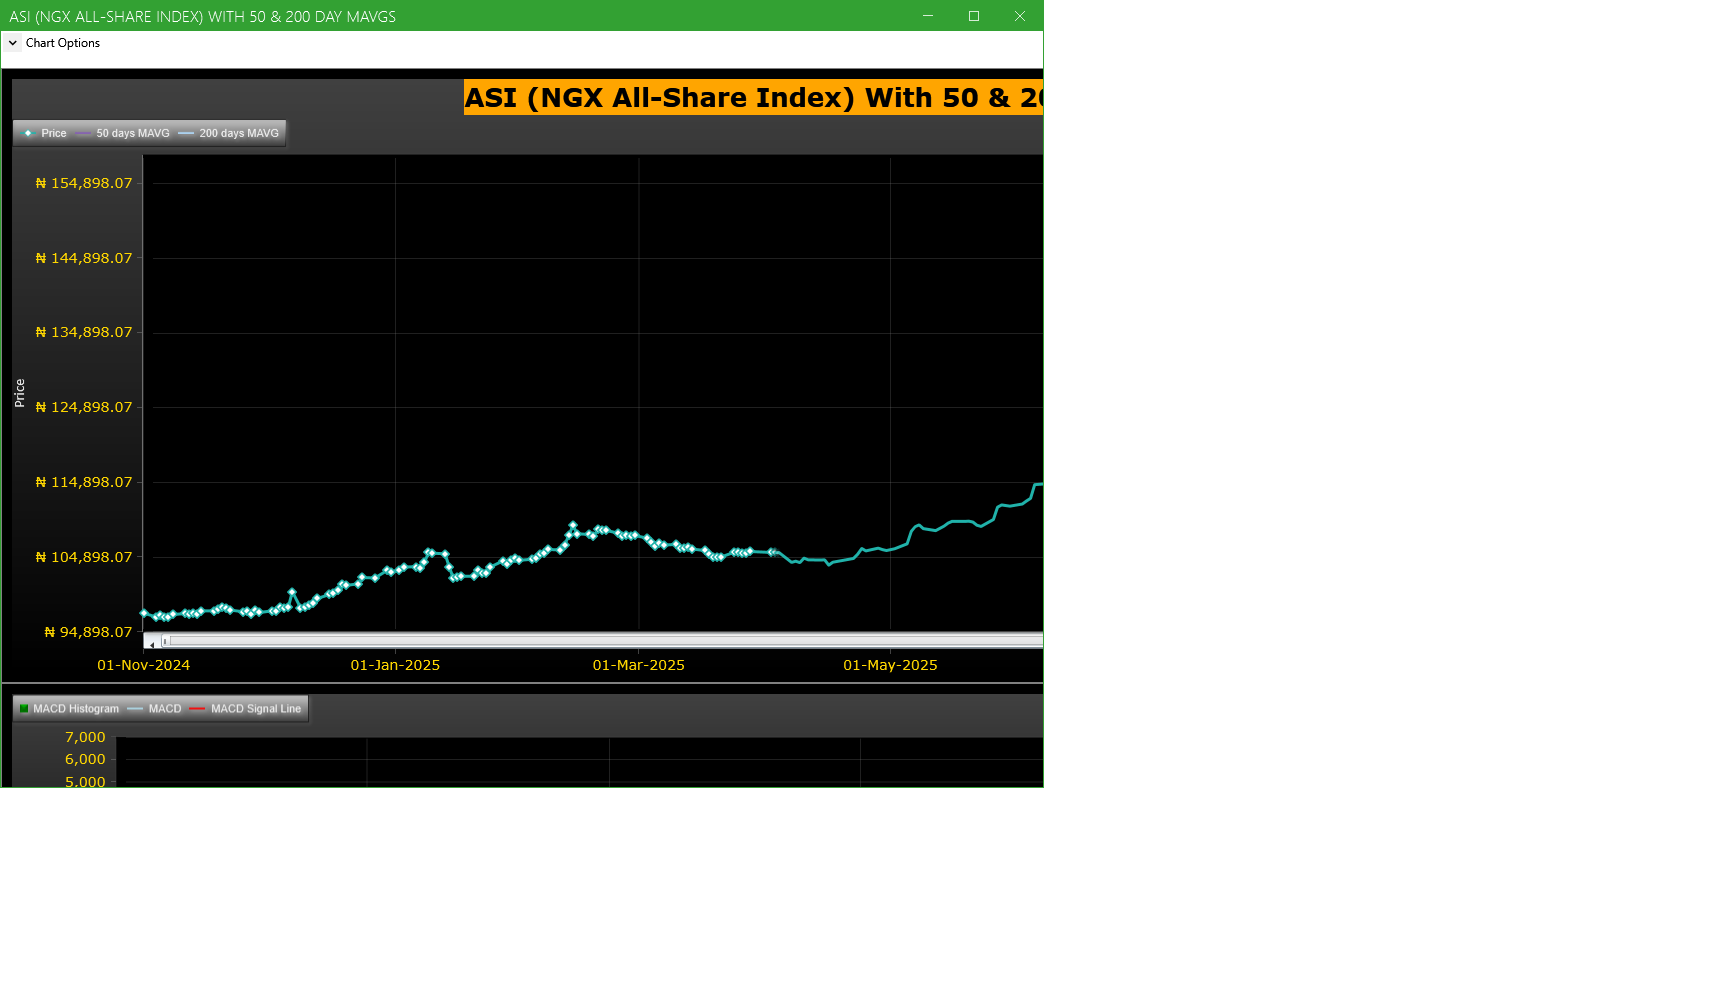
Market Trend - ASI (NGX All-Share-Index) With 50 & 200 Day MAvgs Chart
Technical traders typically use the 50 & 200 day moving averages to aid in choosing
where to enter or exit a position, which then causes these levels to act as strong
support or resistance. As a general guideline, if the price is above a moving average,
the trend is up. If the price is below a moving average, the trend is down.
It is important to note that critics of technical analysis say that moving averages act
as support and resistance because so many traders use these indicators to inform their
trading decisions. Also moving averages tend to work quite well in strong trending conditions
but poorly in choppy or ranging conditions.
Trading Strategies: Crossovers
Crossovers are one of the main moving average strategies. The first type is a price crossover,
which is when the price crosses above or below a moving average to signal a potential change
in trend. Another strategy is to apply two moving averages to a chart: one longer and one
shorter. When the shorter-term MA crosses above the longer-term MA, it is a buy signal, as
it indicates that the trend is shifting up. This is known as a golden cross. Meanwhile, when
the shorter-term MA crosses below the longer-term MA, it is a sell signal, as it indicates that
the trend is shifting down. This is known as a dead/death cross
For more detailed analysis,
- On InfoWARE Market Data Terminal <CI> <GO>
- On InfoWARE Finance Mobile App ( Android , iPhone & iPad and Windows 10) , "Research"
Unusual Volume: Volume traded is more than double the 90 day moving average (All exchanges; ASI & ASem). For more detailed analysis,
- On InfoWARE Market Data Terminal <UV> <GO>
- On InfoWARE Finance Mobile App ( Android , iPhone & iPad and Windows 10)
| Symbol | Name | Volume | 90DAvgVol | %VolChg | Price | LClose | %Chg | Trades | Value |
|---|---|---|---|---|---|---|---|---|---|
| ASOSAVINGS | ASO SAVINGS AND LOANS PLC | 14.77M | 6.50M | 127.37 | 0.99 | 0.90 | 10.00 | 282 | 14.30M |
| PZ | P Z CUSSONS NIGERIA PLC. | 12.14M | 3.45M | 252.05 | 38.50 | 39.70 | -3.02 | 248 | 473.32M |
| DEAPCAP | DEAP CAPITAL MANAGEMENT & TRUST PLC | 8.50M | 3.17M | 168.26 | 1.90 | 1.73 | 9.83 | 110 | 15.11M |
| DANGCEM | DANGOTE CEMENT PLC | 3.63M | 1.45M | 150.81 | 660.00 | 660.00 | 0.00 | 842 | 2.15B |
| NAHCO | NIGERIAN AVIATION HANDLING COMPANY PLC | 3.50M | 1.12M | 212.14 | 95.00 | 105.50 | -9.95 | 442 | 340.46M |
Investment Insights - High Div. Stocks
Dividend stocks distribute a portion of the company earnings to investors on a regular basis and they can a great choice for investors looking for regular income. As an investment or trading strategy, high dividend yield equities provide annual cash payments as against mostly capital gains in the price of a stock. The list in the table below represent the highest dividend paying stocks from the list of the most liquid stocks in the NSE top 30.
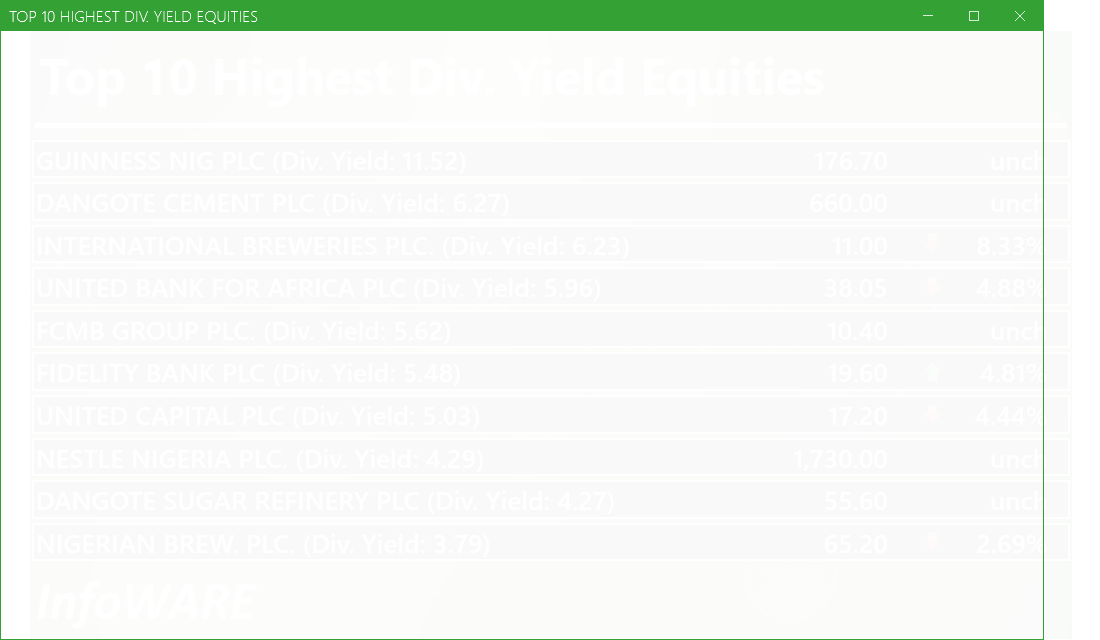
For more detailed analysis,
- On InfoWARE Market Data Terminal <HYIELD> <GO>
- On InfoWARE Finance Mobile App ( Android , iPhone & iPad and Windows 10) , "Research"
Investment Insights - Stocks outperforming the ASI but with approximately the same risk
These list of stocks represent equities that are less risky than the ASI but doing better than the ASI (All Shares Index) using the YTD (Year to Date) returns as the measure. The risk is measured by Beta. Beta is an assessment of a stock's tendency to undergo price changes, (its volatility), as well as its potential returns compared to the ASI. It is expressed as a ratio, where a score of 1 represents performance comparable to the ASI, and returns above or below the market may receive scores greater or lower than 1.
For a full list of both positively and negatively corelated stocks visit InfoWARE Market Data Terminal
- On InfoWARE Market Data Terminal <BANL> <GO>
- On InfoWARE Finance Mobile App ( Android , iPhone & iPad and Windows 10)
| Symbol | DivYield | PE | EPS | Beta | %ChgYTD | ASIYTDReturn | BetaDiff |
|---|---|---|---|---|---|---|---|
| HONYFLOUR | 1.40 | 16.28 | 0.31 | 0.99 | 185.40 | 44.24 | 0.01 |
| CAVERTON | 5.52 | 1.15 | 1.57 | 0.98 | 80.39 | 44.24 | 0.02 |
| ROYALEX | 7.81 | 0.00 | 0.00 | 0.96 | 63.64 | 44.24 | 0.04 |
| CORNERST | 5.28 | 8.62 | 0.35 | 0.93 | 51.52 | 44.24 | 0.07 |
| DEAPCAP | 13.76 | 188.84 | 0.01 | 0.89 | 58.33 | 44.24 | 0.11 |
| UNIVINSURE | 0.00 | 0.00 | 0.00 | 0.83 | 58.33 | 44.24 | 0.17 |
| FTNCOCOA | 1.60 | 0.00 | 0.00 | 0.79 | 130.32 | 44.24 | 0.21 |
| NB | 3.79 | 16.95 | 1.60 | 0.79 | 103.75 | 44.24 | 0.21 |
| MAYBAKER | 3.75 | 58.94 | 0.14 | 0.78 | 87.23 | 44.24 | 0.22 |
| UNILEVER | 2.81 | 67.09 | 0.40 | 0.75 | 104.72 | 44.24 | 0.25 |
African Markets
| Name | LClose | Change | %Chg |
|---|---|---|---|
| BRVM Stock Exchange | 336.50 | -0.84 | -0.25 |
| Botswana Stock Exchange | 10,616.43 | 0.00 | 0.00 |
| Egyptian Exchange | 39,949.66 | 817.85 | 2.09 |
| Ghana Stock Exchange | 8,229.16 | 1.65 | 0.02 |
| Johannesburg Stock Exchange | 108,846.40 | -1,255.16 | -1.14 |
| Lusaka Stock Exchange | 25,375.64 | -2.54 | -0.01 |
| Casablanca Stock Exchange | 19,268.40 | -137.78 | -0.71 |
| Malawi Stock Exchange | 613,961.24 | 122.77 | 0.02 |
| Nigeria Stock Exchange | 149,524.81 | -495.07 | -0.33 |
| Nairobi Securities Exchange | 192.07 | -0.83 | -0.43 |
| Namibian Stock Exchange | 1,960.41 | -26.22 | -1.32 |
| Rwanda Stock Exchange | 179.09 | 0.00 | 0.00 |
| Tunis Stock Exchange | 12,722.47 | -7.64 | -0.06 |
| Uganda Securities Exchange | 1,587.12 | 26.68 | 1.71 |
Nigeria Market Indexes
| Symbol | LClose | %Chg | WTD% | MTD% | QTD% | YTD% | MktCap | Trades |
|---|---|---|---|---|---|---|---|---|
| ASI | 148,832.19 | -0.46 | 0.00 | -3.19 | 4.09 | 44.25 | 30,694 | |
| NGX30 | 5,461.24 | -0.37 | 0.00 | -3.14 | 4.66 | 43.16 | 17,753 | |
| NGXAFRBVI | 3,138.25 | -1.39 | 0.00 | -5.43 | -11.59 | 26.50 | 6,326 | |
| NGXAFRHDYI | 20,558.77 | -1.42 | 0.00 | -5.68 | -7.64 | 20.74 | 7,869 | |
| NGXASEM | 1,392.88 | 0.00 | 0.00 | 0.00 | -9.44 | -12.05 | 3 | |
| NGXBNK | 1,400.75 | -0.65 | 0.00 | -4.26 | -7.65 | 28.81 | 6,756 | |
| NGXCG | 3,891.90 | -0.64 | 0.00 | -4.79 | -3.92 | 37.56 | 16,578 | |
| NGXCNSMRGDS | 3,398.84 | -1.32 | 0.00 | -4.30 | 0.47 | 95.97 | 3,893 | |
| NGXCOMMDTY | 1,210.34 | 0.00 | 0.00 | 0.22 | 7.89 | 21.03 | ||
| NGXGROWTH | 14,318.95 | -0.48 | 0.00 | -7.67 | -5.00 | 84.45 | 510 | |
| NGXINDUSTR | 5,890.62 | -0.01 | 0.00 | -1.09 | 16.24 | 64.93 | 2,873 | |
| NGXINS | 1,089.87 | -4.24 | 0.00 | -10.15 | -8.88 | 38.63 | 2,044 | |
| NGXLOTUSISLM | 13,213.38 | -0.42 | 0.00 | -2.92 | 11.31 | 89.63 | 6,748 | |
| NGXMAINBOARD | 7,127.42 | -0.55 | 0.00 | -2.75 | 1.17 | 42.44 | 21,489 | |
| NGXMERIGRW | 9,978.73 | -0.14 | 0.00 | -3.30 | 0.76 | 52.97 | 4,427 | |
| NGXMERIVAL | 12,420.04 | -1.42 | 0.00 | -4.69 | -7.09 | 19.08 | 8,528 | |
| NGXOILGAS | 2,773.07 | 0.00 | 0.00 | -0.89 | 9.78 | 2.28 | 450 | |
| NGXPENBRD | 2,795.72 | -0.29 | 0.00 | -2.64 | 5.45 | 52.64 | 25,715 | |
| NGXPENSION | 6,690.24 | -0.49 | 0.00 | -3.80 | -0.71 | 47.56 | 19,794 | |
| NGXPREMIUM | 15,080.65 | -0.32 | 0.00 | -4.00 | 10.14 | 54.94 | 8,695 | |
| NGXSOVBND | 668.40 | 0.00 | 0.00 | 0.00 | 1.69 | 11.11 | 0 |
For more detailed analysis,
- On InfoWARE Market Data Terminal <MKTINS> <GO>
- On InfoWARE Finance Mobile App ( Android, iPhone & iPad and Windows 10) , "Market Indexes"
Find the topic interesting? Will like to comment? Contact Us at solutions@infowarelimited.com
Top News

Chart Of The Day - ASI Chart Vs ASI Advance Decline Line (YTD) (10-Nov-2025 15:08:54.385)
InfoWARE AI Analyst Daily Market Report: 10-Nov-2025

[XNSA]>> DAILY FUND PRICE SUBMISSION - FCMB ASSET MANAGEMENT LIMITED
[VSPBONDETF]>> DAILY INDICATIVE PRICES
[XNSA]>> NGX FIXED INCOME INDICATIVE PRICE LIST FOR NOV 10, 2025
[XNSA]>> H2 2025 BC/DR TEST
[LOTUSHAL15]>> DAILY INDICATIVE PRICES
[XNSA]>> AELP CAPACITY BUILDING & ASSDA FORUM
[XNSA]>> FACTS BEHIND THE OFFER PRESENTATION BY ELLAH LAKES PLC
[XNSA]>> EMERGING AFRICA DAILY MUTUAL FUND PRICES
[XNSA]>> CORDROS MILESTONE FUNDS' BID & OFFER PRICES
[XNSA]>> NOTIFICATION OF PRICE ADJUSTMENT
InfoWARE Analyst Daily Market Report (10-Nov-2025 06:51:14.061)
InfoWARE AI Analyst Weekly Market Report: 07-Nov-2025
Chart Of The Day - ASI Chart Vs ASI Advance Decline Line (YTD) (07-Nov-2025 15:07:17.151)
InfoWARE AI Analyst Daily Market Report: 07-Nov-2025
[XNSA]>> NORRENBERGER MUTUAL FUNDS WEEKLY UPDATE
[MERVALUE]>> DAILY INDICATIVE PRICES
[LOTUSHAL15>> DAILY INDICATIVE PRICES
[VSPBONDETF]>> DAILY INDICATIVE PRICES
[XNSA]>> CORDROS MILESTONE FUNDS' BID & OFFER PRICES
[XNSA]>> NGX FIXED INCOME INDICATIVE PRICE LIST FOR NOV 07, 2025
[XNSA]>> H2 2025 BC/DR TEST
[XNSA]>> AELP CAPACITY BUILDING & ASSDA FORUM
[XNSA]>> FACTS BEHIND THE OFFER PRESENTATION BY ELLAH LAKES PLC
[XNSA]>> ACTIVATION OF CODE FOR TRADING IN RIGHTS
[SIAMLETF40]>> DAILY INDICATIVE PRICES
Chart Of The Day - ASI Chart Vs ASI Advance Decline Line (YTD) (06-Nov-2025 15:08:19.029)
InfoWARE AI Analyst Daily Market Report: 06-Nov-2025
[XNSA]>> APPOINTMENT OF DIRECTORS
Get IDIA - the stock trading app for the modern investor
Solutions by Business
Product Suites
Company
Contacts
- 8th Floor,
- South Atlantic Petroleum Towers,
- 1 Adeola Odeku Street,
- Victoria Island,
- Lagos, Nigeria.
- Email: solutions@infowarelimited.com
Follow Us
 |
 |
 |
 |